Press Releases
JAMSTEC
SASAKAWA PEACE FOUNDATION
Ocean Acidification in the Coastal Regions of Japan Revealed using Open Access pH Data
1. Key points
- ◆
- The results of statistical analyses using pHinsitu data from public water areas revealed the existence of a significant acidification trend in the coastal regions around Japan (0.0014–0.0024 /year) from 1978 to 2009.
- ◆
- In contrast to pelagic (i.e., open-ocean) regions, it is possible for acidified, basified, and neutral areas to coexist in some coastal regions.
- ◆
- Understanding the reality of ocean acidification is a pressing matter; thus, more reliable data would be necessary to study the current status of ocean acidification in coastal regions.
2. Overview
The monitoring of water quality in the coastal regions around Japan continue from 1970s to help protect coastal water and groundwater from pollution and retain the integrity of water environments under the leadership of the government under Water Pollution Control Law (WPCL) monitoring program (* Figure 1). Several environmental variables, including pHinsitu, have been continuously measured in coastal water since 1978. Until now, it has been unknown how ocean acidification is progressing in the coastal regions of Japan because there were not enough observation data available and there has been no ocean acidification analysis covering all coastal regions, even in the world. Considering the accuracy of the measured pHinsitu data, they are seemingly unsuitable for evaluating the levels of ocean acidification, but the collection of relevant data on public water areas only began in the 1970s before ocean acidification began to draw public and/or research attention. Such data is valuable to see larger scale maps of coastal acidification. We therefore examined the ocean acidification status of the coastal regions around Japan by using pHinsitu data and then focused on the general characteristics of the overall pH trends rather than examining the trend in pH at each site in detail, after carefully considering the accuracy of the dataset. Suitable analytical method demonstrated that there was a significant overall trend toward acidification in the coastal regions of Japan (0.0014–0.0024 /year) from 1978 to 2009 (Figure 2). The trends however varied by region among the sampling points, 70–75% showed an acidification trend, while 25–30% exhibited a tendency toward basification (Figure 3). Since understanding the reality of ocean acidification is a pressing matter, more reliable data would be necessary to study the current status of ocean acidification in coastal regions.
This study was conducted as part of the “Research and Countermeasures Regarding Global Warming and Ocean Acidification” project undertaken at the Ocean Policy Research Institute of the Sasakawa Peace Foundation.
The paper was published in the Biogeoscience on December 16th, 2019 (JST).
- Application Laboratory, JAMSTEC
- The Ocean Policy Research Institute of the Sasakawa Peace Foundation
- The National Research Institute of Far Seas Fisheries
【Supplemental Information】
- *pHinsitu:
- pH values indicate the concentration of hydrogen ions, which is a measure of acidity and thus, acidification. pH changes according to water temperatures, salinity, dissolved organic carbon, alkalinity; the pHinsitu used here represents the pH value on the NBS pH scale. These values were obtained from the environmental database of the National Institute for Environmental Studies. As the yearly local minimum and maximum values of the pHinsitu are listed in the database, both types of values were used. Data, including the values that show the water quality of public water areas are available at: https://www.nies.go.jp/igreen/md_down.html.
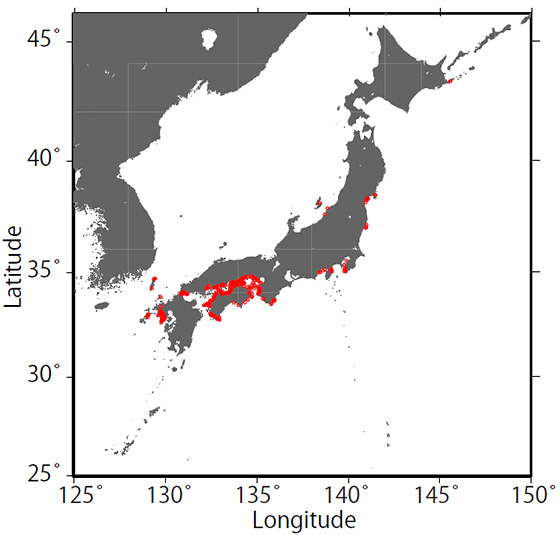
Figure 1. The map showing 289 monitoring points (red). The 289 observation points were judged to be less affected by changes in extrinsic factors (e.g., biological activities) and less variable among the all monitoring points (1481 monitoring points).
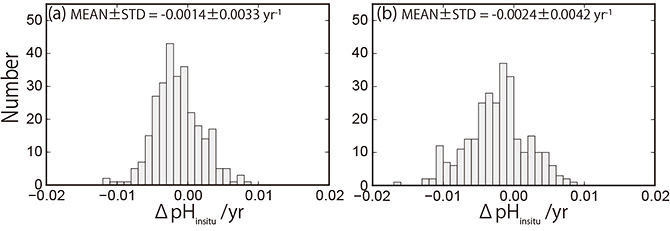
Figure 2. Histograms showing the trends, means, and standard deviations of pHinsitu data for the 289 observation points. (a) Local minima of pHinsitu. (b) Local maxima of pHinsitu.
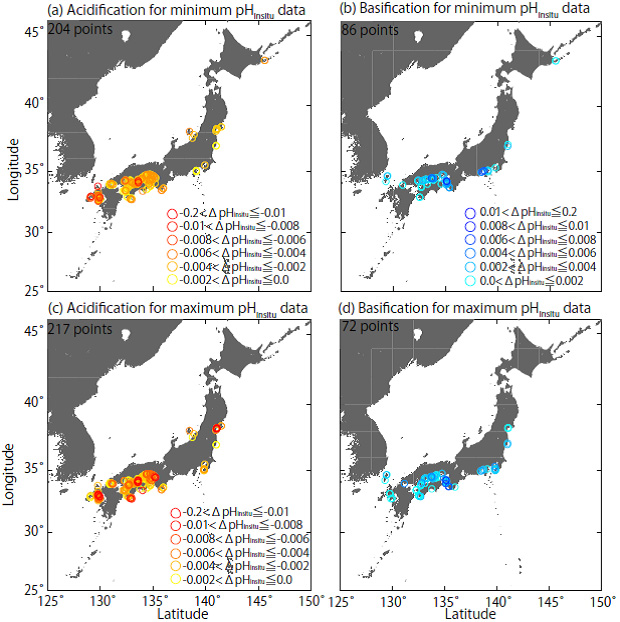
Figure 3. Distribution of areas where trends toward acidification and basification were detected. (a) Acidification recorded by local minimum pHinsitu; (b) basification recorded by local minimum pHinsitu; (c) acidification recorded by local maximum pHinsitu; (d) basification recorded by local maximum pHinsitu. Acidification is shown in warm colors, while basification is shown in cool colors.
Contacts
- (For this study)
- Miho Ishizu, Scientist, Application Laboratory, JAMSTEC
Tomohiko Tsunoda, Scientist, The Ocean Policy Research Institute of the Sasakawa Peace Foundation - (For press release)
- Public Relations Section, Marine Science and Technology Strategy Department , JAMSTEC
Public Relations Office, Atmosphere and Ocean Research Institute, The University of Tokyo