Press Releases
JAMSTEC
KOBE UNIVERSITY
National Institute for Environmental Studies
Major Reduction in Black Carbon Emissions from China Over the Past Decade – A revision of the emission inputs to IPCC climate models is needed
1. Key points
- ◆
- Highly accurate observations of air pollution on Fukue Island, western Japan, have revealed a rapid reduction in black carbon emissions from China by as much as 40% over the past decade.
- ◆
- The fine particulate (PM2.5) emissions reduction measures in China are considered to have driven the reduction in black carbon emissions.
- ◆
- In the Sixth IPCC Assessment Report, which is to be published in 2021, the effects of black carbon emissions on climate are assessed assuming that these emissions increased until 2014; however, this should be revised in the seventh assessment.
2. Overview
Dr. Yugo Kanaya of the Earth Surface System Research Center (ESS) in the Research Institute for Global Change (RIGC) at the Japan Agency for Marine–Earth Science and Technology (JAMSTEC) and colleagues have worked jointly with Kobe University and the National Institute for Environmental Studies to conduct long-term atmospheric observations on Fukue Island in Nagasaki Prefecture, Japan. Their efforts have revealed a substantial reduction, by as much as 40%, in black carbon (BC) emissions from China over the past decade. Black carbon particles, also known as soot, are emitted into the atmosphere as a result of the incomplete combustion of fossil fuels and biomass. As BC contributes to global warming as CO2, it is important to understand changes in BC emissions and to assess their effects on the global climate.
Black carbon emissions have been estimated based on socioeconomic statistics, but the range of uncertainty remained wide, at 0.5–2 times the median value. Additionally, there has been no consensus on whether or not emissions from China, considered to account for as much as 30% of global emissions, were increasing or decreasing. Therefore, in the study summarized here, atmospheric BC concentrations on Fukue Island, where air pollution from China tends to arrive via the prevailing westerlies, were monitored continuously for more than 10 years, from 2009 to 2019, and based on these trends, the emissions and changes therein of BC were estimated. As a result, the uncertainty in BC emissions from China was narrowed to ±27%, and a substantial reduction in emissions – by as much as 40% over the past decade – was discovered. In the Sixth Intergovernmental Panel on Climate Change (IPCC) Assessment Report (IPCC AR6), which is currently being compiled for publication in 2021, the effects of BC emissions from China on the climate are assessed based on the assumption that these emissions increased until 2014. However, the results of this research clearly show for the first time that the trend is in the opposite direction. The reason for this declining trend is thought to be that policies aimed at reducing the atmospheric particulate matter <2.5 μm in size (PM2.5) in China have also curbed BC emissions, which are a component of PM2.5. This means that the effect of BC on global climate change is, in fact, lower than the assessment in the forthcoming IPCC AR6. It is hoped that these results will be of use for improving simulations in the seventh IPCC assessment cycle, and that they will also be applied in the creation of inventories for short-lived climate forcer (SLCF) emissions, due to be considered therein.
This research was conducted as part of the Environment Research and Technology Development Fund (ERTDF) of the Ministry of the Environment of Japan (Grant No. 2-1803) and the Arctic Challenge for Sustainability (ArCS) Project. The findings were published in Atmospheric Chemistry and Physics on June 5, 2020 (JST).
- Earth Surface System Research Center, Research Institute for Global Change, JAMSTEC
- Graduate School of Maritime Sciences, Kobe University
- Center for Global Environmental Research, National Institute for Environmental Studies
- National Institute of Polar Research
- International Institute for Applied Systems Analysis
3. Background
Long-lived greenhouse gases (GHGs), including CO2, are well known as substances that cause global climate change, and more specifically, global warming. However, climatic effects of SLCFs, which are air pollutants that affect the climate, are important as well and therefore it is essential to quantify their emissions. Generally, the emission estimates of GHGs or SLCFs are initially built with socioeconomic statistics but require verification from independent information, for example, from those reversely calculated from the atmospheric concentration observations. For example, nitrogen oxide (NOx) emissions are verified with satellite observations of the main component, NO2, while CO2 emissions are evaluated based on highly accurate field observations at multiple sites worldwide. However, in the case of BC, reliable long-term observation data are scarce, and this kind of verification had not yet been conducted. Moreover, the removal rate of BC with rainfall, which determines the time that BC remains in the air, was highly uncertain, and it was therefore considered difficult to estimate emissions from atmospheric concentrations. Consequently, very few assessments based on observations relating to BC emissions and changes in such emissions have been conducted, even for major sources, such as China – analyses have lagged far behind those on other atmospheric pollutants. At JAMSTEC, the concentrations of atmospheric components, such as PM2.5 and BC, were measured continuously at the Fukue Atmospheric Environment Observatory (Figure 1) beginning in 2009, and the physical and chemical processes associated with their travels with the prevailing westerlies from China were revealed (Published Reports: August 31, 2016; October 1, 2019). The study summarized here further extended these observations and used the long-term data over the decade from 2009 to 2019 to assess emissions of BC from China and their trends over that period.
4. Results
Long-term observations on Fukue Island revealed a striking change in BC concentrations, which declined by 48% between 2010 and 2018 (-5.8±1.5% per year) (Figure 2). In this study, two types of measuring instrument (COSMOS and MAAP*1) were operated in parallel so that any periods missed by one instrument were covered by the other. These instruments are highly reliable in that they are not susceptible to interference from other coexisting aerosol particles (sulfates, etc.). By integrating the data from the two types of instruments, data were obtained for a period of 122 months without any gaps, which allowed the long-term trends to be evaluated.
Two different ideas were adopted to allow the effects of emissions only, excluding other meteorological factors, to be evaluated. First, to remove the influence of variation in rainfall, which washes BC out of the atmosphere, only observation data on air masses with an accumulated precipitation along their trajectory to Fukue Island of <1 mm were analyzed (Figure 3a, center, blue line); a report published on August 31, 2016 summarizes the method used to evaluate emissions by separating the influence of wet removal based on accumulated precipitation. In addition to rainfall, wind systems are relevant to whether or not air pollutants may be easily carried from the source (China) to Fukue Island. The influence of interannual variations in these wind systems were estimated via numerical simulations using an atmospheric chemical transport model (WRF/CMAQ) (*2) (Figure 3a, center, gray line) and were considered in subsequent analyses. In doing so, emissions were fixed at the base year values (e.g., 2008 emissions from REAS version 2.1 (*3), background of Figure 1), and only weather information for each year was used.
In years when pollution flowed readily into the region, such as 2011 and 2014, concentrations tended to increase in both the observations and the simulations, and it is evident that BC concentrations are influenced by interannual variations in wind systems. Further, dividing the average concentration observed each year by the value in the same year of the WRF/CMAQ model negated the influence of wind systems and revealed the correction factor for changes in annual emissions, which was the only item not considered in the simulation (Figure 3a, right). This factor decreased markedly (by -5.3±0.7% per year), and it was therefore concluded that the main cause of changes in BC concentrations was actually the change in emissions. When this analysis was carried out for each of the main emissions regions over which air masses pass to arrive at Fukue Island (i.e., northeastern China, north-central China, south-central China, and southern China) and the trends in emissions changes for each region were evaluated (Figure 3b), it became clear that the rate of decline tended to be greater in the two southern regions (-5.9 to -6.3% per year) than in the two northern regions (-2.1 to -5.2% per year).
By multiplying the correction factor with the 2008 emissions from REAS version 2.1, the correct emissions for the four regions in China were re-estimated for each year. Additionally, changes in emissions from across China were estimated by summing the four regions. As a result, BC emissions from China were estimated to have decreased rapidly and by as much as 35%, from 1.61 Tg/year in 2009 to 1.06 Tg/year in 2018 (-4.6% per year) (Figure 4a, red line). This rate of decline, which reached as much as 40% over the decade, was determined to be on a par with the rate of NOx emissions reductions in developed countries, including Japan, the United States, and across much of Europe (e.g., Published Report: January 27, 2017). Finally, the uncertainty of estimated BC emissions in this study was calculated to be ±27% based on the uncertainty of the observations and models. This means that the method used here substantially narrowed the uncertainty when compared to previous estimations, where it was as much as 200% (0.5–2 times the median value).
The emissions estimated from the observations were used in a comparative evaluations with inventories of BC emissions from China estimated from socioeconomic information (Figure 4a). The BC emissions from China differed by nearly two times, depending on the inventory, and with both increasing and decreasing trends in recent years; previously, there was no consensus on these emissions. For example, the values according to the Community Emissions Data System (CEDS) inventory used in the IPCC AR6 were remarkably high and increased until 2014, which is contrary to the declining trend demonstrated in this study. Meanwhile, values from inventories that incorporated the emissions reduction effects of policies aimed at improving levels of PM2.5 in China, such as MEIC v. 1.3 and ECLIPSE v. 6b, showed declining trends that are consistent with the results of this study, indicating that policies aimed at reducing PM2.5 emissions in China were successful, and that the emissions of BC, a component of PM2.5, also declined. The estimated rate of change in BC emissions (-4.6% per year) relative to the 2012–2015 values was compared with future trends in BC emissions in China under various socioeconomic scenarios (SSP1–5) used for the future climate predictions in the IPCC AR6 (Figure 4b). The results suggested that BC emissions are declining at a rapid pace that exceeds even the reduction rates in scenarios SSP1-19 and SSP1-26 (-3.9 and -3.5% per year, respectively), which assume that the most stringent reductions began at an early stage.
5. Future Outlook
In this study, it was not possible to analyze the sectors (e.g., industrial, automotive and residential transport, etc.) from which BC emissions have been reduced in recent years, or which sectors are currently the main sources of emissions. However, guided by the fact that radiocarbon measurements show the main emissions source to be fossil fuel combustion (Published Report: October 1, 2019), and because the decrease in BC concentrations brought about by a dramatic decline in industrial activities due to the spread of COVID-19 in the spring of 2020 will be analyzed in the future, there are plans to conduct an evaluation according to emissions sector. This study revealed that BC emissions from China are lower than the values currently used in climate simulations in the IPCC AR6 and the declining trend is striking, which suggests that the actual warming effects of BC are also lower than in the evaluation to be presented in the IPCC AR6. However, concentrations of sulfate aerosols and other substances that contribute to cooling have also decreased markedly and slightly ahead of BC, creating an overall trend toward the intensification of global warming. Therefore, the effects of progress in reducing BC emissions revealed by this study are considered to merely counteract part of that trend. It is hoped that these results will be of use in improving simulations in the seventh IPCC assessment cycle and that they will also be applied to create SLCF emissions inventories for consideration therein.
【Supplemental information】
- *1
- COSMOS and MAAP:
Two types of highly reliable measurement instrument. Black carbon makes up only between 1 and 5% of atmospheric PM2.5, and it is important in terms of measurement reliability that BC is adequately differentiated from other components, such as coexisting sulfate aerosols. In this study, the reliability of typical BC meters based on light absorption was enhanced by: (1) using a Continuous Soot Monitoring System (COSMOS), manufactured in Japan, in which the air passes through a pre-heater maintained at a temperature of 300℃ to decompose and vaporize most coexisting components, thereby minimizing their influence, and (2) using a Multi-Angle Absorption Photometer (MAAP) capable of estimating and correcting for the effect of light scattered by other components by measuring back-reflectance at two angles, as well as transmittance, when measuring light absorption at the filter. The difference between BC concentrations on Fukue Island from the two types of instruments remained almost constant over the long term (14%), and a good agreement was confirmed with measurements based on a laser-induced incandescence, a different method that has become widely used in recent years.
- *2
- WRF/CMAQ atmospheric chemical transport model:
An air quality model (the Community Multiscale Air Quality Modeling System, CMAQ) that evaluates the processes of the formation/destruction, transport, and deposition of substances in the air and calculates their atmospheric concentrations and deposited amounts, using meteorological information calculated by the Weather Research and Forecasting (WRF) model. The combined model may be used to determine the components of PM2.5 and estimate their origins.
- *3
- REAS version 2.1:
The 2013 version of the Regional Emission Inventory in Asia (REAS) model created by the National Institute for Environmental Studies, Japan (NIES) and the Asia Center for Air Pollution Research (ACAP) of the Japan Environmental Sanitation Center (JESC). The emissions of various atmospheric pollutants and substances related to global climate change are estimated based on the amount of activity by source (e.g., energy consumption, vehicle travel distance, etc.) and the corresponding emissions factors (i.e., emissions per unit activity), and these emissions are then plotted on a 0.25º grid.
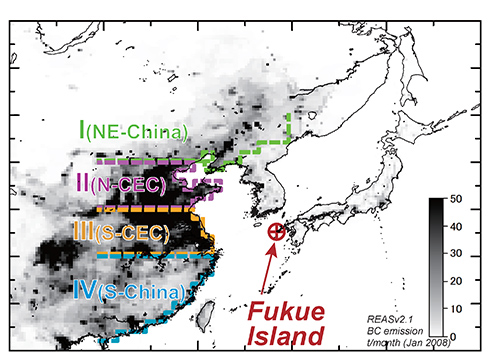
Figure 1: Location of Fukue Island, Nagasaki Prefecture, Japan. The background is a map of estimated BC emissions. Air is carried from major source regions, such as north-central and south-central China, over the East China Sea to Fukue Island within approximately 6 to 46 hours.
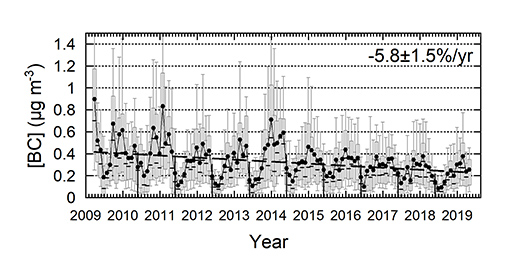
Figure 2: Long-term declining trend in atmospheric BC concentrations on Fukue Island. Data were obtained over a period of 122 months without any gaps by integrating data from two types of highly reliable measuring instrument (COSMOS and MAAP). These instruments were used in combination so that if one failed for certain period, the measurements would be covered by the other instrument.
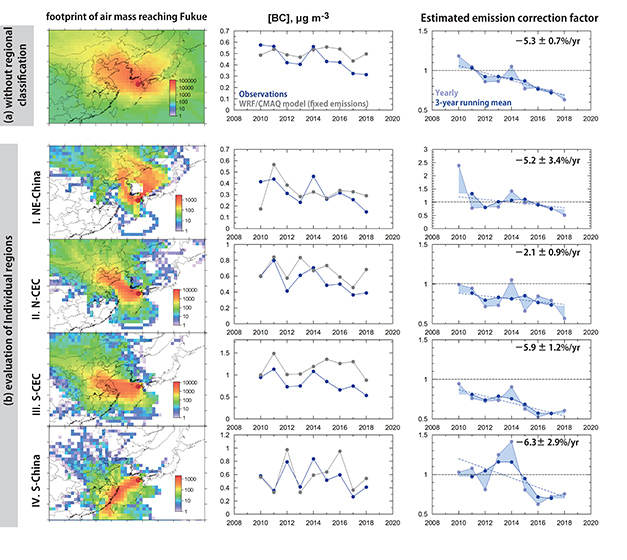
Figure 3: (Left) Distribution of air mass trajectories flowing toward Fukue Island. (Center) Interannual variations in BC concentration(observations: blue line; WRF/CMAQ model (emissions are fixed and variations due to wind are modeled): gray line). (Right) The observation/model ratio is regarded as the “emissions correction factor,” and long-term changes in this factor, with the influence of wind removed, are regarded as changes in emissions. (a) Evaluation of the region without the classification of air mass trajectories; (b) evaluation of each of the four regions in China.
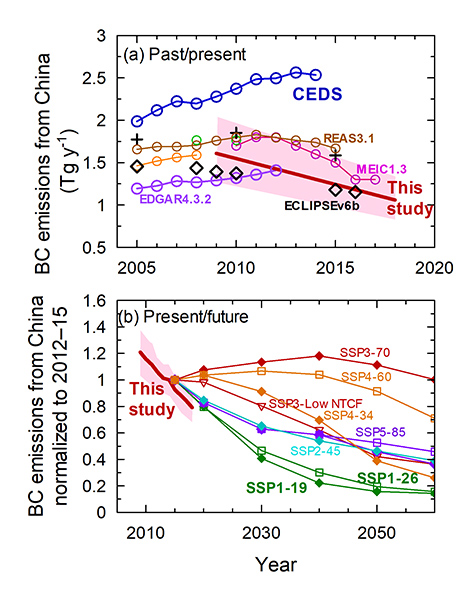
Figure 4: (a) Declining trend in BC emissions from China estimated in this study (red line). The CEDS inventory used in the IPCC AR6 yields a continually increasing trend, which is opposite to the results of this study. Inventories that incorporated PM2.5 measures in China, such as REAS3.1, MEIC1.3, and ECLIPSEv6b, yield declining trends that are consistent with this study. (b) Comparison of the declining trend in this study relative to values from 2012–2015, with BC emissions from China according to various socioeconomic scenarios (SSP1–5). The rate of decline in BC emissions estimated in this study was comparable to scenarios SSP1-19 and SSP1-26, which assumed the most stringent reductions.
Contacts
- (For this study)
- Yugo Kanaya, Principal Scientist, Earth Surface System Research Center, Research Institute for Global Change, JAMSTEC
- (For press release)
- Public Relations Section, Marine Science and Technology Strategy Department, JAMSTEC