Press Releases
JAMSTEC
RIKEN
National Institute of Polar Research
KYOTO UNIVERSITY
Enabling simple assessment of the impact of observation data on weather forecast, and clarifying the contribution of Arctic observation data to improve seven-day North American weather forecast
1. Key points
- ◆
- Research groups from JAMSTEC, RIKEN, National Institute of Polar Research, and Disaster Prevention Research Institute, Kyoto University introduced a method that can assess the impacts of weather observations (Ensemble-based Forecast Sensitivity to Observation, EFSO) by applying it to the data assimilation system at JAMSTEC to confirm its applicability.
- ◆
- EFSO can accurately estimate the impact of specific observations in each latitudinal band from the Arctic, midlatitude, and tropical regions, on a short-range forecast (2–3 days).
- ◆
- The Arctic observation data improve medium-range forecast (6–7 days) for North America.
2. Overview
Akira Yamazaki, researcher at the Application Laboratory of JAMSTEC, introduced the EFSO (*1) tequnique together with the RIKEN Center for Computational Science, National Institute of Polar Research, and Disaster Prevention Research Institute, Kyoto University and confirmed its effectiveness. It was also established that the Arctic observation data improve the 6–7 day forecast for North America.
The weather forecast is simulated based on global observation data composed of satellite and in-situ observations (Figure 1). To improve forecast accuracy, it is important to evaluate the impact of each observation on the forecast (hereinafter referred to as “observation impact”). However, such evaluations have not been typically performed due to high calculation costs. Thus, the present research group equipped the JAMSTEC supercomputer “Earth Simulator” with the EFSO calculation and examined whether EFSO can accurately estimate the observation impact of radiosonde (*2) measurements obtained on land in the Northern Hemisphere (Figure 2).
The result showed that EFSO efficiently estimated the observation impact for up to two days. When limited to the observation impact in the Arctic, the 6–7 day forecast for the midlatitude regions in North America was improved (Figures 3, 4, and 5).
In the future, the EFSO technique can be applied to plan effective observational campaigns to improve weather forecasts.
The present result was published in the academic journal Weather and Forecasting of the American Meteorological Society on April 30 (Japan time). The present study was funded by JSPS KAKENHI (26282111, 15H02129, 17K05663, 18K13617, 18H03745, 18KK0292, and 19H05702) and ArCS (Arctic Challenge for Sustainability).
- Application Laboratory, JAMSTEC
- RIKEN Center for Computational Science
- National Institute of Polar Research
- Disaster Prevention Research Institute, Kyoto University
【Supplemental information】
- *1
- EFSO (Ensemble-based Forecast Sensitivity to Observations):
It is a calculation method that estimates the observation impact and is also called Forecast Sensitivity to Observations (FSO). It quantifies the improvement of the forecast by each observation (=observation impact). Conventionally, a highly-developed model called an “adjoint model” used by such as operational organizations was necessary; however, it has recently become possible to substitute it by simple (ensemble) forecast models used for a data assimilation system. This led to the formulation of EFSO.
- *2
- Radiosonde observations:
A weather balloon in which a sensor is attached to observe vertical distribution of meteorological elements such as temperature and wind. It can observe above the upper troposphere (at an altitude of 10 km) to the stratosphere. The observation is performed twice a day across the world (once a day in some locations), and the data are reported in real time using Global Telecommunication System (GTS), available at weather forecast centers in each country.
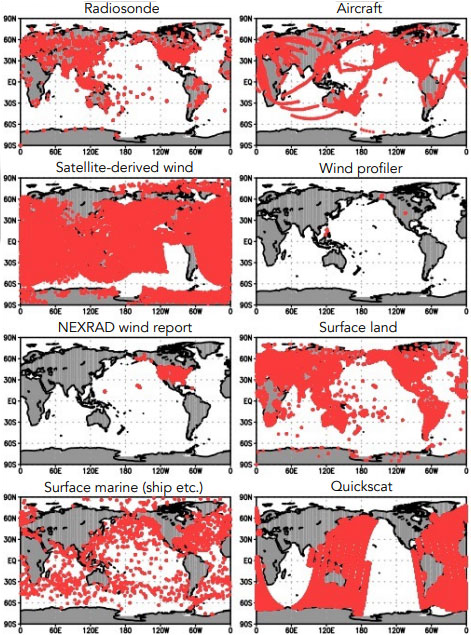
Figure 1: Global observation at 9:00 JST January 23, 2016 (0:00 UTC). There are more than 100,000 observations overall.
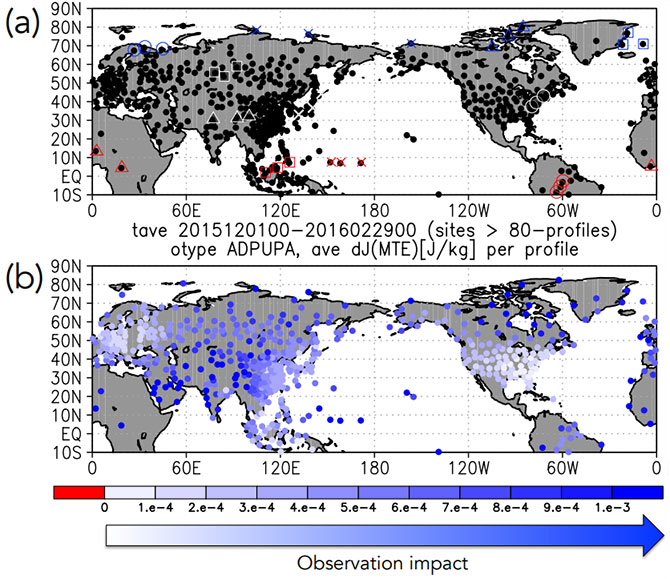
Figure 2:(a) Distribution of radiosonde observation points in the Northern Hemisphere. It shows that there are vast number of individual radiosonde observations. Figure additionally shows 12 specific observation points for the Arctic (blue), midlatitude (black with white outline), and tropical regions (red) (three each). These observations are used for experiments in Figures 2–5. (b) Observation impact of each radiosonde observation point estimated by EFSO. The higher observation impact means more accurate forecast (radiosonde observation point is bluer).
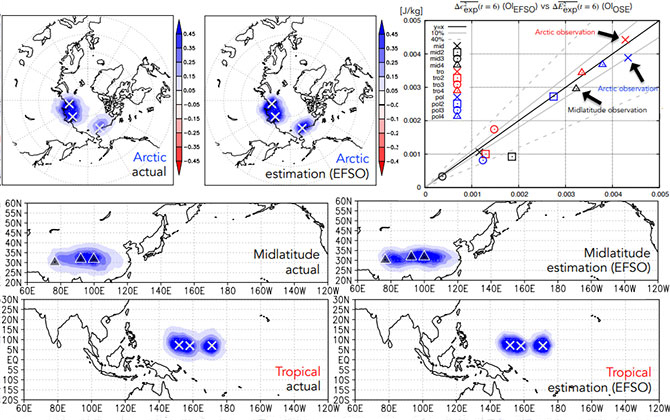
Figure 3: Comparison of observation impact estimated by EFSO with that obtained by highly calculational cost experiments. The top right scatter plot shows observations at 12 points indicated in Figure 2(a), where the Arctic regions are blue, midlatitude regions are black, and tropical regions are red. On the scatter plot, the horizontal axis shows the EFSO estimates, and the vertical axis is the actual observation impact obtained by the experiments. When the value is close to the black y = x line, it implies that the EFSO-estimated and the actual observation impacts are close (that is, EFSO accurately estimates the actual observation impacts). The maps on the top and bottom left show the map distributions of the EFSO-estimated and the actual observation impacts, respectively, at a point selected from each latitudinal band. When these distributions are averaged for the whole globe, the value of the scatter plot can be obtained. Symbols on the maps show their observation points (see Figure 2a).
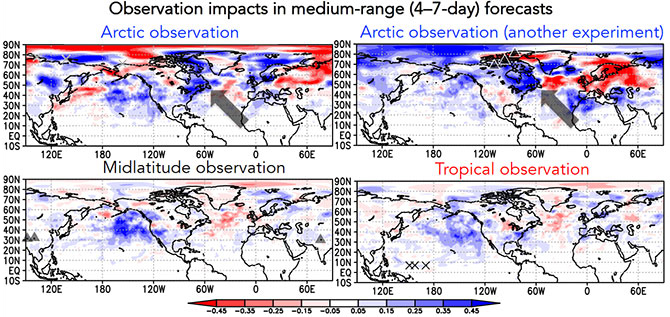
Figure 4: Distribution of actual observation impact (obtained in an observation system experiment) on the 4–7 day forecast (medium-range) in the Arctic, midlatitude, and tropical regions (same as in Figure 3). For comparison, in addition to three cases presented in Figure 3, we added an additional case of the Arctic observation (right-top panel). Blue presents observation impact, and red is “negative (non-beneficial) observation impact.” Symbols show each observation point (see Figure 2a).
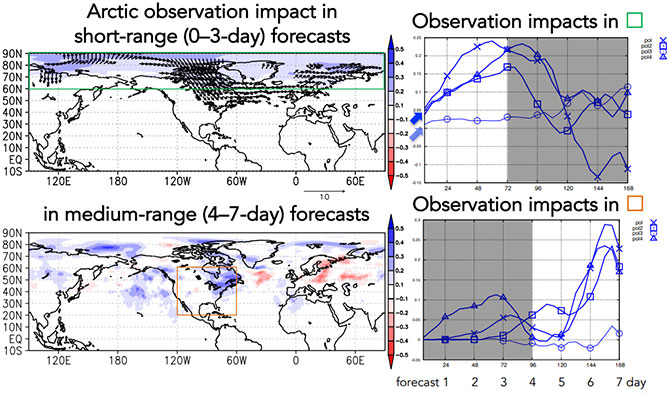
Figure 5: Distribution of actual observation impact with Arctic observation synthesized (averaged) for four Arctic experiments (left). The left-top panel is the observation impact on a short-range forecast, whereas the left-bottom panel is that on a medium-range forecast. The arrow in the top figure shows the flux of the observation impact (direction and size). The right graph shows the development of the observation impact over time (up to the 7th day of the forecast) in the Arctic regions (top) and North America (bottom) regarding each point. The top graph shows the average of the green box in the top left panel (short-range forecast is emphasized), and the bottom graph shows the observation impact of the average in the orange box in the bottom left panel (medium-range forecast is emphasized). The thick line in the right figure shows the experiment at three Arctic points where the observation impact estimated by EFSO is large (blue thick arrow in the right top graph), whereas the thin line shows an Arctic experiment at one point with minor impact (blue thin arrow in the right top graph).
Contacts
- (For this study)
- Akira Yamazaki, Researcher, Application Laboratory (APL) of Research Institute for Value-Added-Information Generation (VAiG), JAMSTEC
- (For press release)
- Public Relations Section, Marine Science and Technology Strategy Department, JAMSTEC