
TRITON array configuration
The TRITON array is shown in Fig.1. Basically, the TRITON buoy array is following the TAO array design (Hayes et al., 1991). Harrison (1989) showed that 7N-7S wind data sets were necessary to simulate the 1982-83 El Nino with a numerical model. He also suggested that, in the zonal direction, basin scale wind fields would be required because planetary waves forced by surface winds in remote areas could propagate across the basin. Harrison and Luther (1990) showed that correlation scales of surface winds were 10 degrees longitude and 2 degrees latitude. The TAO array was designed based on these values.
For the TRITON array, the equatorial currents in the western Pacific which are quite important for water mass formation by transporting heat and salt, must be considered. The currents vary slowly in the zonal direction but over short distances in the meridional direction. The Equatorial Undercurrent is found between 2N-2S (2-degree corresponds to the internal Rossby radius near the equator), and the North Equatorial Counter Current flows between 5N-8N. The hydrographic structure depends on the movement of these equatorial currents; therefore, the meridional spacing must be suitable to resolve the effects of these currents. The equator acts as a kind of boundary when one considers the salinity transport from the southern hemisphere to the northern hemisphere. This is apparent in a high resolution global ocean circulation model. In the model, the New Guinea Coastal Undercurrent transports high salinity water across the equator, and may induce large eddies such as the Harmahera eddy. Furthermore, the Mindanao eddy is induced by the South Equatorial Current, the Mindanao Current and the North Equatorial Counter Current off the Philippines. Such large scale eddies may contribute to the horizontal mixing of heat and salinity in the thermocline layer and may contribute to surface layer processes in the warm pool. Thus, the TRITON array, which is more closely spaced in the zonal direction than the TAO array, is designed to measure the water mass variations associated with these currents and eddies.
As mentioned above, the array of TRITON buoys is designed to monitor ENSO covering the entire Pacific basin jointly with the TAO array, to study the heat and salt budgets, and to study water mass variability in the warm pool region.
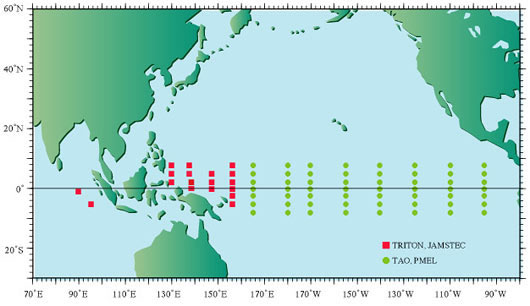
Figure 1 TRITON array with TAO array.
Two TRITON buoys were deployed in the eastern tropical Indian Ocean in October 2001. One TRITON buoy is located at 1.5S, 90E to determine the upper-layer variations associated with the zonal jets along the equator (Originally it was planned at 0N,90E, but technologically it is difficult to design the buoy to survive the Indian Ocean equatorial jets). Another buoy was deployed at 5S, 95E, to investigate the contribution of the surface heat flux and the ocean dynamics/thermodynamics to the SST variability in the eastern part of the DM. This location corresponds to the center of the area where the maximum SST anomaly appears during the peak period of the DM.