Impact of the Indian Ocean Dipole on the Southern Oscillation
Swadhin K. Behera1 and Toshio Yamagata1,2
1IGCR/Frontier Research System for Global Change, 3173-25 Showa-machi, Kanagawa 236-0001, Japan
2Department of Earth and Planetary Science, Graduate School of Science
Submitted to J. Climate
The influence of the Indian Ocean Dipole (IOD) on the interannual atmospheric pressure variability of the Indo-Pacific sector is investigated. Statistical correlation between the IOD index and the global sea level pressure anomalies demonstrates that loadings of opposite polarity are distributed between the western and the eastern parts of the Indian Ocean. The area of positive correlation in the eastern part even extends to the Australian region and the IOD index has a peak correlation of about 0.4 with the Darwin pressure index that is the western pole of the Southern Oscillation. This relation has undergone decadal changes; significant reduction in the correlation is found during the period from 1977 to 87 due to the decrease in the IOD occurrence. It is noted, however, that the IOD index has almost no correlation with the sea level pressure anomaly of the eastern Pacific.
The Southern Oscillation (SO) is traditionally known as a seesaw in the atmospheric sea level pressure between the region that covers from the central to the eastern tropical Pacific and the region covering the tropical Asia-Pacific. Historically, the SO study has its root in the predictability of the Indian summer monsoon (Walker 1924). The interesting seesaw in the atmospheric pressure field was later linked to the well-known SST variability in the eastern tropical Pacific Ocean by Bjerknes (1969). This combined phenomenon, commonly known as the El Niño-Southern Oscillation (ENSO), is identified as the most dominant climate signal that affects the weather and climate worldwide. For further understanding of the ENSO theory and observations, readers may refer to Philander (1990) and the recent review articles of Neelin et al. (1998) and Wallace et al. (1998).
The Bjerknes hypothesis in light of these recent studies is that ENSO evolves as a self-sustained coupled oscillation in which warm/cold anomalies of SST in the tropical Pacific cause the anomalous strengthening/weakening of the trade winds that, in turn, drive the ocean currents associated with the SST anomalies. The oceanic process provides a key to understand the observed 3-7 years periodicity of ENSO, which is rather slow as compared to the fast evolving atmospheric processes. Although the oceanic component of ENSO is a key element that determines the SO, influences from other climate variations outside of the Pacific cannot be neglected in this regard (Zhang et al. 1997). The motivation of the present short article is due to the fact that the Indian Ocean Dipole (IOD) discovered recently (Saji et al. 1999; Webster et al. 1999; Behera et al. 1999; Iizuka et al. 2000) has shed a new light on the role of the Indian Ocean in determining the sea level pressure oscillation over the Asia-Pacific sector. Since its existence has come to the light very recently, we provide here a brief description of the Indian Ocean phenomenon.
Saji et al. (1999) found that the coupled ocean-atmosphere phenomenon evolves with an east-west dipole in the SST anomaly and named it the Indian Ocean Dipole. The Dipole Mode Index (DMI) is thus defined as the SST anomaly difference between the eastern and the western tropical Indian Ocean (see insets in Fig. 3a for the regions used to compute the DMI). The changes in the SST during the IOD events are found to be associated with the changes in the surface wind of the central equatorial Indian Ocean. In fact, winds reverse direction from westerlies to easterlies during the peak phase of the positive IOD events when SST is cool in the east and warm in the west. The effect of the wind is even more significant at the thermocline depths through the oceanic adjustment process (Rao et al. 2001); the thermocline rises in the east and deepens in the central and western parts. Since the seasonal southeasterly winds along the Sumatra coast are also strengthened during the positive IOD events, the induced coastal upwelling causes strong SST cooling in the east (Behera et al. 1999).
These changes in surface winds and oceanic conditions are coupled with the changes in the atmospheric convection through either convergence or divergence of the moist air. The convection in the eastern Indian Ocean is suppressed during the positive IOD events, whereas the convection in the central and western Indian Ocean is enhanced. Behera et al. (1999) have shown that the coupling between the SST cooling and the suppressed convection in the eastern Indian Ocean gave rise to further easterly wind anomalies during the IOD event of 1994. Using a simple Matsuno-Gill type model, Saji and Yamagata (2001) have also shown that the atmospheric linear response to such changes in the heat source of the eastern Indian Ocean strengthens the easterly wind anomalies, which in turn are responsible for the evolution of the SST dipole. Ashok et al. (2001) have further confirmed this using a more sophisticated general circulation model.
It is clear from the above discussions that the positive IOD event produces anomalous atmospheric circulation wherein an anomalous downdraft (updraft) branch of the Walker Circulation is seen in the region that covers from the eastern tropical Indian Ocean to the western tropical Pacific (from the western tropical Indian Ocean to the east African region). Therefore, the air-sea coupled phenomenon in the tropical Indian Ocean may affect the atmospheric pressure fluctuation in the region around Indonesia-Australia. Here, we report the existence of such an interesting relation by analyzing the observed data.
2. Data
We use mean monthly data for the period from 1958 to 1998 in this study. Monthly anomalies of sea level pressure and surface wind fields are derived from the NCEP-NCAR reanalysis data (Kalnay et al. 1996). SST anomalies are computed from the GISST 2.3b dataset (Rayner et al. 1996). The low frequency variability comprising of the periodicity of above 7 years is removed from all the data sets using the Fourier transformation.
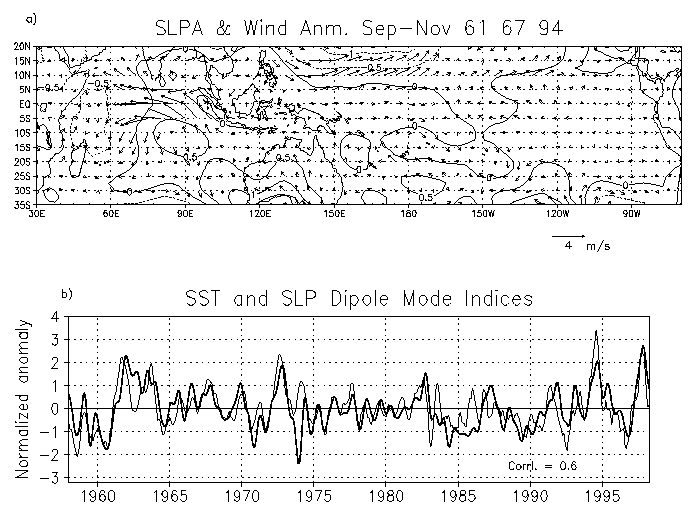
In order to show the surface conditions during the IOD events, we have plotted the composites of sea level pressure and wind anomalies in Fig. 1a. The figure clearly shows a dipole pattern of the sea level pressure anomalies in the tropical Indian Ocean. For comparison between this pressure dipole and the SST dipole as discussed in Saji et al. (1999), we have shown the time series of both the indices in Fig. 1b. The pressure index is obtained by taking the anomaly difference between the sea level pressure in the eastern (860E-870E, 100S-90S) and the western (440E-450E, 150S-140S) tropical Indian Ocean. As seen in the figure, time series of the pressure index corresponds well with that of the SST index and the correlation between the two indices is 0.6, when the latter leads the former by one month. As expected, the wind anomalies are consistent with the pressure anomalies in the composite plot (Fig. 1a). Although the surface pattern in the Indian Ocean looks similar during most of the major IOD events, here we have carefully chosen three strong positive IOD events in 1961, 1967 and 1994 to make the composite only when there was no El Niño in the Pacific Ocean. This is to avoid simple misinterpretation that the anomalies in the Indian Ocean are just the result of the El Niño. Therefore, no strong anomalies in sea level pressure and wind are seen in the eastern tropical Pacific Ocean (Fig. 1a).
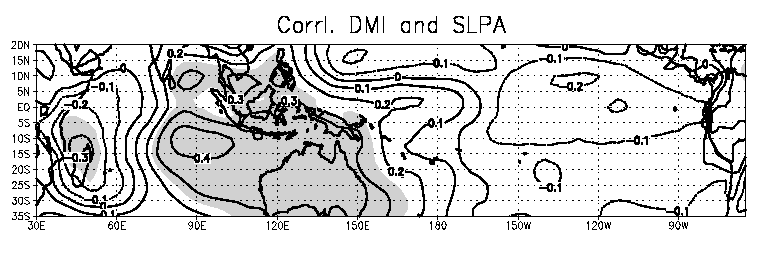
However, it is reasonable to expect possible influences of the IOD on the atmospheric conditions of the neighboring Darwin region that constitutes the western pole of the SO. A correlation analysis reveals such an inverse influence very clearly. As shown in Fig. 2, the DMI has a peak positive correlation of about 0.4 near the Indonesia-Australia region and a negative extreme of –0.3 near the Madagascar region. The positive correlation in the eastern Indian Ocean is stronger and the area is wider compared to that of the negative correlation in the western Indian Ocean. Thus, anomalous conditions associated with the IOD have greater impact on the eastern side as compared to the western side. Interestingly, the correlation coefficients in the central and eastern tropical Pacific are very small; this demonstrates that the relation between the IOD and the eastern center of SO is negligible.
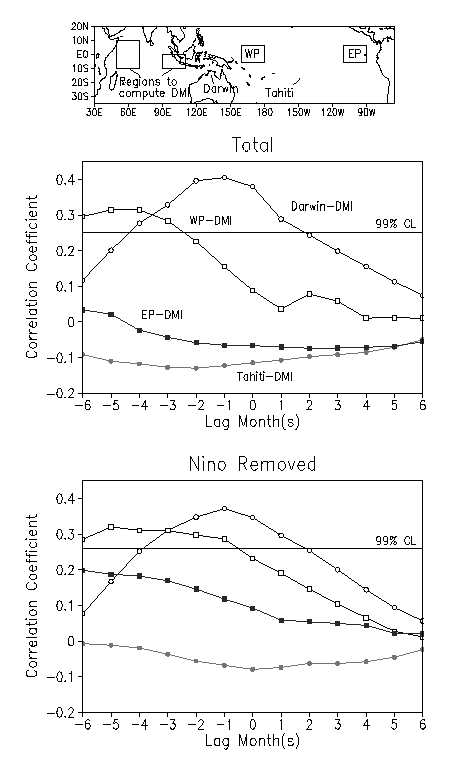
In Fig. 3, we show the lag correlation between the DMI and each of the pressure indices from the Pacific. In addition to the two well-known pressure indices of Darwin and Tahiti, we discuss two more pressure indices derived from sea level pressure anomalies in the central-west (1600E-1800E, 60S-60N) and eastern (1100W-900W, 60S-60N) Pacific Ocean (see Fig. 3a). The lag-correlation functions between the DMI and each of these indices are calculated by starting DMI time series 6 months prior and then sliding it up to 6 months after the start of the year. This is expected to provide the time evolution of the relationship between the IOD and the pressure fluctuation of the tropical Pacific Ocean. As seen in Fig. 3b, the DMI has a peak correlation of 0.4 with the Darwin pressure index when the former leads the latter by one month. When the Darwin index leads by 3 months, the correlation (0.2) drops below the significant level. Moreover, the pressure index of the central-west Pacific region shows a peak correlation of about 0.3 when DMI leads the central-west Pacific index by 4-5 months (Fig. 3b). This may explain the reason why some earlier studies found the progressive patterns from the Indian to the Pacific Ocean (e.g. Tomita and Yasunari 1996). In contrast, the correlation between the DMI and the pressure index of Tahiti/eastern Pacific is insignificant at all lead/lag period. Even if the analysis is repeated by removing the strong El Niño years from the time series of all the indices, we reach the same conclusion (Fig 3c). The above discussion demonstrates the independence of the IOD-Darwin relationship from the sea level pressure variabilities of the eastern Pacific.
4. Decadal change in the IOD influence on the Darwin pressure
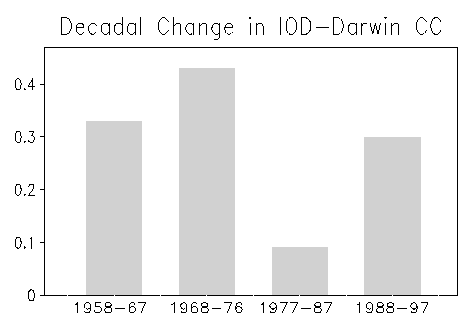
It is interesting to know whether such a relationship between the IOD and the pressure oscillation in the western Pacific undergoes decadal modulation. For this purpose, we compute the correlation coefficients between the DMI and the Darwin pressure index separately for each decade; the whole analysis period of 40 years is divided into 4 sub-periods viz.1958-67, 1968-76, 1977-1987 and 1988-97. Though we intend to keep an equal interval of 10 years for each of these 4 sub-periods, slightly different intervals are adapted for the two sub-periods of 1968-76 and 1977-87 to take into account any possible influence of the reported regime shift of 1976 (Nitta and Yamada, 1989; Trenberth, 1990). As shown in Fig. 4, the DMI correlates well with the Darwin pressure index for the three sub-periods of 1958-67, 1968-76 and 1988-97. This signifies the role of the Indian Ocean in the interdecadal pressure swings in the Asia-Pacific sector. However, the correlation reduces significantly during the decade of 1977-87. During this sub-period, we find three ENSO events but only one IOD event of 1982. Thus, it is natural to expect that such a situation lessened the IOD impact on the Darwin pressure. Similar decadal modulation of the IOD impact on the Indian monsoon rainfall has been recently discussed by Ashok et al. (2001).
The above analysis of the interdecadal modulation of the IOD-Darwin correlation is further supported by a longer time series of the historical data starting from the year 1880. The DMI correlation with the Darwin pressure anomaly, prior to 1958, remained above the statistical significance level during most of the period except for the period 1920-1950. During this weak correlation period we find only three IOD events. Interestingly, during the period when IOD-Darwin correlation is above the significant level, i.e. when the IOD occurrences are more frequent, the spectral peak in the DMI time series is about 2 years. This behavior of the IOD gives rise to the observed quasi-biennial tendency in the Indian Ocean region (e.g. Mheel 1987; Rao et al 2001).
It is shown that the SST variability in the Indian Ocean, associated with the IOD, influences the evolution of sea level pressure anomaly in the region that spans from the western tropical Indian Ocean to the western tropical Pacific region. During the positive IOD events, we observe positive (negative) sea level pressure anomalies in the Indonesia-Australia (western Indian Ocean) region. We also note that the spectral peak in the IOD index is at around 2 years whereas there is a broad 3-6 year period spectral peak in the ENSO indices. Thus, we expect that the inherent periodicity associated with the IOD events, which is different from that of the Pacific ENSO events, may provide co-variability between the IOD and the pressure fluctuation at Darwin, one pole for the Southern Oscillation. The correlation analysis in the present study clearly supports this hypothesis; the IOD index shows a good correlation with the sea level pressure anomaly at Darwin. It is important to note that the IOD does not show any significant correlation with the sea level pressure anomalies in the eastern Pacific. Thus we confirm that the pressure oscillation at Darwin, which is one of the two major contributors to the SO, is influenced by the IOD events that occur independently of the eastern Pacific pressure variability related to El Niño. The above novel relationship however, undergoes decadal modulation with a significant reduction of the IOD impact on the Darwin pressure for the recent decade of 1977 through 1987. Understanding the physical mechanism that determines such decadal modulations of the ocean-atmosphere coupled system in the Indo-Pacific sector is underway using sophisticated coupled ocean-atmosphere models.
The analysis here has brought out an interesting aspect of the climate variation in the tropical oceans. Although either of the independent modes of the Pacific and the Indian Oceans, i.e. the ENSO and the IOD, has a distinct air-sea coupled nature in the respective basin, two basins interact through atmospheric conditions. Therefore, it is interesting to construct first the real nature that is uniquely associated to the air-sea coupled phenomenon in each of the tropical oceans and then to clarify the interactions among these phenomena. This work is presently underway.
Acknowledgments. Discussions with Drs G. Meyers, Y. Masumoto, A. S. Rao, N. H. Saji, K. Ashok and Z. Guan were helpful to prepare the manuscript.
References
Ashok, K., Z. Guan, and T. Yamagata, 2001: Impact of the Indian Ocean Dipole on the Decadal relationship between the Indian monsoon rainfall and ENSO, Geophy. Res. Letter (submitted)
Behera, S. K., R. Krishnan, and T. Yamagata, 1999: Unusual ocean-atmosphere conditions in the tropical Indian Ocean during 1994. Geophy. Res. Letter, 26, 3001-3004.
Bjerknes, J., 1969. Atmospheric teleconnections from the equatorial Pacific. Mon. Wea. Rev., 97, 163-172.
Iizuka, S., T. Matsuura, and T. Yamagata, 2000, The Indian Ocean SST dipole simulated in a coupled general circulation model. Geophy. Res. Letter, 27, 3369-3372 .
Kalnay, E et al. 1996: The NCEP/NCAR 40 year reanalysis project. Bull. Amer. Meteor. Soc., 77, 437-471.
Meehl, G. A., 1987: The annual cycle and the interannual variability in the Tropical Pacific and Indian Ocean regions. Mon. Wea. Rev., 115, 27-50.
Neelin, J. D., D. S. Battisti, A. C. Hirst, F.-F. Jin, Y. Wakata, and T. Yamagata, S. Zebiak, 1998: ENSO Theory. JGR Oceans, 103, 14,261-14,290.
Nitta, T. and S. Yamada, 1989: Recent warming of tropical sea surface temperature and its relationship to the Northern Hemisphere circulation. Journal of Meteo. Soc. of Japan, 67, 375-383.
Philander, S. G. H., 1990: El Niño, La Niña and the Southern Oscillation, Academic Press, San Diego, Calif., 293 pp.
Rayner, N.A., E.B. Horton, D.E. Parker, C.K. Folland, and R.B. Hackett, 1996, Clim. Res. Tech. Note 74, UK Meteorological office, Bracknell.
Rao, A.S. S.K. Behera, Y. Masumoto and T. Yamagata, 2001: Interannual variability in the subsurface Tropical Indian Ocean, Deep Sea Research (in press).
Saji, N. H., B. N. Goswami, P. N. Vinayachandran, and T. Yamagata, 1999: A dipole mode in the tropical Indian Ocean. Nature, 401, 360-363.
Saji N. H., and T. Yamagata, 2001: A view of the tropical Indian Ocean climate system from the vantage point of Dipole Mode events. J. Climate (submitted).
Tomita, T., and T. Yasunari 1996: Role of the northeast winter monsoon on the biennial oscillation of the ENSO/Monsoon system. Jr. Meteo. Soc. Japan, 74, 399-413.
Trenberth, K. E., 1990: Recent observed interdecadal climate changes in the Northern Hemisphere. Bull. Amer. Meteor. Soc., 71, 988-993.
Walker, G.T. 1924. Correlations in seasonal variations of weather. IX. Mem. India Meteorological Department.
Wallace, J. M., E. M. Rasmusson, T. P. Mitchell, V. E. Kousky, E. S. Sarachik, and H. von Storch, 1998: On the structure and evolution of ENSO-related climate variability in the tropical Pacific: Lessons from TOGA. J. Geoph. Res., 103, 14,241-14,259.
Webster P. J., A.M. Moore, J.P. Loschnigg, and R.R. Leben, 1999: The great Indian Ocean warming of 1997-98: Evidence of coupled oceanic-atmospheric instabilities. Nature, 401,356-360 .
Zhang, Y., J. M. Wallace, and D. S. Battisti, 1997: ENSO-like interdecadal variability: 1900-93, J. Climate, 1, 609-625.

Fig. 1. a) Composites of the anomalies of sea level pressure and surface wind for the northern fall (September-November) of years 1961, 1967 and 1994. b) The normalized dipole mode indices for the anomalies of sea level pressure (thick line) and SST (thin line). The time series are normalized by the respective standard deviation values.

Fig. 2. Correlation coefficients between the time series of the DMI and the global sea level pressure anomalies. Values exceeding 99% confidence limit using a 2-tailed t-test are shaded.

Fig. 3 a). Regions used to compute the DMI and the pressure indices; Darwin, Tahiti, central-west Pacific (WP) and the eastern Pacific (EP). b) Cross-correlation functions between the DMI and each of the pressure indices of Darwin (circle), Tahiti (solid circle), central-west Pacific (square) and eastern Pacific (solid square). The x-axis shows the lag in months, where negative values indicate the DMI leading the other time series. c) Same as b) but for the correlation excluding major El Niño years.

Fig.4. Correlation coefficients between DMI and Darwin pressure index, separately computed for the sub-periods of 1958-67, 1968-76, 1977-87 and 1988-97. In all cases, DMI leads Darwin index by one month as the peak correlation between them is achieved at this lag.