April 24, 2008
Japan Agency for Marine-Earth Science and Technology
Projection of Future Ozone Concentration
Using Air Pollution Emission Scenario in Asia
Abstract
Research Scientist Kazuyo Yamaji and Program Director Hajime Akimoto of Atmospheric Composition Research Program, Frontier Research Center for Global Change (FRCGC), the Japan Agency for Marine-Earth Science and Technology (JAMSTEC: Yasuhiro Kato, President) have conducted future projection of Ozone(*1) contamination in East Asia by using the model taking into account Chinas economic development, in cooperation with Toshimasa Ohara, Section Head of National Institute for Environmental Studies and Itsushi Uno, Professor of the Kyushu University. Ozone concentration(*3) in the North China Plain (NCP; refer to Fig.1) in year 2020 projected by "Policy Failure Case ( PFC)(*2) scenario" shows approximately 18ppb increase at three summer month average (June-August), which affects and causes increase of ozone concentration in Central Japan (CJP; refer to Fig.1) by approximately 6ppb at three summer month average, despite of projection of decreasing NOx emission in Japan.
This result will be published in upcoming issue of US geological journal "Journal of Geophysical Research".
Background
Last year, photochemical oxidant warning was issued in Niigata Prefecture and Oita Prefecture at the first time, and other areas tend to receive more warning than ever. Transboundary air pollution including ozone from China and other Asian countries is being concerned and discussed. But until now, future projection of ozone concentration that taking into account of Chinas increasing NOx emission has not yet been conducted.
Details
In this study, future ozone concentration in East Asia is projected by using the regional chemical-transport model (RAMS/CMAQ)(*5)based on Regional Emission Inventory in Asia (REAS)(*4) developed by our study group. Among these, as for China, three emission scenarios were developed which are Policy Failure Case (PFC), Reference Case (REF) and Policy Succeed Case (PSC) (*2). The base year was set to 2000 and computation was conducted up to 2020.
As a result, in PSC scenario, ozone concentration in Central Japan (CJP in Fig.1) of three summer month average (June-August) increases by approximately 6ppb, even though it is projected that NOx emission in Japan itself would decrease. And ozone concentration of three summer month average in NCP increases by approximately 18ppb.
These results indicate that taking measures to decrease NOx emission in future China is extremely important for Chinas environmental conservation as well as Japans photochemical pollution control.
This study has been conducted as part of projects under Global Environment Research Fund titled "Spatial and Temporal Variability and Climate Impact of Ozone and Black Carbon in Asia" (Hajime Akimoto, Principal Investigator).
Detailed Description
(1) Conditions for computation
- 1.
- Model domains (Fig.1)
Outer Domain (RAMS domain)(*5):Meteorological field with spatial resolution of 80km×80km
Inner Domain (CMAQ domain)(*5):Chemical transport calculation field with spatial resolution of 80km×80km - 2.
-
Conditions to define the outer area borderline:
Utilize computational result of the global model (CHASER) - 3.
- Emission source data in Asia used for regional model computation:
0.5×0.5 mesh with REAS(*4)
(2) Future projection of NOx emission
- 1.
- Only REF scenario was used to estimate NOx emission in Asian countries other than China.
- 2.
- For China, three scenarios were used which are Policy Failure Case (PFC), Reference Case (REF) and Policy Succeed Case (PSC)(Fig.2).
However, in 2005, satellite observation data have already shown much higher emissions than the estimated value in PFC scenario. It is because of Chinas rapid economic growth. If the emissions continue to increase at this pace, the value in 2020 would be a lot more than estimated value in PFC scenario. That means that 2020 value in PFC scenario is the value to be attained through huge efforts. Considering these circumstances, we decided to adopt PFC scenario for computation in this report.
(3) Future projection result of ozone concentration
- 1.
- Average in June (upper figures of Fig.3)
The left figure of Fig.3 shows distribution forecast of ozone concentration near the earths surface in East Asia if NOx, VOC and CO emissions in China will follow PFC scenario (base year is 2000). The right figure of Fig.3 shows increase of ozone concentration in 2020 compared to 2000. It is monthly average of ozone concentration in June when the ozone concentration is the highest during the year in the North China Plain. It reaches 85~105ppb which is 18~24ppb higher than 2000 value. In mainland and south side Japan, it reaches 65-75ppb which is 8-14ppb higher than 2000 value. - 2.
- Average of a year (bottom figures of Fig.3)
Increase of ozone concentration is largest (12-14ppb) at the area from south part of North China Plain to south part of Yangtze River in annual average. In the southern part of Japan, it is 4~8ppb. - 3.
- Summer time average (June-August)
Ozone concentration in Central Japan increases by approximately 6ppb in three summer month average even though NOx emission in Japan is estimated to decrease. Ozone concentration in the North China Plain increases by approximately 18ppb.
Glossary
- *1:
- Ozone is the major component of photochemical oxidant (generic term for oxidizing agents produced through photochemical reaction of air pollutants, which includes ozone, hydrogen peroxide and organic peroxide). Ozone has beneficial aspect to absorb ultraviolet radiation in the stratosphere but it is harmful to humans due to its high reactivity. It may cause a respiratory problem such as asthma by inhaling.
- *2:
- Policy Failure Case is the scenario that fuel consumption and environmental measures remain the same so that emissions would increase the most. Reference Case is the scenario that appropriate measures are taken for energy and environment. Policy Succeed Case is the scenario with the least emission by taking strict measures for energy and environment.
- *3:
- Annual average of photochemical oxidant in daytime at continuous measurement stations in Japan is 25-30ppb. (all day annual average in Japan is about 25ppb)
- *4:
- Emission inventory is the list of emission sources and amount data. REAS stands for Regional Emission Inventory in Asia developed by JAMSTEC and National Institute for Environmental Studies and etc., which is emission data set of air pollutants from anthropogenic sources at the earths surface.
- *5:
- The model that can compute transport and chemical reactions of air pollutants in a limited domain such as Asian domain or Japan domain. CMAQ used in this study had been developed by US Environmental Protection Agency (USEPA), and computed with horizontal scale 80km. RAMS is the meteorological field model which is used with CMAQ, etc..
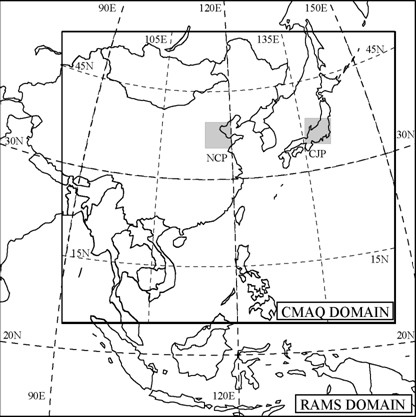
Fig.1: Model Domains
RAMS DOMAIN (outer domain) is meteorological field with spatial resolution of 80km×80km. CMAQ DOMAIN (inner domain) is chemical transport calculation field with spatial resolution of 80km×80km. CJP and NCP indicate Central Japan and North China Plain respectively.
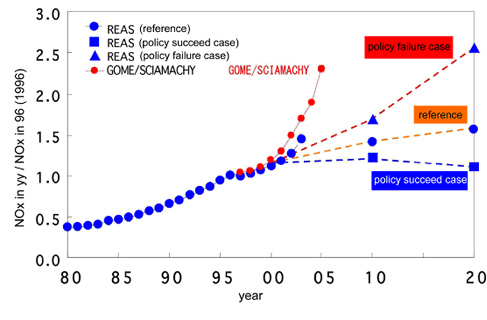
Fig.2: Future NOx emission in China projected in three scenarios. As for past emissions, it shows comparison of satellite data and REAS.
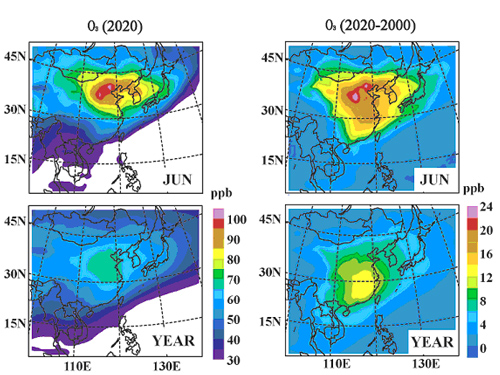
Fig.3: Left: Distribution of ozone concentration near the earths surface in East Asia in 2020 in case China follows PFC scenario (base year : 2000).
Right: Difference of ozone concentration in 2000 and 2020.
Upper figures are monthly average in June, and lower figures are annual average.
Contacts:
- (For research contents)
- Hajime Akimoto, Program Director
Kazuyo Yamaji, Researcher
Atmospheric Composition Research Program
Frontier Research Center for Global Change (FRCGC)
Hidetoshi Nakamura, e-mail: frcgc@jamstec.go.jp
Manager, Research Promotion Office, FRCGC
- (For Publication)
- Noriyuki Murata, e-mail: press@jamstec.go.jp
Manager, Planning Department Press Office
Japan Agency for Marine-Earth Science and Technology