April 2, 2009
Japan Agency for Marine-Earth Science and Technology
Reduced Arctic Sea Ice Hinders Accurate Climate Monitoring
- Impact of Depleted Arctic Drifting Buoy Network -
1.Abstract
A group of researchers from the Japan Agency for Marine-Earth Science and Technology (JAMSTEC: Yasuhiro Kato, President) found that observations from drifting buoys, deployed under the International Arctic Buoy Program (*1), play a vital role in maintaining the accuracy of atmospheric circulation analysis over the Arctic Ocean. The group, led by Jun Inoue of the Climate Dynamics Research Team at the Research Institute for Global Change, and Takeshi Enomoto of the Earth Simulator Center, revealed that a decrease in the number of Arctic drifting buoys (*2), associated with recent abrupt decreases in sea ice, affected the accuracy of atmospheric reanalysis products (*3); for a decrease of 10 buoys, the analysis ensemble spread (a measure of error information) increased by approximately 1 hPa locally in the short-run time scale, and by 0.1 hPa over a large area in the long-run time scale.
No other previous study has reported the impact of reduction of Arctic buoys on atmospheric reanalysis datasets; thus the findings of this study provide quantitative evidence of the need for sustainable international efforts to maintain and expand the network of in-situ meteorological observations in the Arctic Ocean.
The study was part of a joint research conducted by the Japan Meteorological Agency (JMA), JAMSTEC and the Doshisha University, and will be published in the Journal Geophysical Research Letters of the American Geophysical Union. It will also be reported at the spring meeting of the Oceanographic Society of Japan from April 5 to 9, 2009 at the University of Tokyo.
| Title: | Impact of observations from Arctic drifting buoys on the reanalysis of surface fields |
| Authors: | Jun Inoue, Takeshi Enomoto, Takemasa Miyoshi, and Shozo Yamane |
2.Background
The Arctic Ocean is among the most vulnerable regions to the effects of global warming; the observations on the Arctic climate system, therefore, provide profound implications for global warming programs as well as the validation of climate projections. The Arctic climate also affects the climate in Japan, as shown in a recent study reporting that when Arctic sea ice recedes anomalously during summer and autumn, the subsequent winter tends to get colder than average in East Asia and Japan.
In the Arctic Ocean, there is no land mass; therefore, it is impossible to conduct surface and upper-air observations at fixed stations on land. Instead, Arctic drifting buoys, which are deployed over the sea ice and drift with it, are being used to measure meteorological information such as surface pressure and air temperature.
JAMSTEC has also deployed buoys almost every year, contributing to establishing the international network of Arctic buoys. The IABP data has been serving to maintain the accuracy of atmospheric reanalysis datasets, which are processed to be homogeneous in time and space and used for numerical weather prediction and climate studies.
Yet, the recent rapid decrease in thick sea ice has limited opportunities for buoy deployments. An area in which buoy deployment is impossible, due to a large expanse of open water area during summer, will not provide data either in summer or in the subsequent winter, leaving large areas without data. This has raised concerns over the deterioration of the accuracy of reanalysis data, highlighting the need for evaluating the impact of buoy observations on the data and for the future management of the buoy network.
3.Methods
An experimental ensemble reanalysis (ALERA)(*6) dataset was produced using the AFES-LETKF data assimilation system that is composed of the Atmospheric General Circulation Model for the Earth Simulator (AFES)(*4) and the Local Ensemble Transform Kalman Filter (LETKF)(*5). At every analysis time, 40 realizations of atmospheric state are generated with this data assimilation system to enable to provide statistical error information.
In general, some error is inherent in the estimated state of the atmosphere; however, the conventional data sets do not include the error information, since it is difficult to estimate it by existing methods. Meanwhile, the AFES-LETKF assimilation system can quantitatively provide atmospheric uncertainty estimated from 40-member analysis. It has also been confirmed that the quality of ALERA was comparable to conventional reanalysis (Miyoshi et al, 2007). With the capability to estimate analysis error, AFES-LETKF data assimilation system can have a greater potential for use in designing optimum observing systems. In this study, the researchers used this assimilation system to access the impact of Arctic buoys on the analysis accuracy, so that the results can assist in the future planning of observation projects.
The assimilated observations were obtained from the operational numerical weather prediction system of the Japan Meteorological Agency (JMA). These data incorporate data from the Arctic buoys. For comparison, the analysis using the same datasets, except without surface pressure observations north of 70 degrees N, was also performed, in order to assess the response of atmospheric circulation to the withholding of buoy data.
4.Results
The impact of the Arctic buoy data on the ALERA was accessed by comparing the dataset with buoy data (CTL) and the dataset without them (ARC). The CTL results showed that the accuracy of surface-level pressure (SLP) simulations was higher on the Pacific Ocean side of the Arctic Ocean, where relatively numerous drifting buoys were in service, but it was lower in the eastern Arctic encompassing Russian coasts, where few buoys were being operated (Fig.1-a). The ARC results showed the absence of buoy data affected the SLP accuracy, not only in the area with buoys, but also in other areas without the buoy installation, magnifying analysis uncertainty across the entire Arctic Ocean (Fig.1-b). This suggests that the buoy data are effective in enhancing the accuracy of atmospheric circulation analysis over the entire Arctic Ocean.
Arctic drifting buoys are deployed from spring to summer and their numbers peak in the summer melting season. In August 2006 when many drifting buoys were deployed, the SLP accuracy was improved by approximately 1 hPa (Fig.2). Without the buoy data, the spatial patterns of high and low pressure systems tend to be smoothed. The smoother SLP field affects air temperature and winds over the ice surface, which may cause considerable errors in the estimate of heat budget and the drift of sea ice. The analysis accuracy was also found to influence geopotential height fields and temperature in the lower troposphere (Fig.3).
The IABP has been in operation since 1979, providing the Arctic buoy data. Using the IABP buoys and conventional reanalysis datasets produced by the United States, Europe and Japan, the relationship between cross-ensemble spreads among the reanalyses and the number of buoys was assessed. Although the number of buoys reporting onto the Global Telecommunication System (GTS) varies by season and year (Fig.4-b), the area with a high buoy concentration showed a significant correlation with the magnitude of accuracy (the greater the number of buoys, the higher the accuracy is), especially in the Western Arctic Ocean (along Alaska, Canada and Greenland), where buoy observations have been frequently conducted (Fig.4-a). This also suggests that a decrease in the number of buoys, due to sea-ice decline, could deteriorate the accuracy of future analyses. Although buoy numbers increased after 2007, partly because of the International Polar Year, the Arctic sea-ice extent is still far below the long-time average, reducing the operational area for the buoy network and thus hampering its efforts to efficiently improve accuracy of analyses over the Arctic region.
5.Discussion
In order to accurately validate the global warming predictions, it is vital to conduct more accurate and reliable climate monitoring in the Arctic Ocean, along with accumulation of such observational data. For the area with low analysis accuracy, which was identified in this study, observations by drifting buoys should be intensively introduced, to alleviate uncertainty in the future projections. Upon the results from this study, JAMSTEC has deployed two drifting buoys called the Polar Ocean Profiling System (POPS)(*7) in 2008 on the sea ice near Russian waters (Fig.5).
In addition, in response to the increasing area of open water in summer, it is necessary to develop a drifting buoy system that is durable to the lateral pressure of ice formation in winter and that floats during the summer melting season. To deploy buoys with adequate spatial density, the locations of buoys should be effectively determined. As shown in this study, the simulation using the Earth Simulator can lend itself suitable for such a purpose, and is expected to be used in programs for further developing the international Arctic buoy network. Furthermore, upper-air sounding data obtained during the Arctic expeditions aboard JAMSTECs research vessel MIRAI will also be utilized to investigate the buoys impact on the meteorological predictability in the Arctic and surrounding high latitude regions.
*1. IABP (International Arctic Buoy Programme):
The International Arctic Buoy Programme (IABP) has maintained a network of drifting buoys on the Arctic Ocean to provide meteorological and oceanographic data for weather forecasts and research purposes. Although each research center is responsible for the locations of their buoys and the distribution of observational data, the IABP collects information on future buoy locations and types, and coordinates the efforts for buoy deployment among research centers. The IABP also provides support to the World Climate Research Programme(WCRP) and the World Weather Watch (WWW)Programme.
*2 .Arctic drifting buoy:
Ice-drifting buoys are installed in sea ice. They come in several types for different use, such as oceanographic, ice and meteorological observations. The Installation of buoys varies as well; some large buoys involve transport by an icebreaker or an aircraft, and require on-site assembly, while others can be parachuted from an airplane onto the sea ice. All buoys are equipped with a transmitter to communicate to satellites. JAMSTECs POPS is an ice buoy, designed to measure both oceanographic and meteorological information, and requires on-site assembly on the ice (see reference. 7).
*3. Atmospheric reanalysis data:
Atmospheric objective analysis is the optimal estimate of atmosphere, including wind, temperature and vapor distribution. They are produced by combining observational data and model predictions. These estimates are used as initial values in numerical weather prediction every day. Though useful as initial values, the operational analyses are not suited for climate monitoring, because updates to the prediction system will cause the inconsistency in product quality. For climate monitoring, therefore, a number of long-term reanalysis datasets on the past observational data are produced consistently with a modern forecast system.
*4. AFES (Atmospheric General Circulation Model for the Earth Simulator):
Atmospheric General Circulation Model (AGCM) for the Earth Simulator is a program that calculates time evolution of the atmospheric state such as temperature and winds, using the governing equations of fluid dynamics and thermodynamics. The AFES, which has been developed and optimized by the Earth Simulator Center in cooperation with the Research Institute of Global Change, is based on an AGCM jointly developed by the Center for Climate System Research of the University of Tokyo and the National Institute for Environmental Studies. The AFES was rewritten to afford maximal computational performance on the Earth Simulator. The AFES won the 2002 Gordon Bell Award for Peak Performance.
*5. LETKF (Local Ensemble Transform Kalman Filter):
The LETKF is one of the data assimilation algorithms, which estimates optimal ensemble analysis using the probability density distribution of ensemble forecasts. It is suited for parallel calculation and allows efficient analysis. The LETKF is based on an algorithm developed by the University of Maryland, and was developed by the Japan Meteorological Agency using the Earth Simulator.
*6. ALERA (AFES-LETKF experimental ensemble reanalysis) :
The ALERA is a data set produced by the AFES-LETKF, a data assimilation system combining the AFES with the LETKF. With an input of 40-member forecasts using the AFES (80-km horizontal resolution and 48 vertical levels) and global atmospheric observational data into the LETKF, JASMTEC produced data sets for about twenty months from May 2005 to mid-January 2006. Theses data are available for research purposes from the Earth simulation Center. http://www.jamstec.go.jp/esc/afes/alera.
*7. POPS (Polar Ocean Profiling System):
The POPS is an ice-drifting buoy system, with an Argo-float type profiler attached to a cable, and can be deployed in multiyear ice in the Arctic. The Argo-float profiler is lowered from an ice platform on the sea surface, and measures water temperature and salinity at depths of between 10 and 1,000 meters. The data is transferred to the platform and transmitted to Iridium satellites. Along with time series of vertical changes in water temperature and salinity, meteorological data on air temperature and barometric pressure are also measured at the platform.
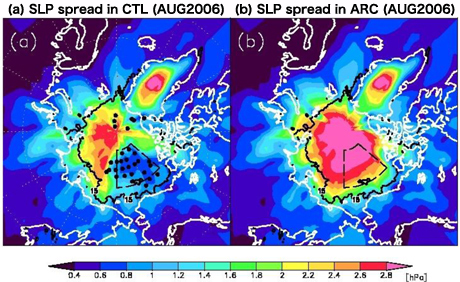
Figure 1: Accuracy in surface-level pressure (SLP) estimates in August 2006. The accuracy was evaluated as spread, a reference for error information; the larger the number, the higher the accuracy is. (a): with buoy data (CTL: control). (b): without buoy data (ARC: sensitivity test). Black dots depict the positions of the buoys. In CTL, the area with buoys shows high accuracy. Without buoys, the simulation accuracy drops across the Arctic Ocean. The SLP spread is extremely small over land, due to a dense network of surface meteorological stations
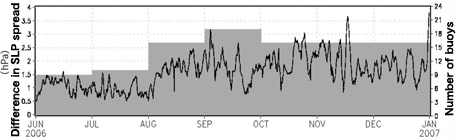
Figure 2: Time series of the difference in SLP spread between CTL and ARC (black line), and the monthly number of buoys in service (shading). The higher value on the black line indicates larger difference in spread. The values shown in the chart were obtained by deducting the spread of CTL from that ARC, for the area enclosed by dashed lines in Figure 1. An increase in the number of buoys improves the accuracy of estimates.
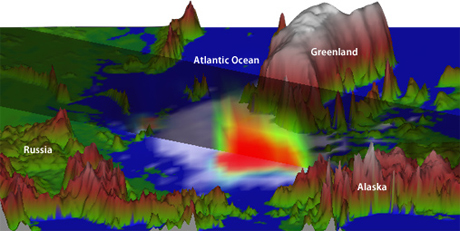
Figure 3: Three-dimensional visualization of the difference in ensemble spread of the sea-level pressure and in the geopotential height field. In the diagram, the warmer the color, the lower the accuracy of estimates, due to removal of observations. Sea-level pressure observations affect the estimates of geopotential height fields and temperature in the lower troposphere. Sea ice is drawn in white.
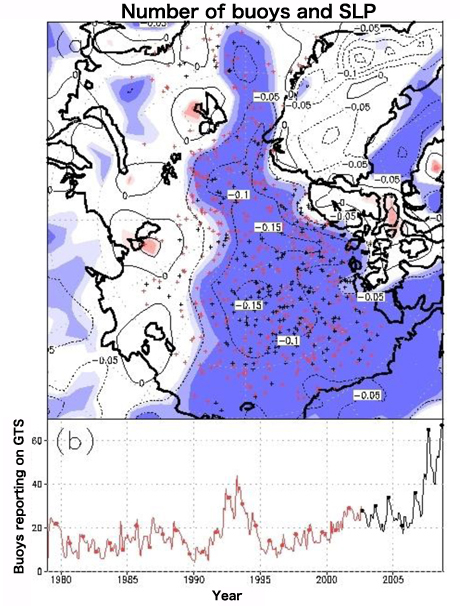
Figure 4: (a): Regressions of cross-ensemble spread derived from common atmospheric analyses: NCEP1 and NCEP2 (U.S.), ERA-40(Europe), and JRA-25(Japan). Standard deviations of the monthly mean SLP were plotted on the map. In the blue area, there is a significant correlation between the number of buoys and the magnitude of accuracy. An increase in the number of buoys improves the accuracy of datasets. The area in thick blue has a greater correlation. September buoy positions before and after 2002 are also shown in red and black dots (red: from 1979 to 2001, black: from 2002 to 2008). The correlation is the highest in the waters along Alaskan and Canadian coasts, where the buoys are densely placed, whilst no correlation was found on the Russian side of the Arctic Ocean, where few buoy programs have been launched. (b) Time series of the number of IABP buoys reporting onto GTS. The red line shows changes in the number of buoys before August 2002. The numbers increased rapidly after 2007, but their distribution is spatially biased (see Fig.4-a).
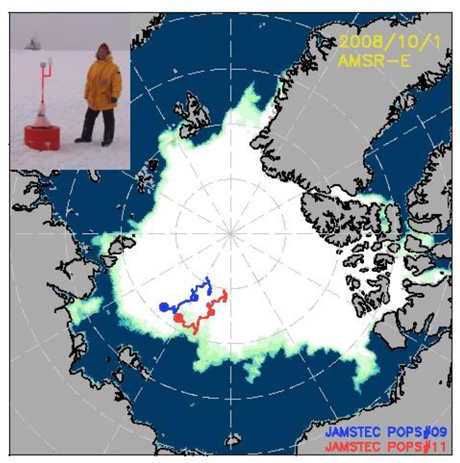
Figure 5: Trajectories of POPS buoys, with large dots (blue and red) marking their initial installation points. The sea ice concentration on October 1, 2008 is also shown above. Two buoys were deployed in September 29 and October 1, 2008 in the area of few buoy distribution, after examining results in Figure 1-a.
Contacts:
- (About this study)
-
Jun Inoue
Northern Hemisphere Cryosphere Program
Climate Dynamics Research Team
Institute of Observational Research for Global Change
Japan Agency for Marine-Earth Science and Technology
-
Takeshi Enomoto
Geophysical Fluid Simulation Research Group
Earth simulator Center (ESC)
Japan Agency for Marine-Earth Science and Technology
- (For Publication)
-
Noriyuki Murata, e-mail: press@jamstec.go.jp
Manager, Planning Department Press Office
Japan Agency for Marine-Earth Science and Technology