Press Releases
JAMSTEC
Atmosphere and Ocean Research Institute,
The University of Tokyo
Variability in the number of intense tropical cyclones during extreme El Niño events
- The importance of predicting internal atmospheric variability in seasonal tropical cyclone forecasts -
1. Key points
- ◆
- Numerical simulations of a 50-member ensemble were performed at a seasonal scale and in high resolution to identify the causes underlying the frequent occurrence of intense tropical cyclones in the western North Pacific during extreme El Niño years (1997 and 2015).
- ◆
- The results showed that the occurrence of an extreme El Niño did not necessarily indicate that intense tropical cyclones would frequently occur, and that the frequency of intense tropical cyclones varied due to internal atmospheric variability, such as a monsoon trough, even with the same distribution of sea surface temperatures.
- ◆
- An understanding of the causal mechanism of internal atmospheric variability and an improvement in its predictability are crucial for predicting intense tropical cyclones at a seasonal scale.
2. Overview
A joint research team led by Yohei Yamada of the Japan Agency for Marine-Earth Science and Technology (JAMSTEC) used a nonhydrostatic icosahedral atmospheric model (NICAM*1) to perform a large-ensemble simulation*2 for the boreal summer seasons of 1997 and 2015, in which extreme El Niño events were observed. The model explicitly calculated the formation and disappearance of clouds without using convective scheme which is used in conventional general circulation models. For the summers of 1997 and 2015, extreme El Niño phenomena occurred and a large number of intense tropical cyclones*3 were observed.
In this study, it was found that an extreme El Niño did not necessarily lead to the occurrence of many intense tropical cyclones in the western North Pacific. In addition to extreme El Niño phenomena, factors like internal atmospheric variability*4, including a monsoon trough*5, also have an impact. Tropical cyclone activities*6 have interannual variability*7 owing to variations in sea surface temperatures, such as El Niño*8 (Figure 1).
Seasonal prediction of El Nino has continued to improve in recent years. This may also promise the feasibility of seasonal prediction of tropical cyclones. While tropical cyclone activities are believed to be affected by both internal atmospheric variability and variations in sea surface temperatures, the assessment of their impacts have been insufficient.
Large-ensemble simulations using NICAM showed that, in spite of the use of the same sea surface temperature distribution, the number of intense tropical cyclones varied among ensemble members to a degree that rivaled interannual variability (Figure 2). These result indicate that the amplitude of internal atmospheric variability is significant, and that the seasonal prediction of tropical cyclones through sea surface temperatures alone is quite difficult. However, the relationship between the expression of a monsoon trough among members and the number of intense tropical cyclones was also compared, and it was found that an intense monsoon trough contributed to an increase in the number of intense tropical cyclones (Figure 3). The findings from this study are therefore important, as they highlight the need for a deeper understanding of internal atmospheric variability, especially of a monsoon trough, with respect to the development of seasonal predictions of tropical cyclone activities.
This study was partially supported by FLAGSHIP2020 project of the Ministry of Education, Culture, Sports, Science, and Technology (hp160230, hp170234, and hp180182).
The above results were published in Geophysical Research Letters on July 3, 2019 (JST).
- Japan Agency for Marine-Earth Science and Technology
- Atmosphere and Ocean Research Institute, The University of Tokyo
- Meteorological Research Institute, Japan Meteorological Agency
- *1
- NICAM:
a high-resolution atmospheric general circulation model with highly-accurate computational abilities that are achieved through the explicit calculation of the formation and behavior of clouds across the globe. Conventional general circulation models require assumptions of the relationship between large-scale atmospheric circulation and cloud systems, which is a major factor causing uncertainty.
- *2
- Ensemble simulation:
involves a large number of numerical simulations, in which initial conditions vary slightly from one another. In this study, a simulation with a large number of ensembles (members) was termed a “large-ensemble” simulation.
- *3
- Intense tropical cyclone:
The intensity (strength) of a tropical cyclone is defined by the maximum wind speed and minimum central sea level pressure; this definition varies among studies. In this study, tropical cyclones whose minimum central sea level pressure reached 945 hPa or below were defined as “intense tropical cyclones.”
- *4
- Internal atmospheric variability:
variability on a monthly scale caused spontaneously by atmospheric influences alone and independently of impacts from the ocean, snow, and ice. One example of the manifestation of internal atmospheric variability is a change in the direction of westerly winds due to low-atmospheric pressure activities.
- *5
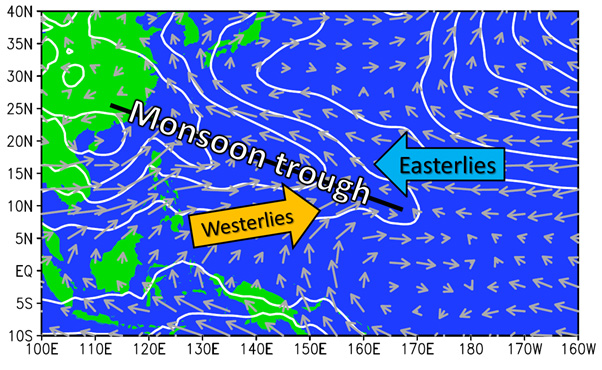
- Monsoon trough:
tropical convergence zone in the western North Pacific region that is accompanied by the shearing of westerly winds at the equator and easterly winds in the subtropics. The monsoon trough shifts seasonally and its intensity varies.
Supplementary figure: Schematic of the monsoon trough in the western North Pacific region. Westerly and easterly winds blow into the trough (convergence zone) of atmospheric pressure. White lines show isobars and grey arrows show the magnitudes and directions of winds at an altitude of 850-hPa.
- *6
- Tropical cyclone activities:
This term involves the number of tropical cyclones that occur as well as their intensities, the number of intense tropical cyclones, the geographical locations at which these cyclones are generated, and the paths that they take. The focus of this study was determining the number of intense tropical cyclones.
- *7
- Interannual variability:
This term refers to the variability of the phenomena observed every year, such as the number of tropical cyclones (Figure 1).
- *8
- El Niño:
a phenomenon in which sea surface temperatures from the International Date Line to the South American coast along the equator of the Pacific Ocean are warmer than usual for more than a year.
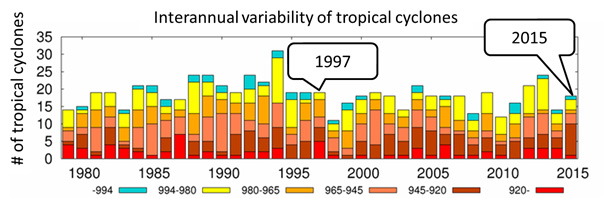
Figure 1. Interannual variability of tropical cyclones which is categorized based on the minimum sea level pressure during the lifecycle of each tropical cyclone. Each color represents tropical cyclones whose atmospheric pressures were: at least 994 hPa (light blue), 994–980 hPa (yellow), 980–965 hPa (orange), 965–945 hPa (deep orange), and 945–920 hPa (brown); red denotes tropical cyclones with pressures that fell below 920 hPa. The figure was developed using the best track data (BTD) of the JMA.
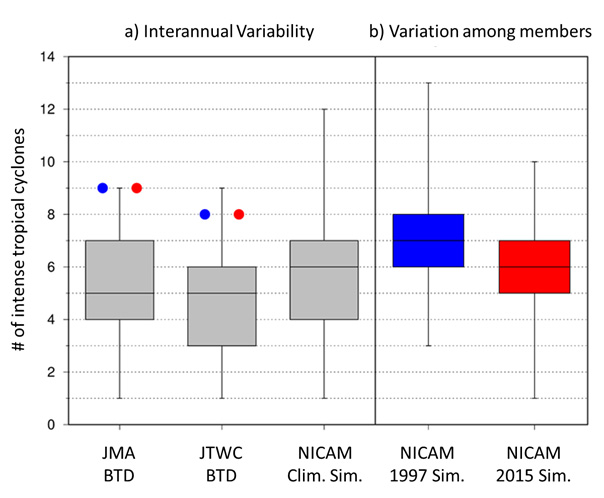
Figure 2. Box plot of (a) the interannual variability in the number of intense tropical cyclones and (b) the variation among ensemble members from June to October (i.e., the summer season). The interannual variability from 1979 to 2008 was developed based on the BTD of the JMA and of the Joint Typhoon Warning Center (JTWC), and shows the results of a long-term experiment using NICAM from the same period. The blue and red dots denote the number of intense tropical cyclonces from the BTD of the JMA and JTWC between 1997 and 2015, respectively.
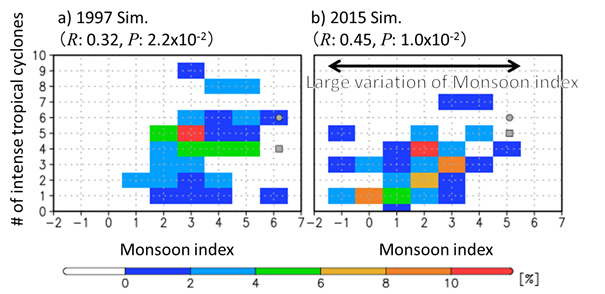
Figure 3. Joint probabilistic density function of the relationship between the number of intense tropical cyclones among ensemble members (from June to August) and the intensity of the monsoon in (a) 1997 and (b) 2015. A monsoon index was used to represent the intensity of monsoons, which was defined by the difference between zonal wind speeds in the western North Pacific at ~10° parallel north and ~25° parallel north. The period from June to August is when particularly large numbers of intense tropical cyclones were observed in the simulations; warmer colors represent higher probabilistic density function.
Contacts
- (For this study)
- Yohei Yamada, Postdoctoral Researcher, Cloud-Resolving Model Development and Application Group, Research Institute for Global Change, Research Center for Environmental Modeling and Application
- Masaki Satoh, Professor, Atmosphere and Ocean Research Institute, The University of Tokyo
- (For press release)
- Public Relations Section, Marine Science and Technology Strategy Department, JAMSTEC
- Yoko Ogawa, Public Relations, Atmosphere and Ocean Research Institute, The University of Tokyo