Press Releases
JAMSTEC
HOKKAIDO UNIVERSITY
Frequent Marine Heatwave off the Coast of Hokkaido and Tohoku:
The Relationship between Marine Heatwave and Yellowtail Catch
1. Key points
- ◆
- From 2010 to 2016, rising sea surface temperature named marine heatwave occurred every summer off the coast of Hokkaido and Tohoku.
- ◆
- The series of marine heatwaves occurred due to warm eddy broken off from the Kuroshio Current blocking the southward movement of the Oyashio Current.
- ◆
- The marine heatwave and the rapid increase in yellowtail catch off the Pacific coast of Hokkaido were statistically related.
2. Overview
A joint research team of Senior Researcher Dr. Toru Miyama, Application Laboratory (APL), Research Institute for Value-Added-Information Generation (VAiG), JAMSTEC, and Professor Shoshiro Minobe, Hokkaido University, found that the increase in seawater temperature, named the marine heatwave, occurred every summer from 2010 to 2016 in the Oyashio region off the coast of Hokkaido and Tohoku.
Marine heatwave is an oceanic event in which the temperature of sea surface increases sharply over several days or years. The frequency of this event has increased significantly over the last 100 years, affecting marine ecosystems. Sea surface temperatures surrounding Japan have also risen due to the global warming. This study analyzed the environmental change in the Oyashio region from the perspective of rapid temperature changes.
The result showed that marine heatwaves occurred every summer off the coasts of Hokkaido and Tohoku from 2010 to 2016 (Figs. 1 and 3). We also observed increase in seawater temperatures at the depth of more than 200 m (Fig. 4). The increase in seawater temperature was due to warm eddies broken off from the Kuroshio Current blocking the southward movement of the cold Oyashio Current along the coast (Fig. 5). Since 2010, the quantity of yellowtail catch off the Pacific coast of Hokkaido has increased rapidly. The increase in water temperature and the change in yellowtail catch were found to be statistically related (Fig. 2).
This study was funded by JSPS Grant-in-Aid for Scientific Research JP19H05697. The article was published on Frontiers in Marine Science on January 14th (JST).
- JAMSTEC
- HOKKAIDO UNIVERSITY
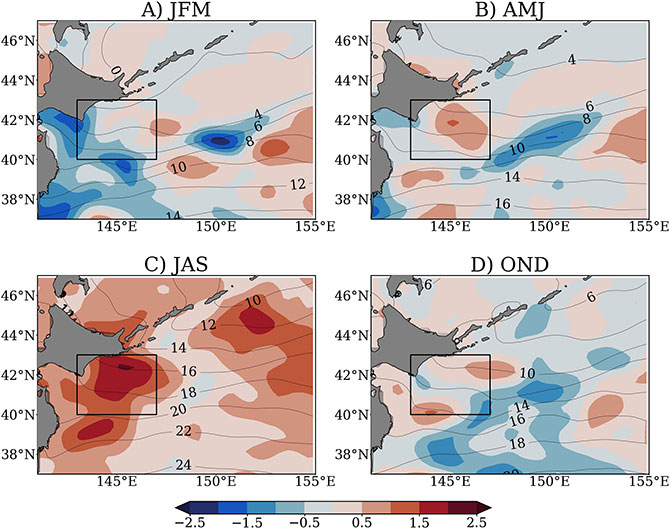
Fig. 1: Average sea surface temperatures in the period 2010–2016 for each season (isoline: ℃), and the differences from those in the period 1993–2009 (colors: ℃). (A) January to March, (B) April to June, (C) July to September, (D) October to December.
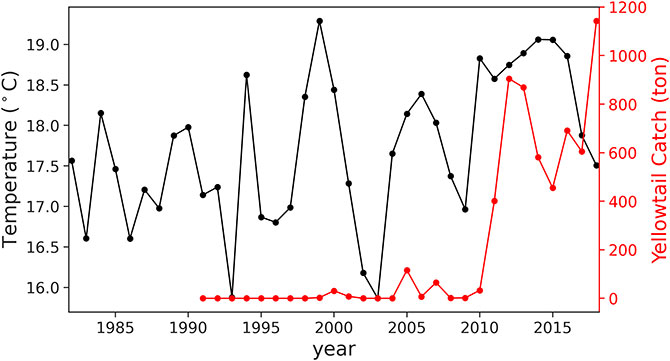
Fig. 2: Time-series of average sea surface temperatures in summer (an average from July to September) in the black gridlines in Fig. 1 (the black line; ℃ on the left vertical axis), and the time-series of yellowtail catch in southeastern Hokkaido (Hidaka, Tokachi, and Kushiro regions) (the red line; tons on the right vertical axis). The data on catch was retrieved from "Current status of Hokkaido fisheries" (http://www.pref.hokkaido.lg.jp/sr/sum/03kanrig/sui-toukei/suitoukei.htm).
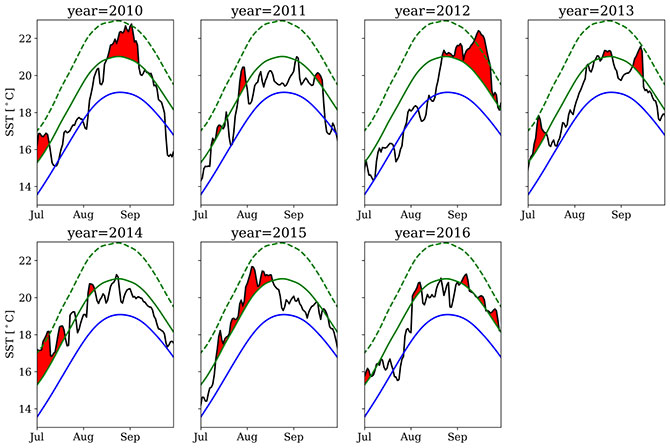
Fig. 3: The blue line for each year is the seasonal water temperature change in normal years, and the black line is the actual temperature. The water temperatures above the green lines are high water temperatures that occurred less than 10% statistically in the past. The areas filled in red are the periods in which such high temperatures lasted for more than 5 days, meeting the definition of a marine heatwave. The green dashed lines indicate twice the difference between the blue lines and green lines.
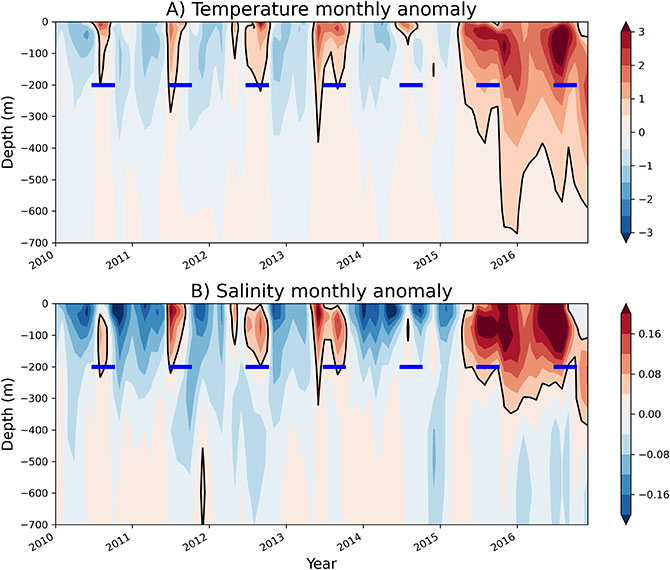
Fig. 4: The differences of (A) water temperatures and (B) salinity in 2010–2016 from those in 1993–2009 in the black gridlines in Fig. 1. The horizontal axis indicates time, and the vertical axis indicates depth. The blue lines show the depth of 200 m in summer (July to September).
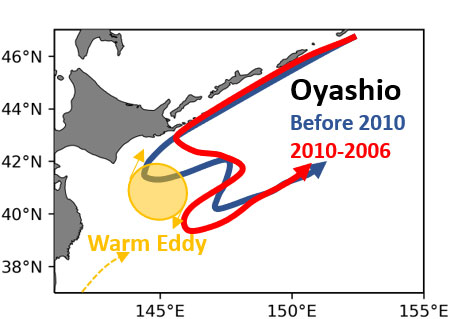
Fig. 5: Conceptual diagram. The blue line is the Oyashio Current in 1993–2009, and the red line is the Oyashio Current in 2010–2016. Because warm core rings from the Kuroshio Current came closer, the Oyashio Current was blocked from moving down south along the coast after 2010.
Contacts
- (For this study)
- Toru Miyama, Research Institute for Value-Added-Information Generation (VAiG), Application Laboratory (APL), Environmental Variability Prediction and Application Research Group, JAMSTEC
- (For press release)
- Public Relations Section, Marine Science and Technology Strategy Department, JAMSTEC