Press Releases
JAMSTEC
Accurate Prediction of Summertime Sea Ice in the Antarctic Ocean from Previous Winter Conditions
―Winter Sea Ice Thickness is Key to the Prediction―
1. Key points
- ◆
- A sea ice prediction system has been successfully developed on the Earth Simulator based on sea ice concentration and sea ice thickness reanalysis products (※1).
- ◆
- Summertime sea ice concentration in the Weddell Sea (east of the Antarctic Peninsula) can be predicted from winter season data with high accuracy.
- ◆
- The methodology in this study is applicable to the Arctic sea ice prediction research.
2. Abstract
Dr. Yushi Morioka (Application Laboratory, VAiG, JAMSTEC) and his research team, including collaborators from the Euro-Mediterranean Center on Climate Change (CMCC), successfully developed a sea ice prediction system on the Earth Simulator. The prediction system more accurately predicted summertime sea ice concentration (SIC) in the Weddell Sea of the Antarctic Ocean from previous winter conditions using SIC and sea ice thickness (SIT) reanalysis products (※1).
Most research institutes have conducted the Antarctic sea ice predictions by assimilating the climate model’s SIC to the observed SIC, but the accuracy based on this methodology remains poor with a short prediction lead time of less than one season.
Dr. Morioka, together with the research team, initialized both the SIC and SIT in their climate model called SINTEX-F2 (※2) and conducted the Antarctic sea ice prediction on the Earth Simulator. The SIC and SIT for the initialization were derived from the ocean/sea ice reanalysis produced at CMCC.
The results suggest that accurate sea ice prediction requires both the SIC and SIT data and hence more accurate SIT observations are needed. It is further anticipated that these research results would be applicable to sea ice prediction research in the Arctic Ocean.
This paper will be published in Scientific Reports on June 9 (6 PM, JST), 2021, and this research was partially supported by the national research fund of JSPS Kakenhi (19K14800JP).
3. Introduction
Many researchers have been studying physical processes underlying sea ice variability and predictability due to the contrast between decreasing Arctic sea ice and increasing Antarctic sea ice. The Weddell Sea, located east of the Antarctic Peninsula, is one of the key regions for active formation of the Antarctic Bottom Water that potentially affects the global climate through the thermohaline circulation (※3).
Although the sea ice extent in the Weddell Sea has not shown an increasing trend since the 1980s (when the satellite observation data became available), the sea ice cover experiences distinct seasonal and year-to-year variations. The research team has recently reported that sea ice variability during October-December can be accurately predicted from September data by initializing the climate model’s sea ice concentration (SIC) with the observed SIC (Feb 25, 2019).
However, their methodology showed very limited ability, with only a few months of prediction lead time. Therefore, further improvement was necessary in the prediction strategy to extend the lead time beyond one season. The team thought that one plausible way would be to initialize the sea ice thickness (SIT) in addition to the SIC in the climate model. Since thicker sea ice generally tends to last longer, there seemed a high possibility of extending the prediction lead time to more than one season using the SIT initialization.
Therefore, this study attempted to initialize the SIT of a climate model using an ocean/sea ice reanalysis product and investigate whether the prediction accuracy for summertime sea ice, which is most difficult to predict, could be improved.
4. Results
Figure 1 shows January-March mean sea ice concentration (SIC) and sea ice thickness (SIT) during 1986-2017. The Weddell Sea shows the largest SIC in the Antarctic Ocean. The SIT in the Weddell Sea is very large, ranging from a few tens of cm to around one m. Since the high SIT is observed in the Weddell Sea during austral summer, it is anticipated that the summertime sea ice in the Weddell Sea is more predictable than that in the other basins of the Antarctic Ocean.
To explore the impact of SIT initialization on the sea ice prediction, two hindcast (i.e., retrospective) experiments during 1986-2017 were conducted using the SINTEX-F2 model on the Earth Simulator. In the first experiment, only the model’s SIC was initialized with the one from the reanalysis product, while in the second experiment, both the model’s SIC and SIT were initialized.
Figure 2 shows the accuracy of the January-March mean SIC anomalies prediction from July 1st. Here, the prediction accuracy is evaluated using the correlation coefficients between the observed and predicted SIC. In the first experiment with only the SIC initialization (Fig. 2a), the prediction accuracy is high only in the northern Weddell Sea, whereas the second experiment (Fig. 2b) shows higher accuracy in the southern Weddell Sea as well. The improvement in sea ice prediction is also evident from the difference in prediction accuracy between the second and the first experiments (Fig. 2c).
To investigate the physical processes underlying this improvement of sea ice prediction, the research team selected low sea ice years in the Weddell Sea (1999, 2000, 2002, 2006, 2007, 2009, 2011, and 2017). Figure 3 shows actual and predicted January-March mean SIC anomalies during these low sea ice years. Observation data (Fig. 3a) shows low levels of SIC anomalies in the northern Weddell Sea. The first experiment with only the SIC initialization (Fig. 3b) does not capture the SIC anomaly levels well, while the second experiment with both the SIC and the SIT initializations (Fig. 3c) better describes the spatial pattern as well as the amplitude of the SIC anomalies. The prediction improvement can also be seen in the difference between the second and first experiments (Fig. 3d).
Figure 4a shows the temporal evolution of monthly SIC and SIT anomalies predicted from July 1st in the two experiments. The SIC anomalies (black lines) in the two experiments are similar from July to October, but they largely differ from November to February. The SIT anomalies (red lines) show some differences from July to October, which become larger from November to February, indicating the impact of the SIT initialization on the predicted SIT anomalies
To explore these mechanisms in greater detail, the SIT tendency anomalies were decomposed into zonal and meridional sea ice advection and vertical sea ice processes. Figure 4b shows that the total tendency of the SIT anomalies becomes negative from July to August due to contributions from both zonal and meridional sea ice advection. The SIT tendency anomalies become negative again after October when the vertical processes start to dominate. After October, the sea ice receives increased solar radiation due to a decrease in the albedo (figure not shown). The mixed layer becomes warmer than normal as a result of increased incoming solar radiation, which contributes to the SIT decrease from the bottom of the sea ice. This so-called ice-albedo feedback (※4) process effectively contributes to a remarkable sea ice decrease after October.
5. Future Perspectives
This study highlights the importance of sea ice thickness (SIT) initialization for summertime sea ice prediction in the Antarctic Ocean from winter conditions. The initialized SIT anomalies in winter persist through horizontal advection processes until early spring, and the SIT anomalies further develop through ice-albedo feedback processes from late spring to summer.
However, the sea ice thickness observation in the Antarctic Ocean is spatio-temporally limited for the purpose of performing sea ice prediction using climate models. In addition to the in-situ observation of sea ice thickness using research vessels, satellite observation data of sea ice thickness has become available in recent years. Since large differences exist in the sea ice thickness based on satellite observations, more accurate observations of sea ice thickness are indispensable.
This study has focused on summertime sea ice prediction, but wintertime sea ice prediction is also important for regional communities. The hindcast experiment with the summertime SIC and SIT shows almost no difference in prediction accuracy of wintertime SIC compared to the experiment with the SIC initialization only. Since subsurface ocean states (temperature and salinity) have a significant influences on the sea ice extent during winter, further improvement of climate models using subsurface ocean initialization is required and is currently underway.
The methodology used in this study is also applicable to sea ice prediction in the Arctic Ocean. In particular, summertime sea ice prediction is necessary for assessment of the commercial shipping route in the Arctic Ocean. In this fiscal year, JAMSTEC has initiated construction of an Arctic research vessel (Movie); therefore, a larger number of observations and simulation studies in the Arctic Ocean are anticipated. Comparing model simulations with this observational data will help to better understand physical processes underlying sea ice variability and hence pave the way to improving the model predictions in the polar regions.
【Supplementary Information】
- ※1
- Reanalysis product:
Reconstructed dataset using both the observations and the model simulation. We used the C-GLORSv7 reanalysis product, produced at CMCC, which reasonably captures the past SIC and SIT variations in the Antarctic Ocean.
- ※2
- SINTEX-F2:
Ocean and atmosphere coupled general circulation model developed on the Earth Simulator under the international research collaboration between European research agencies and JAMSTEC. The model is written with a series of numerical program codes that describe physical and dynamical processes of the ocean and climate systems. The SINTEX-F2 model is mainly used for physical process and prediction studies on climate variability.
- ※3
- Thermohaline circulation:
Global ocean circulation that takes a few thousand years to travel over the world and plays a key role in transporting heat and nutrients in the ocean. One of the sources for the thermohaline circulation lies in the Weddell Sea where cold water with high salinity, called the Antarctic Bottom Water, forms and spreads into the other ocean basins.
- ※4
- Ice-albedo feedback:
Once sea ice starts to retreat, its contribution to the reflection of solar radiation decreases such that sea ice receives increased solar insolation, thereby accelerating sea ice melting. This feedback loop is called positive ice-albedo feedback.
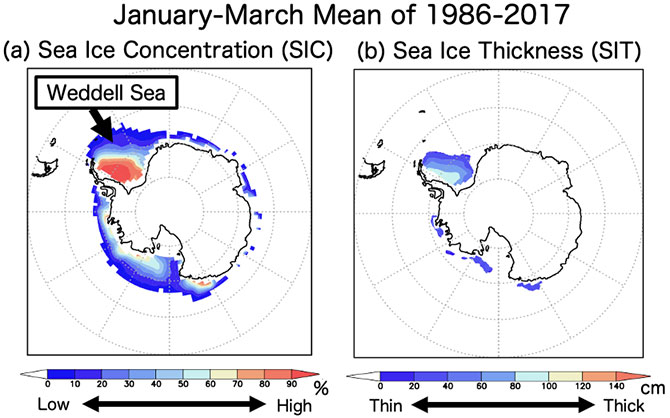
Figure 1: (a) January-March mean sea ice concentration (SIC, in %) observed during 1986-2017. (b) Same as in (a), but for sea ice thickness (SIT, in cm) obtained from the ocean/sea ice reanalysis product (C-GLORSv7).
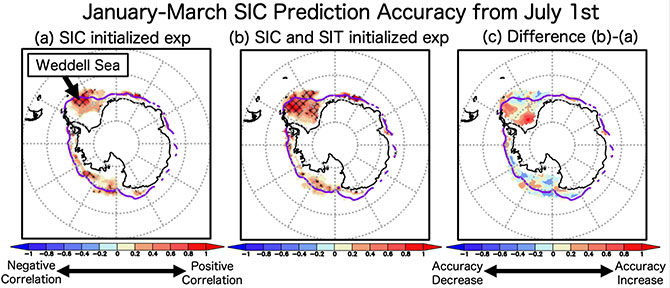
Figure 2: (a) January-March SIC prediction accuracy from July 1st in the SIC initialized experiment. Prediction accuracy is evaluated using the correlation coefficients between the observed and predicted SIC anomalies. Hatches indicate statistically significant correlation coefficients. The purple line corresponds to the northern edge of sea ice defined as 15% of SIC. (b) Same as in (a), but for the SIC and SIT initialized experiments. (c) Difference in the SIC prediction accuracy between the two experiments (i.e., (b)-(a)).
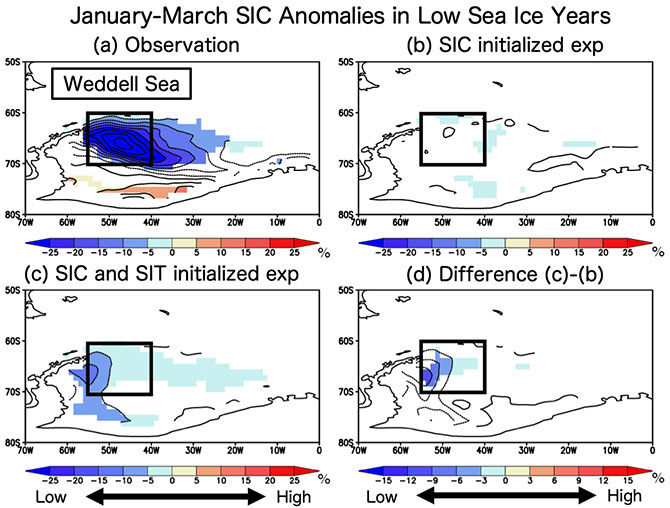
Figure 3: (a) Actual January-March SIC anomalies (in %) during low sea ice years in the Weddell Sea (1999, 2000, 2002, 2006, 2007, 2009, 2011, and 2017). The black box indicates a region of interest (55ºW-40ºW, 70ºS-60ºS). (b) Same as in (a), but for predicted January-March SIC anomalies (in %) in the SIC initialized experiment. (c) Same as in (b), but in the SIC and SIT initialized experiment. (d) Difference between the two experiments (i.e., (c)-(b)).
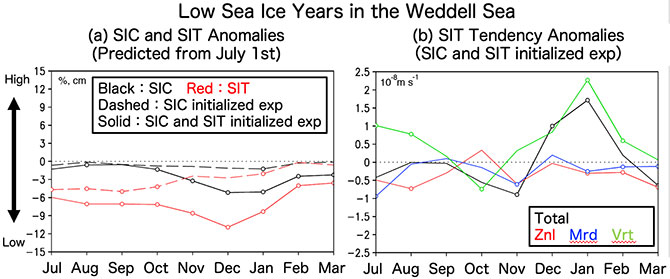
Figure 4: (a) SIC (in %) and SIT (in cm) anomalies predicted from July 1st of low sea ice years in the Weddell Sea region of interest (see the black box in Fig. 3). Black lines show SIC anomalies, while red lines show SIT anomalies. Dashed lines correspond to the results in the SIC initialized experiment, while solid lines correspond to those in the SIC and SIT initialized experiment. Open circles indicate statistically significant anomalies. (b) SIT tendency anomalies (in 10-8 m s-1) predicted from July 1st of low sea ice years in the Weddell Sea region of interest (see the black box in Fig. 3) for the SIC and SIT initialized experiment. The black, red, blue, and green lines show the total tendency anomalies, zonal (Znl) sea ice advection effect, meridional (Mrd) sea ice advection effect, and the effect of vertical (Vrt) sea ice processes, respectively.
Contacts
- (For this study)
- Yushi Morioka, Scientist, Research Institute for Value-Added-Information Generation (VAiG), Application Laboratory (APL), Climate Variability Prediction and Application Research Group, JAMSTEC
- (For press release)
- Public Relations Section, Marine Science and Technology Strategy Department, JAMSTEC