Press Releases
JAMSTEC
Kyushu University
Understanding the reasons for the extraordinary equatorial Atlantic warming in late 2019
1. Key Points
- ◆
- One of the strongest equatorial Atlantic warm events of the last 40 years developed in late 2019.
- ◆
- Wind stress forcing both on and off the equator contributed to the exceptionally strong warming.
- ◆
- Analysis suggests that remote forcing from other basins was not a major factor in the genesis of the event.
- ◆
- The results point to a possible discrepancy between projected and observed trends of equatorial Atlantic climate variability.
2. Abstract
Dr. Ingo Richter (Application Laboratory, VAiG, JAMSTEC) and his collaborators Prof. Hiroki Tokinaga (Kyushu University) and Dr. Yuko Okumura (University of Texas at Austin) have examined year-to-year temperature variations in the equatorial Atlantic Ocean over the last several decades. They found that late 2019 was marked by exceptionally strong warming in the eastern equatorial Atlantic. While this region is subject to significant temperature fluctuations at 2-4 years intervals, the 2019 warm event was remarkable because 1) it occurred during winter, whereas most strong events occur during summer, 2) it was the strongest event of the last 40 years, and 3) it put an end to 20 years of comparatively low activity. The analysis by Dr. Richter and his coauthors suggests that surface wind forcing on and to the north of the equator was important but that additional processes likely played a role. Continued monitoring of the equatorial Atlantic will be necessary to evaluate whether or not equatorial Atlantic variability will remain strong. This will have important implications for the ability of climate models to predict variability trends.
This paper has been published in Geophysical Research Letters on February 22, 2022. The research was partially supported by the national research fund of JSPS Kakenhi (grants JP18H01281, JP18H03726, and JP19H05704).
- Application Laboratory, VAiG, JAMSTEC
- Research Institute for Applied Mechanics, Kyushu University
- Institute for Geophysics, Jackson School of Geosciences, University of Texas at Austin
3. Introduction
The eastern equatorial Atlantic is subject to year-to-year fluctuations in sea-surface temperatures. Events with warmer than normal temperatures are called Atlantic Niños (Fig. 1a) due to their apparent similarity with the well-known El Niño phenomenon in the equatorial Pacific. While Atlantic Niños are weaker and shorter-lived than their big brother in the Pacific, they have been found to have important impacts on rainfall patterns over Africa and South America. In addition, recent studies suggest that Atlantic Niños can lead to changes in the large-scale circulation that may even affect El Niño.
From about 2000 onward, year-to-year variability in the equatorial Atlantic has been relatively inactive (Fig. 2). Interestingly, this is consistent with the global warming projections of climate models, which project a weakening of Atlantic Niños under increasing greenhouse gas concentrations. In late 2019, however, an Atlantic Niño developed that was probably the strongest in the satellite observation period (Figs. 1b and 2), and was followed by another one of comparable strength in the summer of 2021. This raises important questions about whether equatorial Atlantic variability might defy global warming projections and return to a state of higher activity.
As a first step toward understanding the recent resurgence in equatorial Atlantic variability, Dr. Richter and his collaborators examined in detail the reasons for the exceptionally strong warming in late 2019 using in-situ and satellite observations, as well as observation-based reconstructions (so-called reanalyses *1) of the atmosphere and ocean.
4. Results
Analysis of the 2019 Atlantic Niño indicates that the weakening of equatorial surface winds (*2) strongly contributed to the warming (Fig. 3). This is in line with the generally accepted generation mechanism of such events. Comparison with past events, however, indicates that the wind changes were not exceptionally strong while the SST changes were. This suggests that other processes must have contributed to the exceptional warming in 2019. Several possibilities are explored in the study.
Analysis of the wider tropical Atlantic region suggests that unusual surface wind patterns just north of the equator during the summer of 2019 excited oceanic waves that traveled toward the eastern equatorial Atlantic and amplified the warming (Fig. 4).
In addition, there can be influences from remote ocean basins. 2019 featured an ongoing El Niño event in the central Pacific (a so-called El Niño Modoki), and late 2019 saw the development of one of the strongest positive Indian Ocean Dipole events on record. It has therefore been speculated that the 2019 Atlantic Niño was partially forced from the tropical Pacific and Indian Oceans. If such a remote influence exists, it must travel as an atmospheric wave in the upper troposphere (~ 10 km above the Earth’s surface). This can be checked by looking at satellite observations of cloud thickness variations or by examining wind fields in atmospheric reanalyses. Analysis of both data sets suggests that there was no strong wave signal from either the Pacific or the Indian Ocean. Therefore, it seems that forcing from remote ocean basins was not a major factor for the Atlantic warming in 2019.
5. Outlook
It is important to know whether the current resurgence in equatorial Atlantic variability was just a chance occurrence or the beginning of a trend reversal. The latter is supported by the fact that another strong warming event occurred in the summer of 2021 (Fig. 2).
The equatorial Atlantic region is subject to long-term modulation by naturally occurring variability patterns such as the Atlantic Multidecadal Oscillation (AMO). The current state of the AMO favors weak variability in the equatorial Atlantic but some recent observations suggest that the AMO may be in the process of changing its sign. In that case, the current resurgence of variability could be seen as part of this long-term modulation by natural occurring variability. The latest projections from global climate models, on the other hand, suggest that continued global warming will lead to a decline in the year-to-year variability of the equatorial Atlantic. Therefore, the current resurgence also raises the question whether climate models are projecting the wrong trend in the region. It will therefore be of crucial importance to continue in-situ and satellite monitoring of the region.
While two processes have been identified that contributed to the 2019 equatorial Atlantic warm event, its record-breaking strength has still not been fully accounted for. The co-occurrence of an extreme Indian Ocean Dipole event is suggestive of a contribution from remote basins. Detailed analysis, however, did not confirm this view. This does not rule out that a third process influenced both events. This could be, for example, unusual atmospheric variability patterns originating in the extratropics. More work will be needed to fully account for the strength of the 2019 equatorial Atlantic warm event. This should also contribute to improving seasonal forecasts of such events and their impacts on rainfall in the region.
- *1
- Reanalysis:
Observational records often have gaps but in many cases it is important to have a dataset that covers the whole globe and does not have missing time steps. Reanalyses address this problem by constraining a climate model simulation with observations from many sources, including in-situ observations, radiosondes, and satellites.
- *2
- Equatorial surface winds:
The surface winds blow from east to west in the tropics (a phenomenon known as the trade winds), including in the equatorial Atlantic. In the developing phase of Atlantic Niños, the east-to-west winds on the equator weaken, which leads to changes in the ocean vertical structure and, eventually, SST warming. This is indicated by the west-to-east component of the surface winds in Fig. 1, which shows the difference to normal conditions.
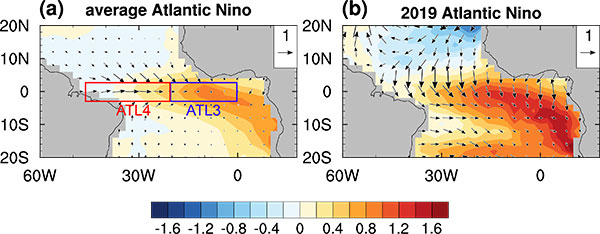
Figure 1. The two panels show anomalies (i.e. the difference from the climatology) of sea-surface temperatures (SST; shading; units are degree Celsius) and surface winds (vectors; reference vector in the upper right denotes 1 m/s) for (a) an average Atlantic Niño (i.e. the average over the Atlantic Niños in 1984, 1988, 1991, 1995, 1996, 1999, 2007 and 2008) for the season May-June-July, and (b) the 2019 Atlantic Niño averaged over the months November 2019 through January 2020. All data are from the ECMWF Reanalysis (ERA-5).
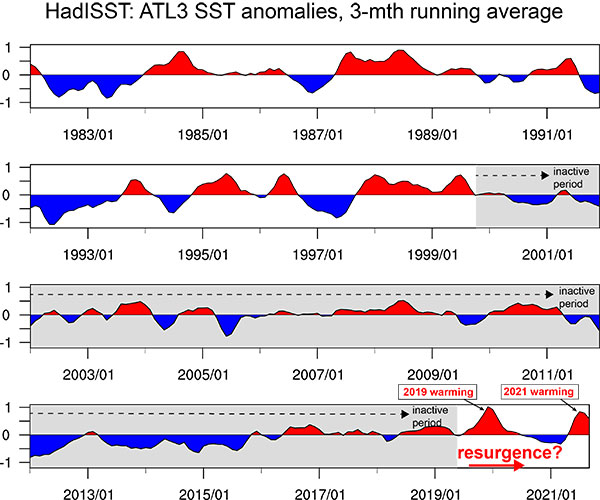
Figure 2. SST anomalies in the eastern equatorial Atlantic (units: degree Celsius) averaged over the ATL3 area (20°W-0, 3°S-3°N; see blue box in Fig. 1a). The data is from the UK Met Office Hadley Center data set (HadISST). The global warming trend has been removed and a 3-month running average has been applied.
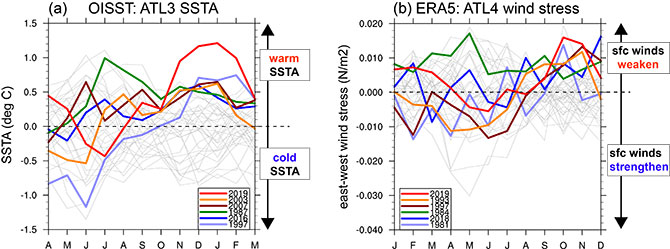
Figure 3. (a) ATL3 SST anomalies from satellite observations (OISST dataset) for all years from 1982-2019, plotted as 12-month segments starting from April of each year. The seasonal average over November-December-January is calculated for each 12-month segment and the six warmest years are colored, as noted in the legend. (b) Similar to (a), but for the ERA-5 surface east-west wind stress averaged over the ATL4 region (45-20W, 3S-3N; red box in Fig. 1a). The 12-month segments start from January, and the six years with the strongest eastward anomalies are selected based on the September-October-November average. Note that positive anomalies mean a weakening of the the equatorial trade winds, which usually blow from east to west.
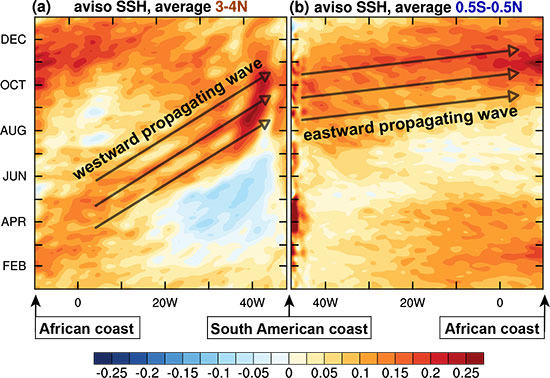
Figure 4. Longitude-time section of daily mean sea surface height anomalies (m) from AVISO, averaged between (a) 3°N and 4°N, and (b) 0.5°S and 0.5°N. The arrows indicate the propagation of large-scale westward propagating waves (Rossby waves) in (a) and large-scale eastward propagating waves (Kelvin waves) in (b). Note that the x-axis in (a) has been reversed to help visualize wave reflection at the western boundary.
Contacts
- (For this study)
- Ingo Richter, Senior Researcher, Research Institute for Value-Added-Information Generation (VAiG), Application Laboratory (APL), Climate Variability Prediction and Application Research Group, JAMSTEC
- Hiroki Tokinaga (Professor)
Research Institute for Applied Mechanics (RIAM)
Kyushu University - (For press release)
- Press Office, Marine Science and Technology Strategy Department, JAMSTEC