Press Releases
JAMSTEC
THE UNIVERSITY OF TOKYO
Global changes in the ocean carbon and oxygen cycles caused by anthropogenic nutrient inputs to the ocean
1. Key Points
- ◆
- Nutrient inputs from the atmosphere and rivers to the ocean are substantially increased by human activities.
- ◆
- Model simulations show that anthropogenic nutrient inputs to the ocean are already affecting global ocean biogeochemistry and the effects are equivalent in magnitude to the effects of climate change.
- ◆
- Anthropogenic nutrient inputs increase oceanic primary production and carbon uptake, offsetting climate-induced decrease, and accelerate climate-driven deoxygenation.
- ◆
- Considering the effects of both nutrient inputs and climate change is crucial in assessing impacts of human activities on ocean biogeochemistry.
2. Overview
Dr. Akitomo Yamamoto (currently Project Researcher at Atmosphere and Ocean Research Institute, The University of Tokyo), Dr. Michio Kawamiya (Director) at Research Center for Environmental Modeling and Application, JAMSTEC), and their colleagues report that nutrient inputs, such as nitrogen and iron, to the ocean from human activities affects the global oceanic primary production (※1), carbon uptake, and deoxygenation (※2). The magnitude of these effects is comparable to those of climate change. These findings were based on historical simulations from an Earth system model (※3) which contributed to the Intergovernmental Panel on Climate Change Sixth Assessment Report (IPCC AR6 ※4).
Because of human activities, such as fossil fuel combustion, land-use change, and fertilizer application, current fluxes of nitrogen and iron from atmosphere and rivers to the ocean are estimated to be more than double than those during preindustrial levels. Although global ocean biogeochemistry is known to be affected by human activities, previous related studies focused primarily on the changes induced by climate change (Fig. 1). However, the global impact of anthropogenic nutrient inputs on ocean biogeochemical cycles has not been fully understood. In this study, using an Earth System model, historical simulations for the period 1850–2014 and sensitivity simulations were conducted to evaluate the effects of nutrient inputs and climate change on ocean biogeochemical cycles, respectively, and the relationship between nutrient inputs and climate change was assessed.
The results showed that anthropogenic nutrient inputs to the ocean enhance oceanic primary production and carbon uptake mainly in the coastal regions, but also significantly on a global scale. These global increases by anthropogenic nutrient inputs offset most of global reductions in primary production and carbon uptake induced by climate change (Fig. 2). Furthermore, anthropogenic nutrient inputs significantly accelerate climate-driven deoxygenation in the upper ocean (Fig. 3). These results suggested that human activities cause global changes in the ocean biogeochemical cycles through both anthropogenic nutrient inputs and climate change (Fig. 1).
Because atmospheric and riverine nutrient inputs increase or remain relatively constant during the remainder of 21st century, the effect of anthropogenic nutrient inputs on ocean biogeochemistry could continue. To properly assess future and past changes of ocean biogeochemistry attributable to human activities, it is necessary to consider not only the effect of climate change but also the effect of anthropogenic nutrient inputs.
This paper has been published in Science Advances on July 2, 2022. The research was partially supported by the national research fund of JSPS Kakenhi (grant number: JP20K12144) and the Integrated Research Program for Advancing Climate Models (TOUGOU) (grant number: JPMXD0717935715) from the Ministry of Education, Culture, Sports, Science, and Technology (MEXT), Japan.
- JAMSTEC
- Atmosphere and Ocean Research Institute, The University of Tokyo
- Institute of Industrial Sciences, The University of Tokyo
【Supplemental Information】
- ※1
- Primary production:
The production of organic matter by phytoplankton through photosynthesis. Production rate is controlled by water temperature, light intensity, and nutrient levels.
- ※2
- Deoxygenation:
Reduction in the oxygen content of the oceans. Fish and other higher organisms face habitat compression owing to the increase in ocean areas with low dissolved oxygen concentrations. Deoxygenation is considered a major stress on marine ecosystems, along with increased seawater temperature, acidification, and changes in primary production.
- ※3
- Earth system model:
A numerical model that includes climate model incorporating physical processes in the atmosphere, ocean, and land as its core and encloses the models of carbon and other global geochemical material cycles, and other biogeochemical processes.
- ※4
- IPCC:
An intergovernmental body of the United Nations responsible for advancing scientific knowledge on human-induced climate change. The Sixth Assessment Report (AR6) was published in 2021–2022.
- ※5
- CMIP:
Abbreviation for the Coupled Model Intercomparison Project conducted under the World Climate Research Programme. The climate simulations cited in IPCC AR5 and AR6 were conducted in the fifth (CMIP5) and sixth (CMIP6) phases of this project.
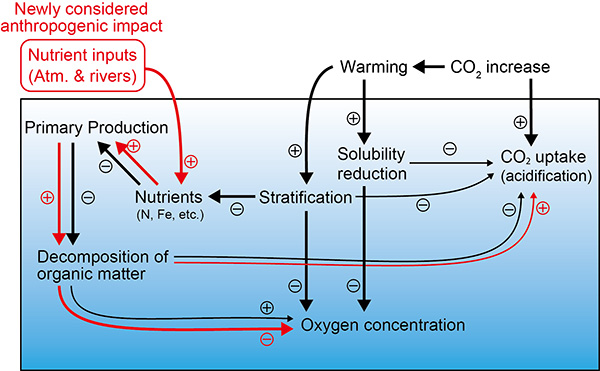
Figure 1: Schematic of the oceanic biogeochemical changes associated with climate change (black lines) and anthropogenic nutrient inputs to the ocean (red lines).
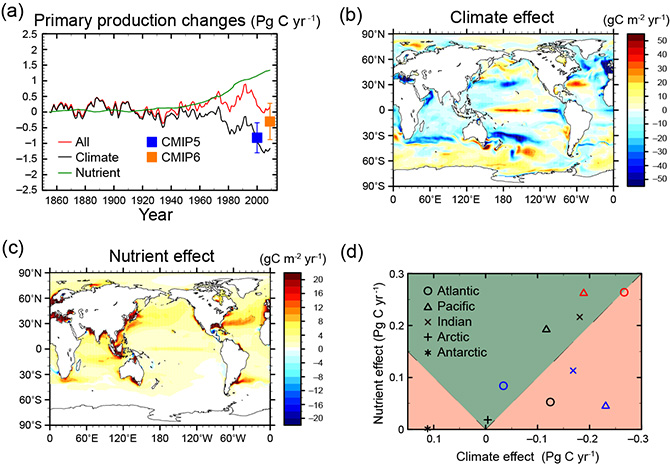
Figure 2: Changes in primary production. (a) Time series of changes in the globally integrated primary production for climate (black line), anthropogenic nutrient (green line), and all effects (red line). Historical trends in CMIP5 and CMIP6 (※5) models are shown as blue and orange squares, respectively. (b) Distribution of changes in primary production caused by climate effect. The values show changes from preindustrial level to the last 10 years (2005–2014). (c) Distribution of changes in primary production caused by anthropogenic nutrient effect. (d) Comparison between climate and anthropogenic nutrient effects on primary production changes for each basin. Atlantic, Pacific, and Indian oceans are also divided into northern (red: 15°–60°N), low-latitude (black: 15°S–15°N), and southern (blue: 5°–50°S) regions. Green and red background indicate that the effect of anthropogenic nutrients and climate is the dominant factor in net primary production changes, respectively.
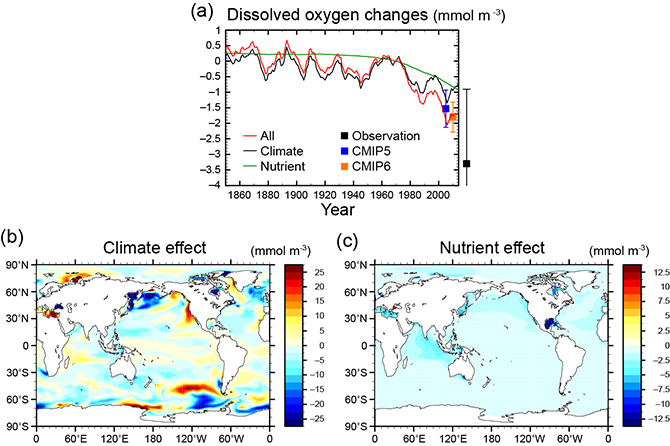
Figure 3: Changes in Dissolved oxygen. (a) Time series of changes in dissolved oxygen concentration in the upper 1000 m caused by climate (black line), anthropogenic nutrients (green line), and all effects (red line). Values are anomalies relative to 1970. Observed change from 1970 to 2010 is shown as black square. Historical trends in CMIP5 and CMIP6 models are shown as blue and orange squares, respectively. (b) Distribution of oxygen changes caused by climate effect. The values indicate change from 1970 to 2010. (c) Distribution of oxygen changes caused by anthropogenic nutrient effect.
Contacts
- (For this study)
- Akitomo Yamamoto, Project Researcher
Atmosphere and Ocean Research Institute (AORI)
The University of Tokyo - Michio Kawamiya, Director, Research Center for Environmental Modeling and Application (CEMA), Research Institute for Global Change (RIGC), JAMSTEC
- (For press release)
- Press Office, Marine Science and Technology Strategy Department, JAMSTEC
- Public Relations Office, Center for Cooperative Research Promotion, Atmosphere and Ocean Research Institute, The University of Tokyo