Press Releases
JAMSTEC
THE UNIVERSITY OF TOKYO
KYUSHU UNIVERSITY
Successful detailed simulation and visualization of atmospheric gravity waves during stratospheric sudden warming
―What does the long journey of mysterious atmospheric gravity waves mean?―
1. Key Points
- ◆
- Detailed simulation and visualization of atmospheric gravity waves during the stratospheric sudden stratospheric warming that occurred in February 2018 successfully revealed the characteristic morphology of atmospheric gravity waves that dramatically deform around the polar vortex (*1).
- ◆
- The most notable example is a new picture of atmospheric gravity waves that travel much longer distances than previously imagined by researchers, traveling thousands of kilometers along the edge of the polar vortex over North America with a large counterclockwise rotation, rising and dissipating around 50-70 km in altitude.
- ◆
- The results of this research suggest that the conventional assumption that generated atmospheric gravity waves propagate only almost directly upward does not hold true in many cases, and that atmospheric gravity waves propagating from unexpected places can impart momentum carried at unexpected times to the surrounding atmosphere, causing sudden changes in stratospheric and mesospheric winds and mixing of materials.
【Glossary】
- *1
- Polar Vortex:
The stratospheric and mesospheric Arctic and Antarctic regions are covered by a huge, cold low pressure system from late fall through spring. Strong westerly winds blow around the edges of this low pressure system. This cold low and the surrounding westerly winds together are called the polar vortex. The shape of the polar vortex is not stable throughout the season and often deforms; in mid-February 2018, the deformation of the polar vortex became so large that it split in two.
2. Overview
Shingo Watanabe of the Research Center for Environmental Modeling and Application, Japan Agency for Marine–Earth Science and Technology (JAMSTEC), and Dai Koshin, a third-year PhD student in the Department of Earth and Planetary Science, Graduate School of Science, the University of Tokyo, Shunsuke Noguchi, an assistant professor in the Graduate School of Science, Kyushu University, and Kaoru Sato, a professor in the Graduate School of Science, the University of Tokyo, have conducted a study on the characteristics of atmospheric gravity waves generated during stratospheric sudden warming. By performing detailed simulations and visualization of atmospheric gravity waves generated during stratospheric sudden warming, they have succeeded in clarifying the characteristic morphology of atmospheric gravity waves that deform dramatically around the polar vortex.
Atmospheric gravity waves are a type of oscillation generated when the atmosphere is shaken up and down by various mechanisms, and they propagate through the atmosphere in three dimensions. They are known to play an important role in the formation of atmospheric general circulation in the stratosphere and mesosphere because of their momentum-carrying property and their role in accelerating the surrounding atmosphere and mixing materials when they dissipate at the destination. On the other hand, it has been difficult for sensors used for observation to continuously capture the focused atmospheric gravity waves due to their nature of being fixed to the ground or mounted on balloons or satellites, and thus the life cycle of various types of atmospheric gravity waves has been a mystery.
In this study, detailed simulations of atmospheric gravity waves were performed using atmospheric fields that correspond to observed facts, and the results were visualized and analyzed to clarify the lives of various types of atmospheric gravity waves. The period of interest for this simulation is the stratospheric sudden warming event that occurred in February 2018. During this event, the "polar vortex," which normally covers the Arctic, split into two parts with centers over North America and Central Asia. As a result of observing the distribution of atmospheric gravity waves generated during this event from various perspectives, a swarm of atmospheric gravity waves with a characteristic funnel-like shape was observed in the vicinity of the polar vortex over North America. This was discovered for the first time in this simulation. (See Figure 1(b)).
Furthermore, by combining 3D movie analysis and ray tracing analysis (*2), the research team was able to clarify the origin and propagation path of these atmospheric gravity waves. The most notable example is a new image of atmospheric gravity waves that travel thousands of kilometers along the edge of the polar vortex over North America, rotating widely counterclockwise and rising to an altitude of around 50-70 km, a much longer distance than previously imagined by researchers (Fig. 2(c) and (d)).
This research result indicates that the conventional assumption that generated atmospheric gravity waves propagate only almost directly upward, which is used in the gravity wave parameterization of weather forecasting and climate prediction models, does not hold in many cases, and that atmospheric gravity waves propagating from unexpected places can impart momentum carried at unexpected times to the surrounding atmosphere, causing sudden changes in stratospheric and mesospheric winds and mixing of materials.
Further in-depth studies are expected to reveal the mysterious behavior of atmospheric gravity waves and the role played by the unknown teleconnection caused by these waves.
This research was supported by CREST (JPMJCR1663) from the Japan Science and Technology Agency (JST), Grant-in-Aid for Scientific Research (JP22H00169) from the Ministry of Education, Culture, Sports, Science and Technology (MEXT), and the Research Program for Advanced Integrated Climate Modeling (JPMXD0717935715). VAPOR (www.vapor.ucar.edu) was used to create the 3D images used in this study.
The results of this study will be published in the “Journal of Geophysical Research – Atmosphere” on October 5 (JST).
- Japan Agency for Marine–Earth Science and Technology (JAMSTEC)
- Graduate School of Science, the University of Tokyo
- Graduate School of Science, Kyushu University
【Glossary】
- *2
- Ray tracing analysis:
An analysis method that estimates the propagation path of atmospheric gravity waves using equations that combine the intrinsic parameters of atmospheric gravity waves (horizontal wavelength, vertical wavelength, horizontal phase speed, vertical phase speed, period, etc.) and the rate at which the parameters of the surrounding atmosphere (calculated from wind, temperature, etc.) vary in space.
3. Background
The Earth's atmosphere is filled with waves of various sizes and types, ranging from planetary-scale planetary waves to mountain waves of several kilometers in wavelength. Stratospheric sudden warming is known as a dramatic event in which a planetary-scale cold cyclone "polar vortex" covering the stratosphere in winter is greatly deformed by amplified planetary waves, and the downwelling over the North Pole intensifies, raising temperatures by tens of degrees in just one or two days. Stratospheric sudden warming can have a strong remote influence on the weather several weeks to months after its occurrence, and there is growing interest in its potential for improving seasonal forecasts
Atmospheric gravity waves are another type of wave motion that fills the Earth's atmosphere. The oscillations generated when the atmosphere is shaken up and down by various mechanisms propagate through the atmosphere in three dimensions. This is in contrast to waves propagating over the ocean surface and the Lamb waves and Pekeris waves introduced in a recent press release, which propagate only horizontally in two dimensions. Atmospheric gravity waves are known to carry momentum and, together with planetary waves, play an important role in the formation of atmospheric general circulation in the stratosphere and mesosphere.
However, the nature of the sensors used for observation, which are fixed to the ground or mounted on balloons or satellites, limits their field of view and causes them to pass by, making it difficult to continue capturing the focused atmospheric gravity waves as if a TV camera were chasing a ball. Another idea was to use the geostationary meteorological satellites, but it is limited by its inability to see high latitudes and its inability to capture the vertical structure of atmospheric gravity waves folded in the direction of height in a three-dimensional manner. Therefore, it has remained a mystery what kind of life each of the various types of atmospheric gravity waves that originate in different parts of the world and fly around in the Earth's atmosphere will lead.
On the other hand, simulations cannot directly describe the lifetime of small-scale atmospheric gravity waves by using equations of motion, etc., because they are smaller than the grid size of atmospheric models used for weather forecasting and climate prediction.
Furthermore, if the effect of momentum transport by atmospheric gravity waves is ignored, it is impossible to correctly represent the position and strength of westerly wind jets, which are the path of extratropical cyclones. Therefore, a method called "gravity wave parameterization" is used to approximate them based on theory. The assumption used is that "generated atmospheric gravity waves propagate only directly upward." In order to find out when, where, and to what extent this assumption holds true, the research team decided to focus on atmospheric gravity waves during a stratospheric sudden warming event, when the stratospheric circulation changes dramatically. The research team has developed the high-resolution Japanese Atmospheric General circulation model for Upper Atmosphere Research (JAGUAR), which can directly represent atmospheric gravity waves from the Earth's surface to the lower edge of the space. By simulating atmospheric gravity waves using JAGUAR, they have pointed out the importance of the three-dimensional propagation of atmospheric gravity waves. The starting point of this research was the idea of "observing atmospheric gravity waves around the world from various angles, just as they are, at the timing you want to see them, like products or models in a showcase".
Regarding the technical aspects, in order to perform detailed simulations of atmospheric gravity waves during the stratospheric sudden warming event that occurred in February 2018, it was necessary to prepare an atmospheric field that corresponded to the observed facts. The JAGUAR-DAS (JAGUAR Data Assimilation System), which has been developed by this research team, was used to assimilate a wide variety of observation data from the ground to an altitude of about 105 km with model simulation results (to improve the reproducibility of the simulation using the actual observation data). They have developed a method to first create an atmospheric field that corresponds to observation facts and then input it to the high-resolution JAGUAR, which is capable of directly representing atmospheric gravity waves. The Earth Simulator, a multi-architecture supercomputer owned by JAMSTEC, was used to perform and analyze the simulations in this study. For visualization, the research team used the free software VAPOR developed by the U.S. National Center for Atmospheric Research and a commercially available gaming PC.
This enabled detailed simulation and visualization of atmospheric gravity waves during stratospheric sudden stratospheric warming.
4. Results
In this study, the research team performed a detailed simulation of atmospheric gravity waves during the stratospheric sudden warming that occurred in February 2018, first providing a three-dimensional overview of atmospheric gravity waves in the Northern Hemisphere (Figure 1).
The image looks like a modern artwork, but in order to provide a panoramic view of the beauty of the structure woven by the natural phenomenon of atmospheric gravity waves from the ground to the lower edge of the universe, the research team devised a number of visualization techniques, including coloring the image with the prevailing east-west wind, which has a significant impact on the upward propagation of atmospheric gravity waves, while also drawing on the limits of the performance of the rendering software. They also used scientific and technological ingenuity to draw out the limits of the drawing software's performance. Although there had been detailed studies of limited types of atmospheric gravity waves in limited regions, this was the first time that even the experts in the research team had seen the full extent of such atmospheric gravity waves.
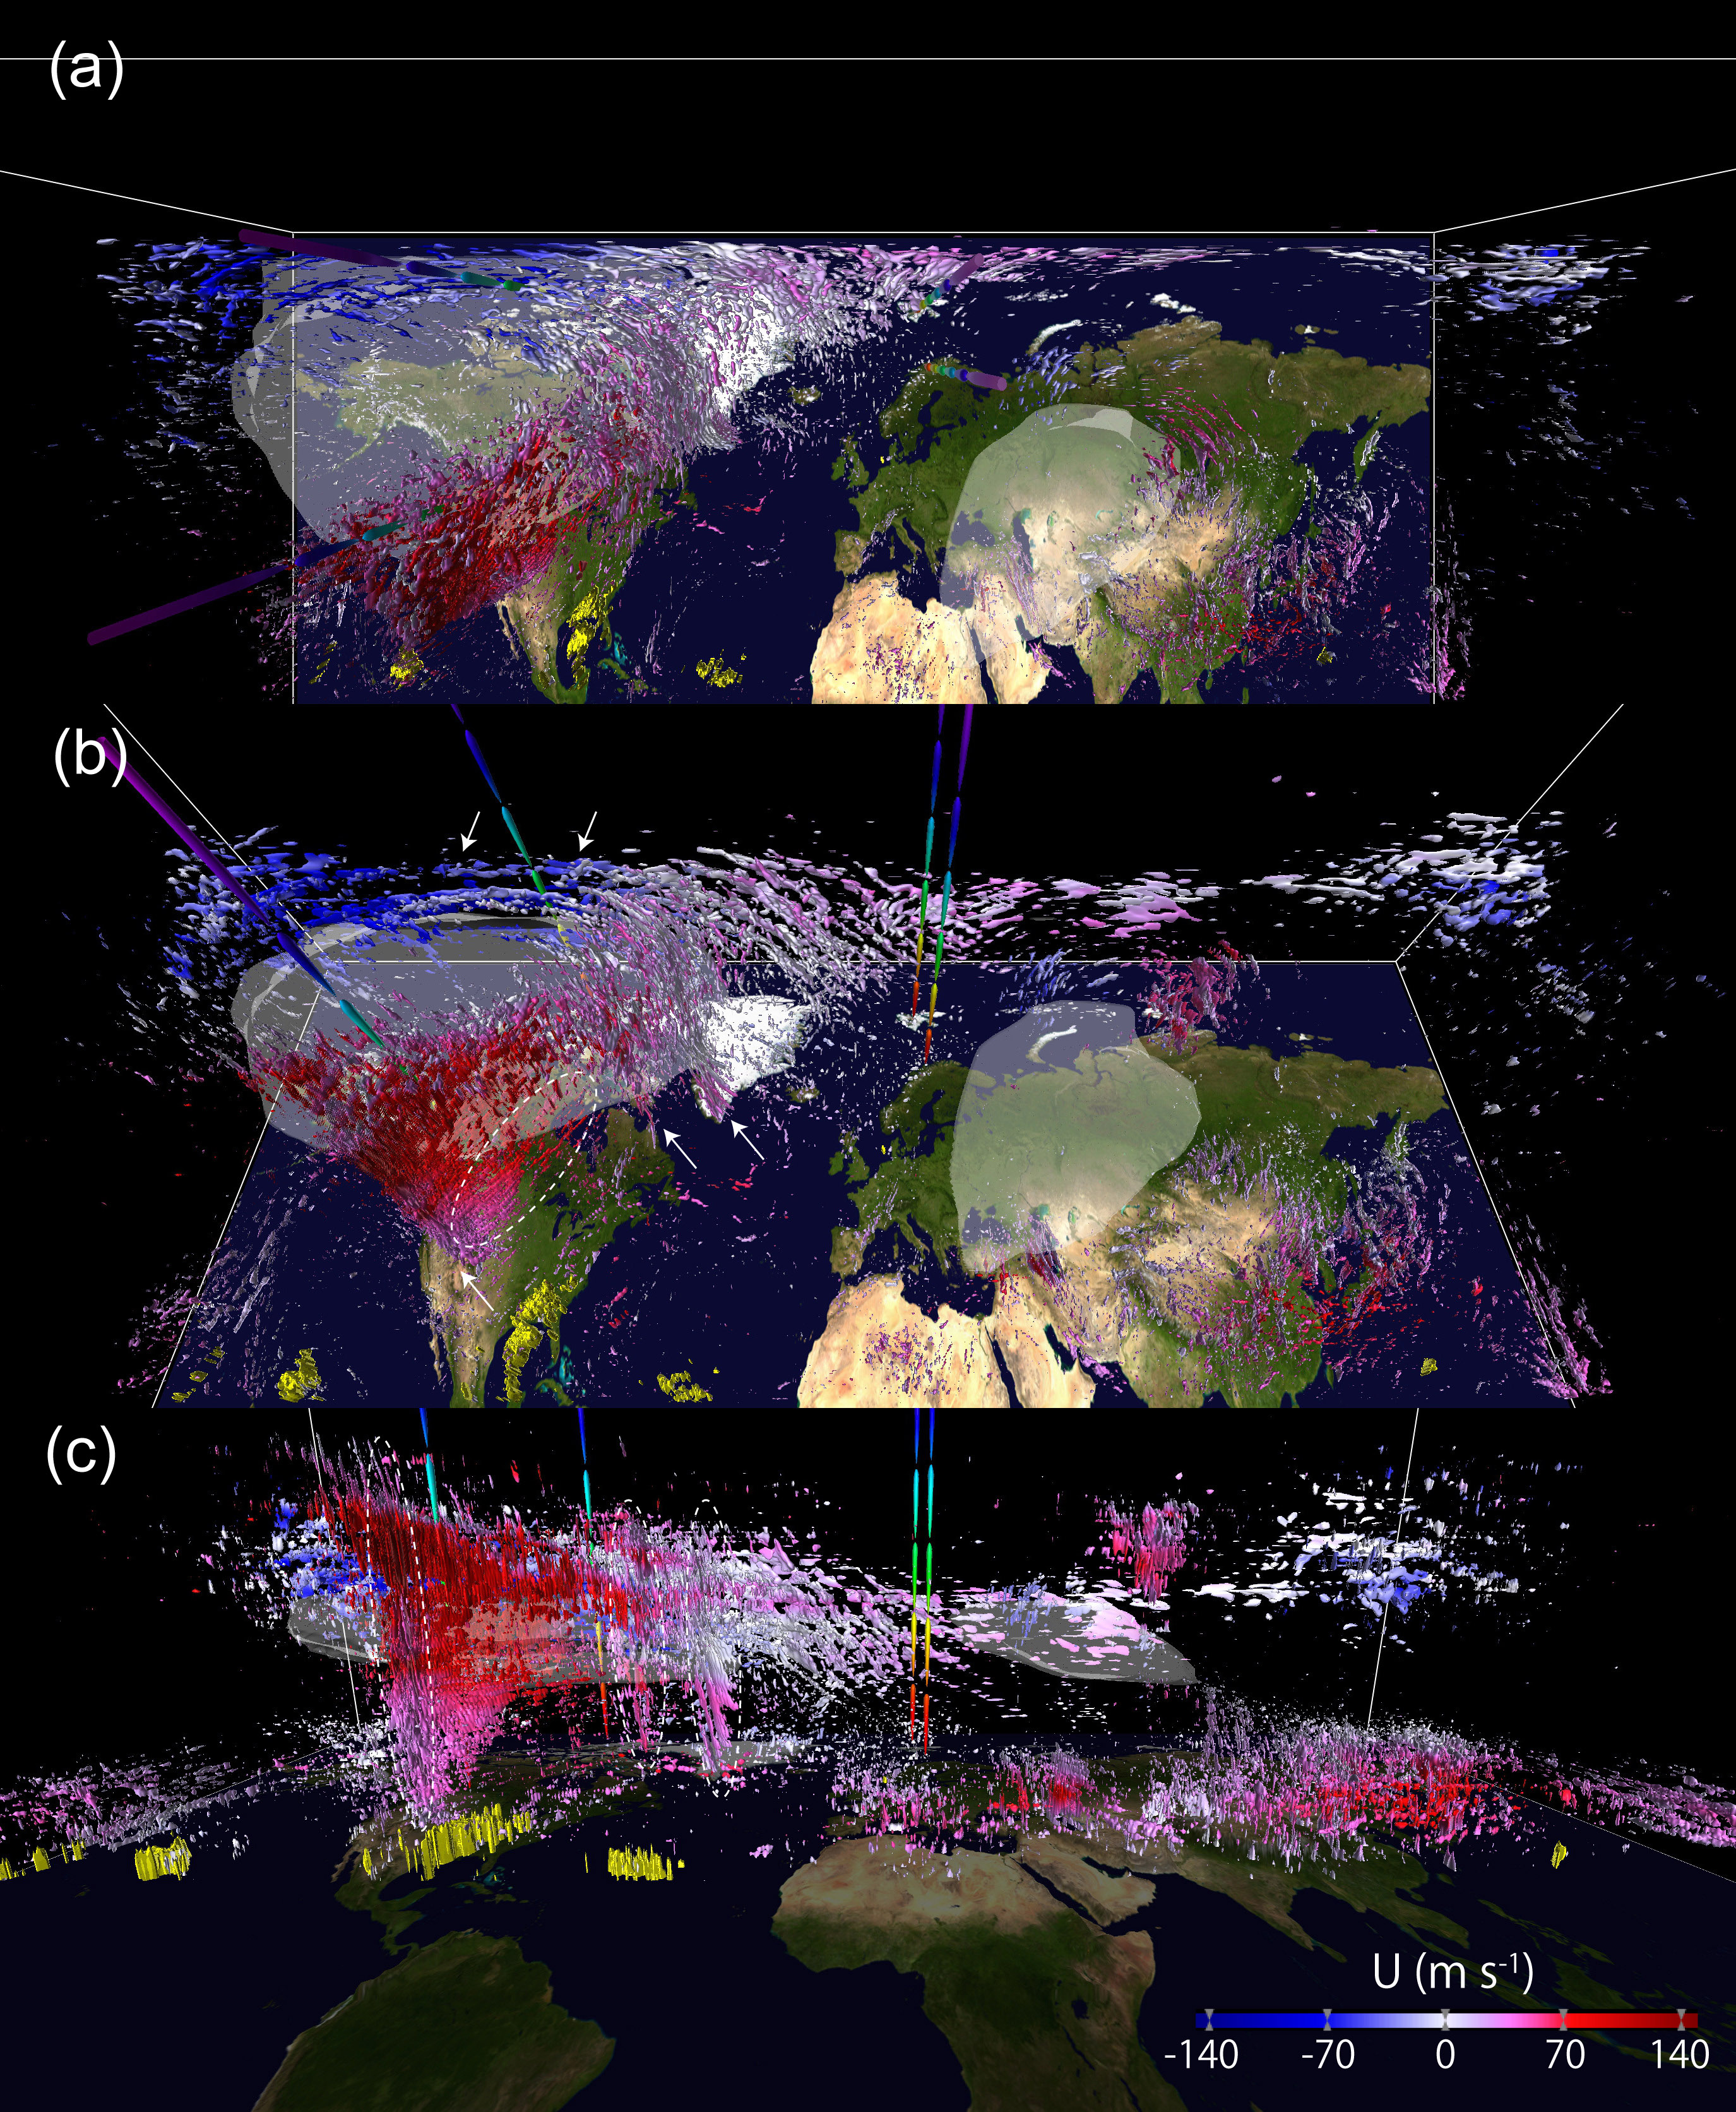
Figure 1 A "showcase view" of the 3D visualization results of a detailed simulation of atmospheric gravity waves during a stratospheric sudden warming event (February 12, 2018). The atmospheric gravity waves are colored by the in-situ east-west winds, with red for eastward winds and blue for westward winds. Four columns colored red, yellow, green, cyan, blue, and purple from the ground represent approximate heights (painted at 20 km intervals).
【Supplemental】A 3D propagating atmospheric gravity wave looks like a wave when viewed in one- or two-dimensional cross sections, but in 3D space, it has the appearance of a folded entity made up of long, thin bars, grains, flat plates, elliptical line segments, etc., and is therefore represented as shown in the figure.
Figure 1(a) is a view looking down from directly above. The North American continent is on the left, with the Atlantic Ocean and Greenland in between, followed by Europe and Eurasia near the center, and the Japanese archipelago to the right. The white translucent oval and the surrounding red, white, and blue colored fine bar-like structures over North America and Greenland indicate a polar vortex that has split in two and a swarm of three-dimensionally propagating atmospheric gravity waves generated around the polar vortex. The other polar vortex is seen over Central Asia, but it is not surrounded by atmospheric gravity waves. Since the three-dimensional structure cannot be seen only from the figure directly above, we looked at it from other angles as shown below.
Figure 1(b) is an oblique view from above the equator. An atmospheric gravity wave with a characteristic funnel-like shape surrounds the polar vortex over North America. This was first discovered in this simulation. The three arrows at the bottom of the figure indicate atmospheric gravity waves generated by winds blowing over steep terrain such as the Rocky Mountains, the Labrador Peninsula, and the Greenland ice sheet, and propagating from near the ground to the sky. It has been theoretically explained that these atmospheric gravity waves propagate from near the ground to the stratosphere and mesosphere, where the wind direction does not change significantly. Those regions are called "hot spots of atmospheric gravity waves." As you can see in the movie below, the locations of these hot spots change from time to time as the wind direction changes at each location and altitude. Another element that forms the funnel-like structure is the atmospheric gravity wave flying from the Rocky Mountains to the northeast, shown as an ellipse in the figure. Recent studies have revealed that such oblique atmospheric gravity waves also exist, but this is the first time they have been seen in the Rocky Mountains.
Figure 1(c) is a view looking directly north from mid-latitude over the Southern Hemisphere. The dashed ovals indicate the three atmospheric gravity waves seen earlier. If we focus on the atmospheric gravity wave that originated near the southern tip of Greenland and propagate above, we can see that it has an oblique stripe structure that is suitable for being called waves. In contrast to the North American continent and Greenland, the atmospheric gravity wave generated near the ground over Eurasia appears to remain in the troposphere. This is due to the significant change in wind direction between the troposphere and the stratosphere. The location where these gravity waves are difficult to propagate also changes from time to time with the change in wind direction at each location and altitude.
Apart from those that generate near the ground, there are also atmospheric gravity waves that generate in the stratosphere and mesosphere. The two arrows on the upper side of Figure 1(b) indicate atmospheric gravity waves that are generated at an altitude of around 30 km when the polar vortex deformation intensifies, and then widely rotate counterclockwise along the edge of the polar vortex as they rise. These are clearly different in appearance from the atmospheric gravity waves that propagated above from the southern tip of Greenland. Thus, the atmospheric gravity waves seen in the stratosphere and mesosphere could either have propagated upward from near the ground in a similar wind direction or originated within the stratosphere or mesosphere.
Next, the research team picked up some of the characteristic atmospheric gravity waves found in the panoramic overview, created and analyzed 3D movies for each lifetime, and plotted the propagation paths estimated by ray tracing analysis in an overlay around the North American continent in Figure 1(b) (Figure 2(a)). Figure 2(c), which removes the atmospheric gravity waves, is easier to see. The colorful bent tubes indicate the propagation paths of atmospheric gravity waves and their altitudes in colors. The numbers are the estimated locations of each generation. Some of the atmospheric gravity waves originate near the Earth's surface and propagate almost directly above (Nos. 4, 5, 6, 20, and 21), but around the polar vortex over North America, the atmospheric gravity waves are refracted due to large spatial changes in wind direction and speed, and thus they travel for several thousand kilometers along the edge of the polar vortex in a counterclockwise direction (Nos. 1, 7, 8, 9, 12-19). Those provide a new picture of atmospheric gravity waves that travel much longer distances than previously imagined by researchers. To get an idea of where and how much each atmospheric gravity wave rises, look at Figure 2(d), which looks over North America from over Europe.
Comparing the distribution and appearance of atmospheric gravity waves in Figures 2(a) and 2(b) with their propagation paths, we can see that atmospheric gravity waves propagating almost directly upward have a diagonal stripe structure, while those propagating over long distances have a structure something like obliquely flying bars.

Figure 2 (a) Close-up of the sky over North America in Figure 1(b), plus the path of the atmospheric gravity wave from its point of origin to its point of dissipation obtained by ray tracing analysis. (b) View over North America from over Europe. (c) From (a), excluding gravity waves, with the individual gravity wave origination points marked with numbers. The path of the gravity wave is colored by altitude. (d) View over North America from over Europe. Yellow near the surface indicates areas of large moist heating, and light blue near 30 km altitude indicates areas of large local Rossby number, which are prone to atmospheric gravity waves, respectively.
Finally, a 3D movie of atmospheric gravity waves before and after the stratospheric sudden warming is shown (Movie 1). Please see the explanation in the movie.
In this way, the research team was able to visualize the results of detailed simulations of atmospheric gravity waves and succeeded in obtaining a panoramic view from space of them that originate from various locations around the world and fly in different directions, changing into various forms. In addition, the researchers were able to obtain a new image of atmospheric gravity waves propagating over long distances, different from what they had previously imagined.
5. Future Outlook
The new picture of long-range propagation of atmospheric gravity waves obtained in this study suggests that the assumption that generated atmospheric gravity waves propagate almost directly upward, which is assumed in gravity wave parameterizations used in weather forecasting and climate prediction models, does not hold in many cases. This suggests that atmospheric gravity waves originated from unexpected sources can impart momentum carried at unexpected times to the surrounding atmosphere, causing sudden changes in stratospheric and mesospheric winds and mixing of materials.
Although it is certain that atmospheric gravity waves have a great impact on the general circulation of various planetary atmospheres including the Earth, there are still many things that remain to be elucidated. Further research is needed to understand the role of unknown teleconnections by mysterious atmospheric gravity waves.
The detailed simulation and visualization methods for atmospheric gravity waves developed in this study can also be applied to sudden events such as the generation of Lamb and Pekelis waves from the volcanic eruption in Tonga, which was introduced in a recent press release. The researchers intend to continue to develop this technology as a tool for unraveling unknown atmospheric science events.
Contacts
- (For this study)
- Shingo Watanabe, Principal Researcher, Research Center for Environmental Modeling and Application (CEMA), Research Institute for Global Change (RIGC), JAMSTEC
- (For press release)
- Press Office, Marine Science and Technology Strategy Department, JAMSTEC
- Public Relations Office, Graduate School of Science, The University of Tokyo
- Kyushu University Public Relations Office