New proxy for integrating biodiversity and food-web structure ―Revolutionary observation on ecosystems using iTP―
1. Key points of the presentation
To elucidate the relationship between biodiversity and the who-eats-whom network (food web), the integrated trophic position (iTP※1) will be promising.
A global analysis for marine and freshwater ecosystems indicates that iTP reflects how biomass is changed across food chains.
The iTP index in a variety of ecosystems, which can be observed via amino acid nitrogen isotopic compositions※2, is expected to be a revolutionary proxy for solving global issues such as food production, fisheries resources, and energy.
iTP
In food webs, each organism occupies a unique ecological niche, namely trophic position (TP). For example, phytoplankton is defined TP = 1, which is eaten by zooplankton (TP = 2), which is eaten by small fish (TP = 3) which is eaten by large fish (TP = 4), which is eaten by top predators (TP = 5), etc. On the other hand, since biomass decreases with increasing TP, the distribution of biomass is often illustrated with a bottom-heavy pyramid. This is so-called an ecological pyramid (Supplemental Figure). The integrated trophic position (iTP) is defined as a biomass-averaged TP that integrates all the organisms involved in the focal ecological pyramid.
Amino acid nitrogen isotopic compositions
There are two types of amino acids in animals; non-essential amino acids that can be synthesized by animals themselves (e.g., glutamic acid); essential amino acids that animals cannot synthesize by themselves and should be taken up from foods (e.g., phenylalanine). Among these, glutamic acid increases its nitrogen isotope ratios (heavy 15N relative to light 14N) from primary producers to top predators. In contrast, the nitrogen isotope ratios in phenylalanine remain almost constant from primary producers to the top predators. Taking advantage of this, the nitrogen isotope ratios in glutamic acid and phenylalanine tell us the TP of organisms as well as the iTP of ecosystems.
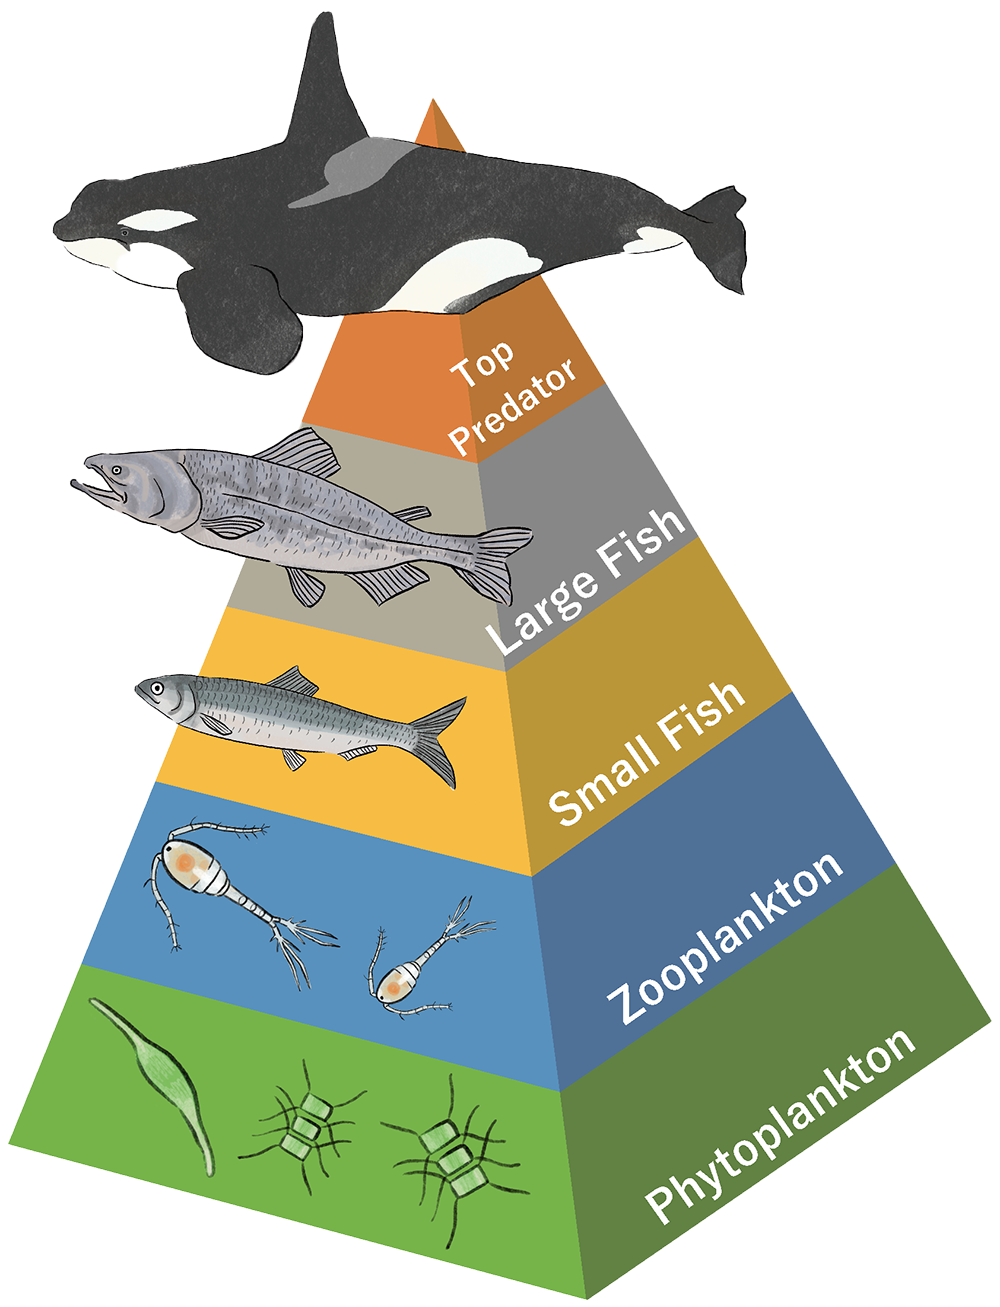
Supplemental Figure. An image of biomass distribution throughout the food chain, the so-called Ecological Pyramid.
2. Overview
Researcher Naoto F. Ishikawa at the Biogeochemistry Research Center of the Research Institute for Marine Resources Utilization at the Japan Agency for Marine-Earth Science and Technology (JAMSTEC) and his colleagues discovered that the complex relationship between biodiversity and food-web structure can be elucidated using a simple index, named integrated trophic position (iTP).
To design a sustainable earth ecosystem in the Anthropocene*3, it is necessary to understand the relationship between biodiversity and food webs (a network that draws who eats whom). JAMSTEC has established a method to estimate the trophic positions (TPs) of organisms and contributed to a variety of scientific advances during the last >15 years. However, it is still challenging to integrate biodiversity and food webs because no favorable index is available to date.
In this study, we evaluated the potential of the integrated trophic position (iTP), which we proposed in 2017, for the above proxy by analyzing a global dataset of marine and freshwater ecosystems. We found that biomass decreases along the food chain from primary consumers, such as zooplankton, to the top predators, such as killer whales. When the decrease in biomass was steep, vertical diversity (Dv) and iTP showed low values, making the ecological pyramid horizontally-long “Mt. Fuji”. In contrast, when the decrease in biomass was gradual, Dv and iTP showed high values, making the ecological pyramid vertically-long “Tokyo Tower”.
This study showed that the iTP can be a new index to bridge the gap between biodiversity and food web structure. The iTP index can be measured using amino acid nitrogen isotopic compositions. Therefore, a revolutionary observation using iTP in a variety of ecosystems is expected to reveal the efficiency and stability of ecological pyramids. The forthcoming results will provide significant information on global issues such as food production, fisheries resources, and energy.
The finding of this study is published in Methods in Ecology and Evolution on December 06, 2023 (Japan time). This study was supported by JSPS KAKENHI (22K19857).
Naoto F. Ishikawa1、 Ayaka Takashima2、 Hirokazu Maruoka3、 Michio Kondoh4
2. Ryukoku University
3. Kyoto University
4. Tohoku University
Anthropocene
A proposed geological epoch, including modern times, which focuses on the impact of human activities on the Earth.
3. Background
What makes Earth the planet of life? Does biodiversity of several tens of millions of species, including undiscovered ones, only matter? They do not live independently but do interactively via a food web network that links who eats whom. To design a sustainable Earth ecosystem in the future, it is necessary to elucidate how the decrease in biodiversity due to human activities drives food webs as a huge device for energy transfer. However, there has been no proxy for bridging between biodiversity and food web structures, which makes the problem unsolved.
To solve this problem, JAMSTEC has established a methodology for estimating the trophic position (TP) of organisms using compound-specific isotope analysis for nitrogen of amino acids (CSIA-AA). The methodology has contributed to many ecological findings by visualizing food webs in a variety of ecosystems. Furthermore, we have recently proposed a new methodology to estimate an integrated TP (iTP) by collecting, homogenizing, and measuring CSIA-AA for the entire community of organisms from a given ecosystem. Although it is predicted that the iTP would reflect food web structures, to date there is no scientific evidence available.
This study aims to reveal how the iTP index works. We hypothesized that when biomass has an exponential relationship with integer trophic levels (TLs), the vertical diversity Dv and iTP should also follow an exponential distribution. To test this hypothesis, we first analyzed a global dataset for marine and freshwater food webs archived in EcoBase (http://ecobase.ecopath.org) to transform complex food webs into simple food chains using the food network unfolding ※4. Next, we derived three complexity indices※5 and analyzed their relationships with the iTP. We expected that iTP and Dv will be able to bridge biodiversity and food web structures (Fig. 1).
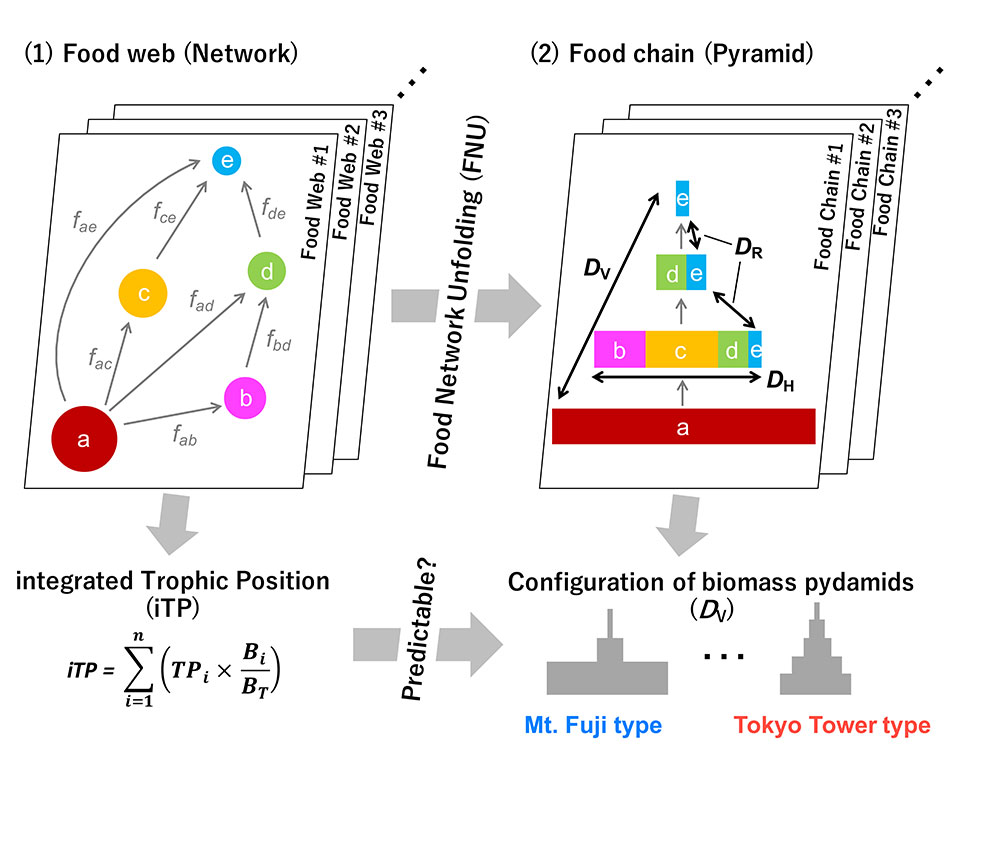
Figure 1. Graphical concept of the present study. (1) A food web is drawn as a network that links who eats whom. Color and alphabet denote organisms, and f represents the energy transfer between two organisms (e.g., fab represents the flux of organism a eaten by organism b). As a result, each organism has a unique trophic position (TP). The integrated TP is defined as a biomass-weighted TP of all organsisms. (2) A food chain is drawn as a pyramid that builds up biomass belonging to different trophic levels (TLs). A single organsim may have biomessess that belong to different TLs (e.g., organism e that eats and mixes organisms a, c, and d has biomasses belonging to three levels). The food network unfolding (FNU) converts a complex food web to a simple food chain, where three compexity indices, horizontal diversity (DH), range diversity (DR), and vertical diversity (Dv) are calculated. The present study aims to examine whether the configuration of biomass pyramids Dv is estimated using iTP.
Food network unfolding (FNU)
A technique that can transform a complex food web into a simple food chain based on who eats whom and the production and biomass of each organism. According to FNU, a community of organisms with unique trophic positions (TP, real numbers >1) is converted into a biomass distribution that alines with trophic levels (TL, integer numbers >1).
Three complexity indices
Horizontal diversity (DH), range diversity (DR), and vertical diversity (Dv) calculated from organism, biomass, and TL after FNU conversion. These indices are related to a biodiversity index, Shannon’s H’ as follows:
H’= DH + (Dv – DR)
4. Results
Our analysis revealed that the integer TLs and the biomass fairly follow an exponential distribution. In the 158 ecosystem pyramids analyzed, some showed a steep decrease in biomass with TL, while others showed a gradual decrease in biomass with TL. We may call the former “Mt. Fuji” type and the latter “Tokyo Tower” type (Fig. 2).
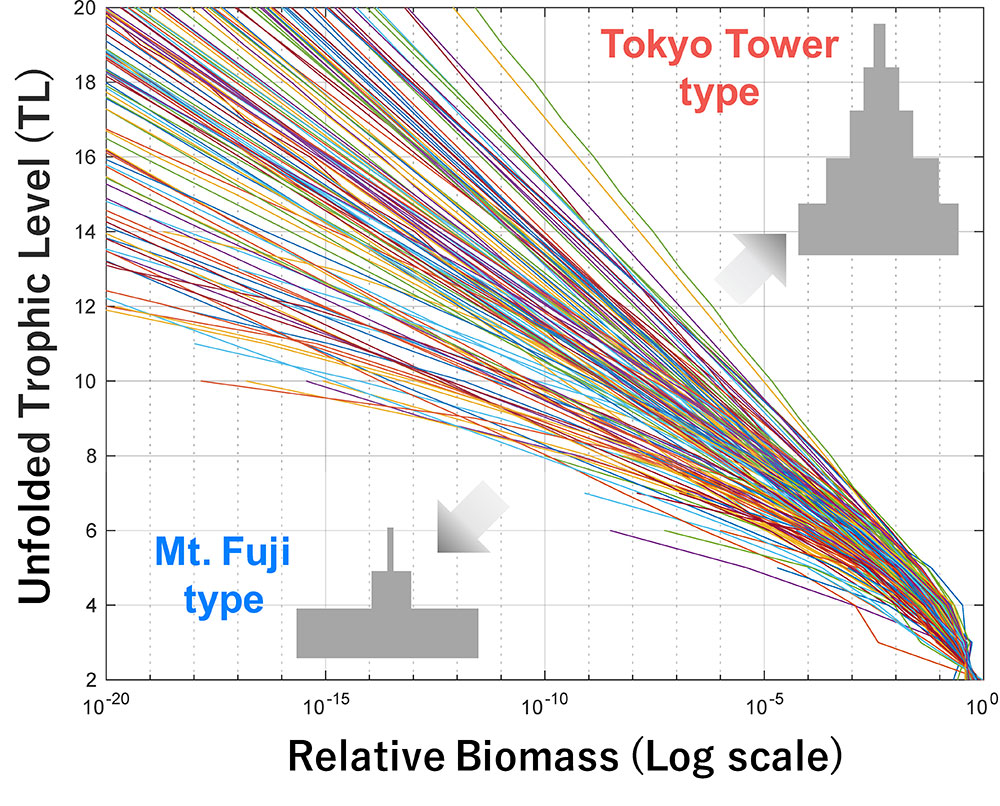
Figure 2. A plot showing how unfolded biomass decreases with integer trophic levels (TLs). The lower left direction indicates the Mt. Fuji type where biomass quickly decreases with TLs, which may be stable with respect to environmental changes due to its strong base. In contrast, the upper right direction indicates the Tokyo Tower type where biomass slowly decreases with TLs, which may be efficient in transferring energy to the top of the ecosystem. Colors indicate latitude (warm color: low latitude; cold color: high latitude). Note that the horizontal axis is a logarithmic scale.
The relationships between the iTP and the three complexity indices and the Shannon diversity index indicate that the iTP and Dv follow an exponential distribution, supporting our working hypothesis. That is, Dv, which is involved in both biodiversity and food web structure, can be estimated using iTP (Fig. 3).
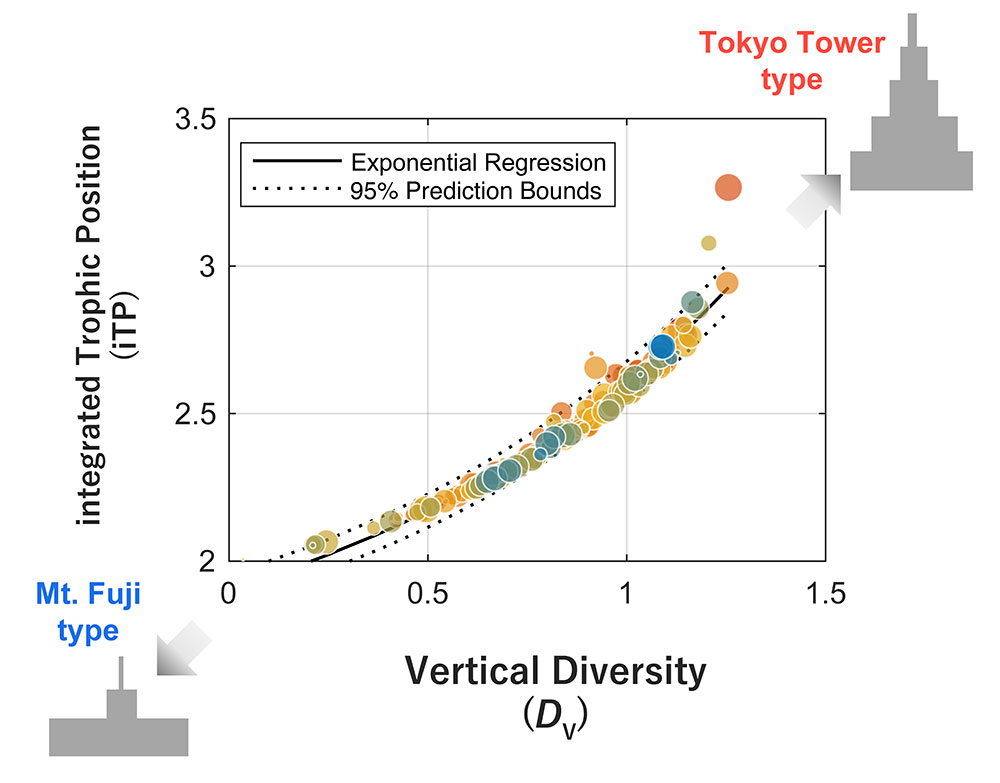
Figure 3. A plot showing the relationship between the integrated trophic position (iTP) and the vertical diversity (Dv). The working hypothesis of the present study was supported by the exponential relationship between iTP and Dv. That is, Dv, which is involved in both biodiversity and food web structure, can be estimated using iTP. An ecosystem with higher iTP and Dv shows a Tokyo Tower-type biomass distribution. In contrast, an ecosystem with lower iTP and Dv shows a Mt. Fuji-type biomass distribution. Colors indicate latitude (warm color: low latitude; cold color: high latitude). The circle size is scaled to the ecosystem size.
Furthermore, we estimate the iTP of the entire ecosystem using the iTP of its subset. This is because it is mathematically predicted that the total set is reconstructed using its subset when the relationship between biomass and TL follows an exponential distribution. The results show that the partial iTP that involves organisms of 2 ≤ TP < 3 is positively correlated with the iTP of the entire ecosystem (total iTP) (r 2 = 0.48) (Fig. 4). Since the estimated iTP from CSIA-AA is essentially the partial iTP, our findings suggest that the total iTP can be estimated using the partial iTP.
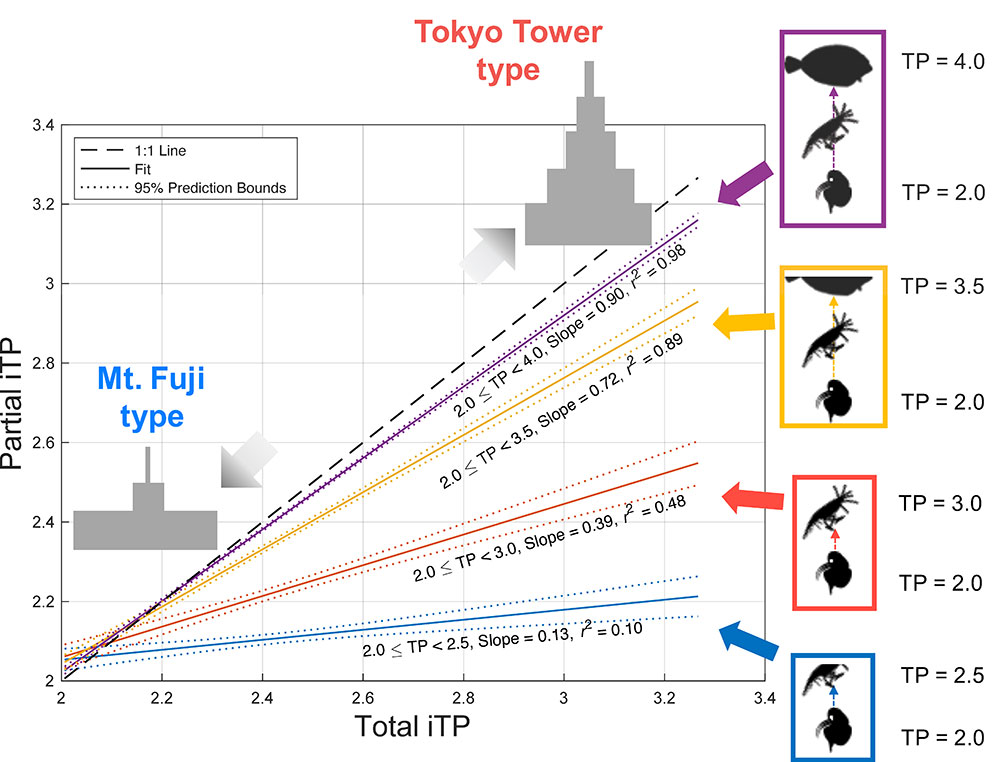
Figure 4. A plot showing the relationship between the iTP of partial ecosystems and the iTP of total ecosystems. It is mathematically predicted that the total set is reconstructed using its subset when the relationship between biomass and TL follows an exponential distribution. Blue, red, yellow, and purple lines indicate regression lines between iTP values calculated from organisms having 2 ≤ TP < 2.5, 2 ≤ TP < 3, 2 ≤ TP < 3.5, and 2 ≤ TP < 4, respectively, and the iTP values calculated from the entire ecosystems. The larger determination coefficient of the regression line (r 2) with closer to the 1:1 line is observed when organisms with higher TPs are involved in the iTP calculation. However, the partial iTP that involves organisms of 2 ≤ TP < 3 is positively correlated with the iTP of the entire ecosystem (total iTP) (r 2 = 0.48). Since the estimated iTP from CSIA-AA is essentially the partial iTP, our findings suggest that the total iTP can be estimated using the partial iTP.
5. Future prospects
The findings of the present study have the potential to revolutionize future ecosystem observations. The estimated Dv value using iTP will be able to elucidate the relationship between biodiversity and food web structures in a variety of ecosystems. Furthermore, it may be possible to quantify the effect of “excess” biodiversity on energy transfer in ecosystems by combining iTP with environmental DNA (eDNA)※6 to calculate H’– Dv. This will be useful, for example, to forecast how invasive species that have no enemies affect energy transfer or the stability of ecosystems.
We are planning to develop the new observation using iTP in marine and terrestrial ecosystems in the future. The upcoming results will reveal the role that biodiversity plays in the configuration of the food webs, which is necessary to design a sustainable Earth ecosystem in the Anthropocene. We believe that this will contribute to solving global issues such as food production, fisheries resources, and energy, as well as elucidating an ultimate mystery of what makes Earth the planet of ecosystems.
Environmental DNA (eDNA)
A technique for investigating biodiversity by analyzing DNA in an environment, which has been recently developed and will be compatible with iTP.
For this study
Naoto Ishikawa, Resercher, Research Institute for Marine Resources Utilization (MRU), Biogeochemistry Research Center (BGC), Bioelement Dynamics Research Group, JAMSTEC
For press release