Isotopic models and precise observations identify "footprints" of methane ~ Measures in agriculture and landfill are also important to reduce methane emissions ~
1. Key Points
Reducing methane (CH4) emissions is crucial for mitigating global warming in the short term. This study aims to refine emission estimations by source sectors, contributing to international efforts like the Global Methane Pledge※1 to curb CH4 emissions.
Each source of CH4 has a unique isotope signature※2 (Fig. 1). This study introduces a novel approach by incorporating CH4 isotope ratio (δ13C-CH4) alongside its concentration into an atmospheric chemical transport model※3 to identify major emission sectors responsible for variations in the atmospheric CH4 concentrations over the past 30 years.
Methane leaks from fossil fuels showed a decline in the 1990s and early 2000s but have remained relatively stable since then. This contrasts with existing inventories estimates indicating increased leaks associated with oil, natural gas, and shale gas extraction.
From the 1990s to the 2010s, there was a marked increase in CH4 emissions of microbial origin. In particular, landfills and the agriculture/livestock industry accounted for 75% of this increase.
Global Methane Pledge (GMP).
Recognizing the priority of CH4 abatement for addressing climate change in short term, 110 countries have recently committed to reduce global anthropogenic CH4 emissions by 30% from 2020 levels by 2030 through the "Global Methane Pledge" initiative, launched at the United Nations Climate Change Conference, COP26 in Glasgow in 2021. This pledge aims to support the Paris Agreement's goal of limiting global warming to 1.5°C.
Isotope signature
The isotope ratios of CH4 (δ13C-CH4 and δD-CH4) indicate a very little change in atomic abundance of stable carbon and hydrogen isotopes in the CH4 molecule. They provide information on origins and fates of atmospheric CH4 since different sources show characteristic signatures and sink processes make the effects of specific fractionations (Fig. 1). For example, the δ13C-CH4 signatures of microbial sources (-55‰ to - 70‰; ‰ is per mil or per thousand) are lower than the atmospheric δ13C-CH4 value (approximately -47‰), while fossil fuel sources have higher δ13C-CH4 values (-35‰ to -50‰).
Atmospheric chemical transport model (ACTM)
A numerical model that calculates the distribution of various substances in the atmosphere and their temporal changes using a large-scale computer, taking into account chemical reaction processes in the atmosphere and transport processes due to wind and other factors. It is used not only to explain the factors of fluctuations in the distribution of substances in the past, but also to evaluate the impact of various chemical release regulations on the future air environment and its climate.
Emission inventories
Emission inventories provides amount of CH4 emitted globally and in each country from different sources by accounting activity data (total amount) and emission factors (amount of CH4 released per unit of mass) for human made sectors (e.g., leaks from coal mines, oil and natural gas (ONG) wells and pipelines; emission from agriculture, livestock, landfills etc) and utilizing environmental factors in process-based models for natural emission sectors (e.g., wetlands, termites etc.).
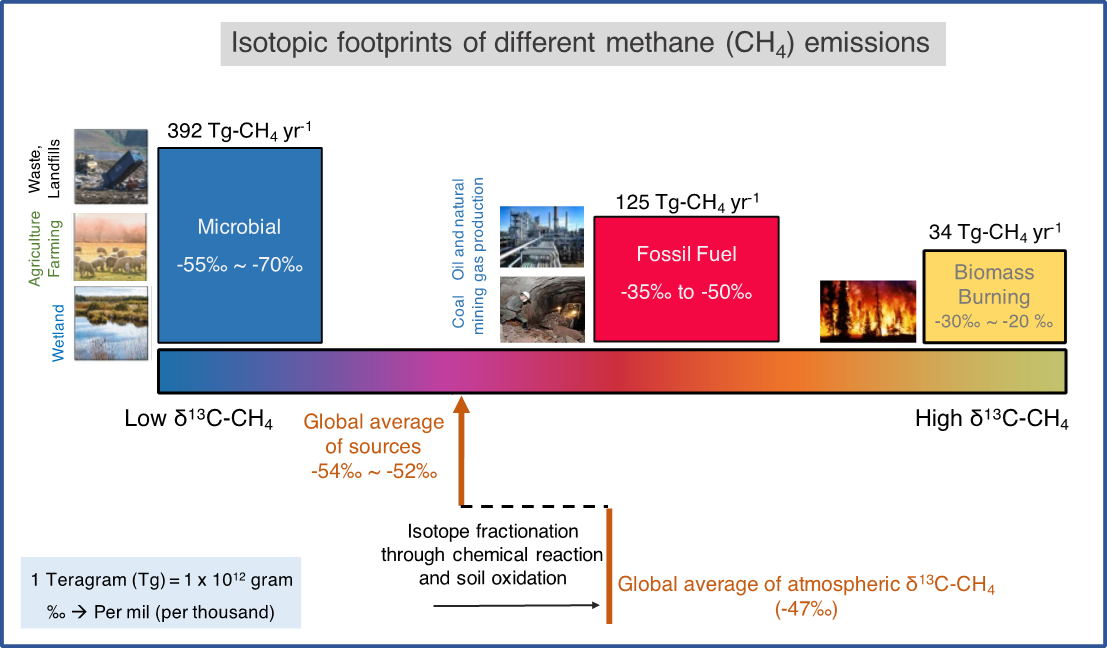
Figure 1. Conceptual diagram of this study.
The stable carbon isotope ratio is the relative difference between the abundance of carbon isotopes in a molecule and the value of a standard sample, and is expressed as δ13C. Since each methane emitting source has a characteristic stable carbon isotope ratio, it is possible to estimate the total amount of methane and the contribution of each emitting source by balancing the observed atmospheric concentration and isotope ratio and the amount of isotope ratio change and release in atmospheric chemical reactions.
2. Overview
A research led by Dr. Naveen Chandra, a Postdoctoral Researcher, and Dr. Prabir Patra, a Principal Scientist, from the Institute of Arctic Climate and Environment Research (IACE) at the Japan Agency for Marine-Earth Science and Technology (JAMSTEC), in collaboration with researchers from various institutions (Tohoku University, the Meteorological Research Institute (MRI) in Japan, the International Institute for Applied Systems Analysis (IIASA) in Austria, the National Institute for Environmental Studies (NIES) in Japan, the National Institute of Polar Research (NIPR) in Japan, the University of Colorado in the USA, and Utrecht University in the Netherlands) developed a novel method to analyze the footprints of methane (CH4) emissions from fossil fuels and microbial sources on the changes in atmospheric CH4 concentrations over the past 30 years by combining emission inventories※4 (Fig. 2) and high-quality atmospheric observation data of CH4 concentrations and its stable carbon isotope ratios (δ13C-CH4) with global atmospheric chemical transport model, i.e., JAMSTEC’s MIROC4-ACTM.
The analysis revealed CH4 emissions from fossil fuel sources decreased in the 1990s and early 2000s, and remained almost constant thereafter. From the 1990s to the 2010s, large increase (~46 Tg) in CH4 emissions from microbial sources, mainly waste landfills (~40% of total increase) and animal farming (~34% of total increase) is observed. Additionally, CH4 emissions from wetlands contributed significantly to year-to-year variability but accounted for a relatively small proportion of the overall emissions increase.
Our result contradicts emission trends in the currently existing inventories, such as increasing emissions from oil and natural gas during 1990–2020 and substantial increase (2008-2020) in CH4 emissions associated with shale gas extraction in the United States, highlighting the need for further examination of emission factors and statistics to accurately assess past and current CH4 emissions. The results of this study will contribute to achieving international targets for reducing CH4 emissions.
The research was published in the Communications Earth & Environment journal on April 17 and was supported by the Arctic Challenge for Sustainability II (ArCS II) project (grant no. JPMXD1420318865), funded by Japan's Ministry of Education, Culture, Sports, Science, and Technology (MEXT).
Naveen Chandra1, Prabir K. Patra1,2,7, Ryo Fujita3, Lena Höglund-Isaksson4, Taku Umezawa5, Daisuke Goto6, Shinji Morimoto7, Bruce H. Vaughn8, Thomas Röckmann9
2. Center for Environmental Remote Sensing (CEReS), Chiba University, Chiba, Japan
3. Meteorological Research Institute, Tsukuba, Japan
4. International Institute for Applied Systems Analysis (IIASA), Laxenburg, Austria
5. National Institute for Environmental Studies, Tsukuba, Japan
6. National Institute for Polar Research, Tachikawa, Tokyo, Japan
7. CAOS, Tohoku University, Sendai, Japan
8. INSTAAR, University of Colorado, Boulder, Boulder, CO, USA
9. Institute for Marine and Atmospheric Research Utrecht, Utrecht University, Utrecht, The Netherlands
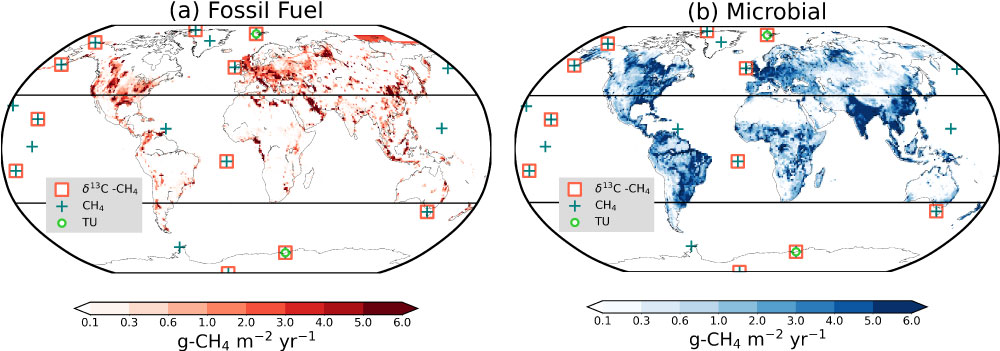
Figure 2. Geographical distributions of CH4 emission for aggregated fossil fuel and microbial emissions used to prepare the base simulations. The symbols in maps (a and b) represent observation locations operated by Institute of Arctic and Alpine Research (INSTAAR)/ National Oceanic and Atmospheric Administration (NOAA) (square for CH4 and plus for δ13C-CH4) and Tohoku University (TU) / National Institute of Polar Research (NIPR) (green circles for both CH4 and δ13C-CH4). Observation from these sites were used to evaluate the simulations over three latitudinal bands (separated by lines).
3. Background
CH4, the second-largest contributor to the global temperature rise after carbon dioxide (CO2) since 1750, is released into the atmosphere through both human-made and natural sources (Fig. 2). Human-made sources include leaks from coal mines, oil and natural gas (ONG) wells, and pipelines, as well as emissions from landfills & rice paddies (bubbles up when organic matter rots), cattle digestive systems and from the manure piles they leave behind (known by enteric fermentation and manure management (ENF-MNM)). Natural exchanges include wetlands, termites, and mud volcanoes. Despite the abundance of CH4 in the atmosphere as of 2020 is only 0.4% of CO2, it is significantly more potent in trapping heat (more than 80 times of CO2 in the first 20 years after its release), making it a major concern for climate change mitigation efforts. Reducing CH4 emissions is crucial for mitigating short-term warming, as it has a shorter atmospheric lifespan compared to that of CO2. Therefore, mitigating CH4 emissions is now gaining traction in the political arena with initiatives like the Global Methane Pledge※1, launched at the United Nations Climate Change Conference (COP26) in Glasgow in 2021. To effectively reduce CH4 accumulation in the atmosphere, it is essential to understand how emissions from various sources respond to human activities and climate dynamics. While emission inventories offer detailed information on CH4 emissions, there are discrepancies in each estimate, necessitating precise scientific verification to support policy decisions.
4. Outcome
In this study, we utilized atmospheric CH4 isotope ratios (δ13C-CH4) (Fig. 1) to track “footprint” information of different emission sectors. We incorporated δ13C-CH4 in addition to CH4 into the global atmospheric chemical transport model MIROC-ACTM, and conducted their long-term simulations over the past 30 years using emission source distributions from two major emission inventories (EDGARv6 and GAINSv4) and the simulation results were compared to observations operated by various institutions (Tohoku University, the National Institute of Polar Research (NIPR), and Institute of Arctic and Alpine Research (INSTAAR)) with model results.
The study robustly proposed trends of fossil fuel and microbial emissions consistent with the atmospheric observations of CH4 and its isotopes. We round a marked reduction in fossil fuel CH4 emissions from the 1990s to the early 2000s, followed by a period of stabilization (Fig. 3a, thick red line). This stable trend is largely attributed to reduced emissions from oil and natural gas in specific regions, offsetting increases from coal mining, particularly in China during the 2000s (Fig. 3b, thick pink and light blue lines). Additionally, the study highlights a 46 Tg increase in CH4 emissions from microbial sources during 1990–2020, with landfills (40%) and agriculture farming (34%) being the major contributors (Fig. 3a, thick dark blue line). Wetland emissions also played a remarkable role in year-to-year fluctuations but constituted a smaller portion (16%) of the overall emission increase (Fig. 4).
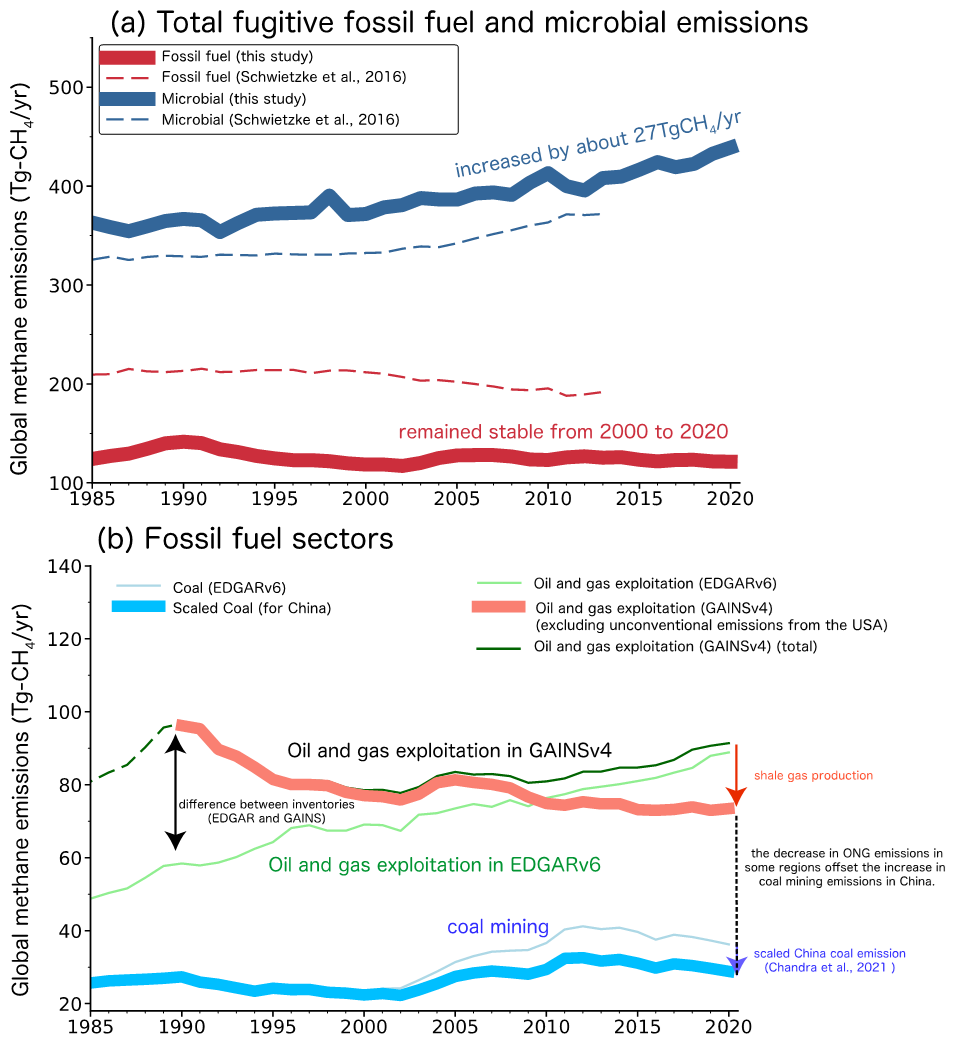
Figure 3. Panel (a) displays the changes in global methane (CH4) emissions from microbial (blue thick line) and fossil fuel exploitation sources (red thick line), suggested by this study. The estimated results of a previous study are also shown (dashed lines). Panel (b) shows changes in CH4 emissions from fossil fuel exploitation from existing inventories and sensitivity experiments. Based on previous inverse analysis studies (Chandra et al. 2021), China's coal-related emissions from 2000 to 2020 (blue line) are adjusted. Various model experiments in this study showed that the combination of the bold emission lines best reproduced the observed variations in CH4 concentration and stable carbon isotope ratio.
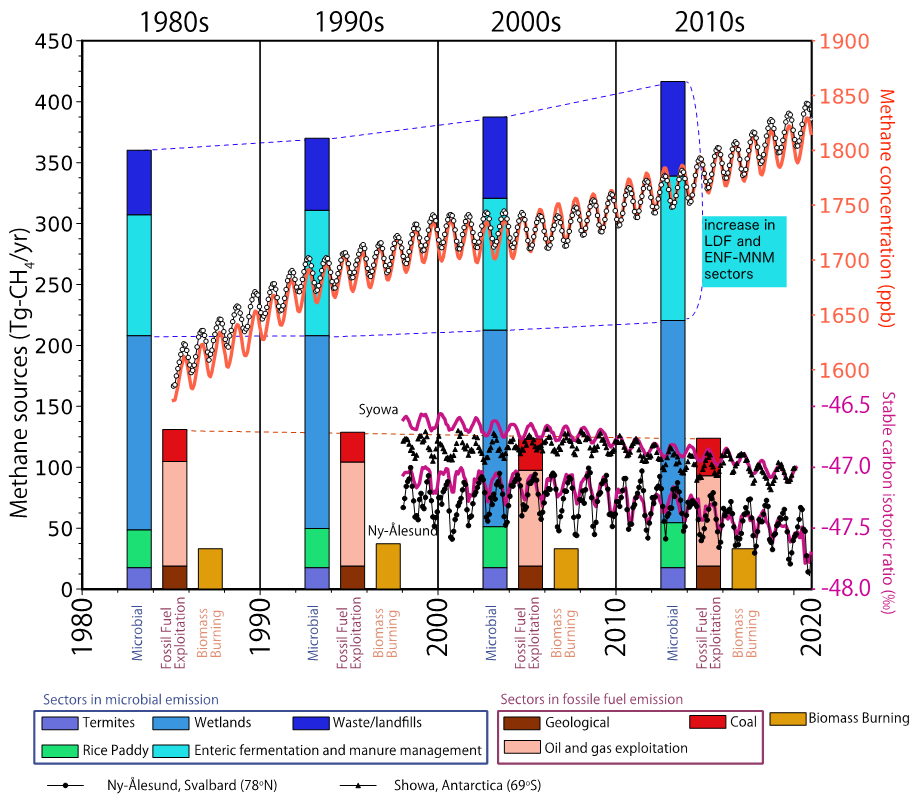
Figure 4. Attributing the drivers of the global CH4 and δ13C-CH4 trends to different emission sectors at 10-year intervals. The simulations and corresponding emissions are plotted for three subcategories i.e., Microbial, Fossil Fuel and Biomass burning based on the most plausible emission scenario of this study. The δ13C-CH4 observations at the North (▲ Ny‐Ålesund, Svalbard) and South (● Syowa, Antarctica) Poles, operated by Tohoku University (TU) and National Institute of Polar Research (NIPR), are shown for the comparison with model simulations (purple line).
5. Outlook
Contrary to emission inventories ordinarily used for policy decisions, our findings support neither the reported increasing emissions from oil and natural gas during 1990–2020 nor the large increase in CH4 emissions from shale gas extraction in the USA since 2006. In contrast, microbial emissions showed a remarkable increase from 1990s to 2010s, which is attributed to waste landfill and agriculture farming. This highlights importance of further mitigation measures in these sectors to achieve CH4 emission reductions. These findings are expected to help in achieving the objectives of the Global Methane Pledge by enhancing our understanding of the past emission trends and informing future mitigation strategies.
For this study
Prabir K. Patra, Principal Researcher, Research Institute for Global Change (RIGC), Earth Surface System Research Center (ESS), Environmental Geochemical Cycle Research Group, JAMSTEC
Shinji Morimoto
Department of Geophysics, Graduate School of Science, Tohoku University
Ryo Fujita, Researcher
Japan Meteorological Agency
Meteorological Research Institute
Department of Climate and Geochemistry Research
The Third Laboratory
For press release
Press Office, Marine Science and Technology Strategy Department, JAMSTEC
Office for Public Relation and Outreach
Graduate School of Science and Faculty of Science, Tohoku University
Japan Meteorological Agency
Meteorological Research Institute
Office of Planning
Planning Division, Public Relations Office
National Institute for Environmental Studies
National Institute of Polar Research
Public Relations Section