Role of anthropogenic forcing in Antarctic sea ice variability revealed
1. Key points
Antarctic sea ice increased slightly from 1979 to 2015, but declined abruptly in 2016 and has since reached record lows. However, the impact of climate radiative forcing※1 associated with anthropogenic greenhouse gases on Antarctic sea ice variability is not fully understood.
A series of experiments using atmosphere-ocean coupled models※2 demonstrate that Antarctic sea ice extent will decrease with increasing greenhouse gas radiative forcing until 2100.
If we take mitigation measures in 2030 or 2040, Antarctic sea ice extent will increase (recover) until 2100.
With a constant radiative forcing, Antarctic sea ice extent undergoes interannual variations under the influence of Southern Ocean deep convection.
With increasing radiative forcing, Southern Ocean deep convection will weaken so that atmospheric variability (Southern Annular Mode※3) will play a more prominent role in Antarctic sea ice variability.
Radiative forcing
The change in the balance of radiative energy (Wm-2) caused by a change in greenhouse gases or other factors. As greenhouse gases (such as carbon dioxide and methane) increase, radiative forcing tends to increase.
Atmosphere-ocean coupled model
A set of numerical programs that represent the physical processes of the atmosphere, ocean, and sea ice. It is widely used for climate process and prediction studies. In this study, we used SPEAR_MED model developed at NOAA/GFDL with varying anthropogenic radiative forcing from 1921 to 2100. SPEAR_MED model has a horizontal resolution of 50 km for the atmosphere and a resolution of 100 km for the ocean.
Southern Annular Mode (SAM)
An atmospheric phenomenon in the mid-high latitudes of the Southern Hemisphere. When a positive SAM occurs, anticyclonic circulation at mid-latitudes and cyclonic circulation at high latitudes are strengthened, resulting in stronger westerlies. A phenomenon with the opposite sign is called a negative SAM.
2. Abstract
Dr. Yushi Morioka of the Japan Agency for Marine-Earth Science and Technology (JAMSTEC; President, Hiroyuki Yamato) and his colleagues conducted a series of experiments using atmosphere-ocean coupled models with varying radiative forcings from anthropogenic greenhouse gases until 2100. They find that Antarctic sea ice extent will decrease with increasing radiative forcing, but that deep-convention in the Southern Ocean will weaken so that atmospheric variability, the Southern Annular Mode, will play a more prominent role in Antarctic sea ice variability.
An accurate understanding of Antarctic sea ice is important to our society, because it is linked to changes in the Antarctic ice sheet that affect the regional climate and global sea level. Unlike Arctic sea ice which continues to decline due to global warming, Antarctic sea ice extent increased slightly from 1979 to 2015. However, it declined sharply in 2016, and since then, the sea ice extent has continued to decline at record rates. Natural variability such as atmospheric winds and ocean heat transport are thought to be the main driver of sea ice extent increase and decrease. However, the role of radiative forcing from anthropogenic greenhouse gases in Antarctic sea ice variability is not fully understood.
In this study, we employed atmosphere-ocean coupled models to investigate the influence of radiative forcing on Antarctic sea ice variability. The model experiments demonstrate that as radiative forcing from greenhouse gases increases until 2100, Antarctic sea ice extent will decrease. On the other hand, as radiative forcing from greenhouse gases decreases from 2030 or 2040, Antarctic sea ice extent will increase (recover) until 2100. If the radiative forcing from greenhouse gases is held constant at the 1921 level, Antarctic sea ice extent will be subject to interannual variations due to deep convection in Southern Ocean. However, if the radiative forcing from greenhouse gases increases, the deep convection will weaken so that atmospheric variability (Southern Annular Mode) plays a more prominent role in Antarctic sea ice variability.
These results not only reveal the impact of radiative forcing from anthropogenic greenhouse gases on Antarctic sea ice variability, but also suggest the effectiveness of climate mitigation measures. In the future, we plan to investigate the relative roles of different greenhouse gases in Antarctic sea ice variability.
This work was partly supported by the Princeton University and NOAA/GFDL Visiting Research Scientists Program and base support of GFDL from NOAA office of Oceanic and Atmospheric Research (OAR), JAMSTEC Overseas Research Visit Program, and JSPS Grant-in-Aid for Scientific Research JP22K03727.
Yushi Morioka1, Liping Zhang2,3, William Cooke2, Masami Nonaka1, Swadhin K. Behera1, Syukuro Manabe4
2. National Oceanic and Atmospheric Administration, Geophysical Fluid Dynamics Laboratory (NOAA/GFDL)
3. University Corporation for Atmospheric Research (UCAR)
4. Atmospheric and Oceanic Sciences Program, Princeton University (Princeton University/AOS)
3. Background
Antarctic sea ice plays an important role in the exchange of heat, water, and gases between the atmosphere and the ocean. Antarctic sea ice variability is also linked to Antarctic ice sheet variability that affects regional climate and global sea level. Unlike Arctic sea ice extent, which has been steadily decreasing due to global warming, Antarctic sea ice extent is reported to increase from 1979, with the advent of satellite observations, until 2015. However, it declined abruptly in 2016, and since then, Antarctic sea ice extent has remained at record low levels.
It is reported that the increase in Antarctic sea ice extent over the past few decades is mainly related to remote atmospheric teleconnection from the tropical Pacific on a decadal timescale (Meehl et al. 2016). It is also suggested that the abrupt decline in Antarctic sea ice extent in 2016 is mainly related to one of the strongest El Niño-Southern Oscillation (ENSO) in 2015 and the negative SAM in 2016 (Stuecker et al. 2017). Furthermore, it is discussed that the persistent sea ice decrease after 2016 is mainly related to the subsurface (100-500 m) warming of the Southern Ocean (Zhang et al. 2022). Our recent work demonstrates that Antarctic sea ice extent fluctuates with a period of 80-100 years under the influence of Southern Ocean deep convection (Morioka et al. 2024; press release on November 8, 2024), suggesting that the observed sea ice fluctuations are a part of long-term variability.
Previous studies have concluded that the observed sea ice fluctuation is part of natural variability, but these studies have not fully examined the effect of greenhouse gases on Antarctic sea ice variability. It is already reported that Antarctic sea ice extent will decrease when greenhouse gases increase (Roach et al. 2020), but it is not clear how Antarctic sea ice will fluctuate in the future. In this study, we investigate the effect of greenhouse gases on Antarctic sea ice variability using atmosphere-ocean coupled models by conducting a series of experiments in which the radiative forcing from anthropogenic greenhouse gases is varied under different future scenarios.
4. Results
Figure 1 shows Antarctic sea ice extent deviation and the concentration of carbon dioxide from 1921 to 2100. Here, the natural forcing run is an experiment in which the radiative forcing from anthropogenic greenhouse gases is held constant at the 1921 levels. The historical forcing run is an experiment in which the radiative forcing from anthropogenic greenhouse gases observed during 1921-2014 is applied. In addition, the SSP forcing runs correspond to experiments in which the radiative forcing from anthropogenic greenhouse gases is applied based on future emission scenarios.
Observations show that Antarctic sea ice extent increases from 1979 to 2015 and then decreases rapidly. The increase in the sea ice extent is captured by the natural forcing run. This indicates that the increase in the sea ice extent is mainly driven by natural variability. On the other hand, the historical forcing run captures the recent sea ice decline. This suggests that the increase in greenhouse gases may also be responsible for the recent sea ice decline.
The SSP585 forcing run based on a high emission scenario shows a significant decrease in the sea ice extent from 2015 onwards. A similar trend can be seen in the SSP245 forcing run based on a medium emission scenario. On the other hand, the SSP534OS_10ye and SSP534OS forcing runs, in which climate mitigation measures are taken over a 30-year period from 2030 or 2040 until radiative forcing from anthropogenic greenhouse gases reaches zero, show a sea ice recovery (increase) until 2100. All experiments agree well with changes in the main greenhouse gas, carbon dioxide.
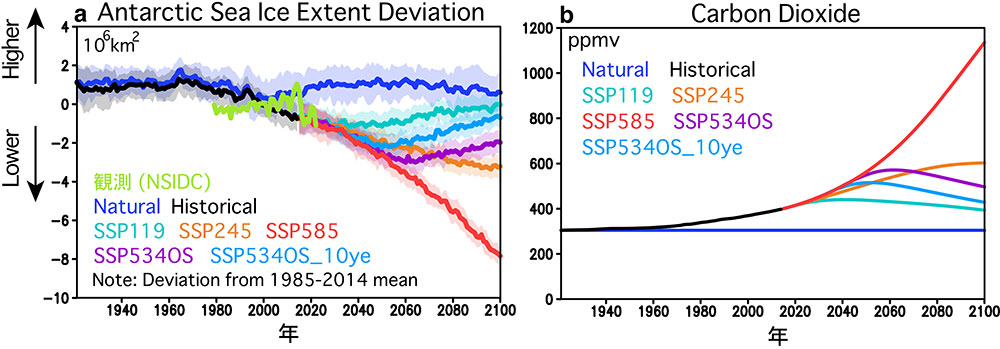
Figure 1. a. Antarctic sea ice extent deviation during 1921-2100 (in 106 km2). Here, deviation is defined as the difference from the mean value over 1985-2014. The green line is the observed data for 1979-2022, the blue line is the natural forcing run of the atmosphere-ocean coupled model (SPEAR_MED), the black line is the historical forcing run, and the other colored lines are the future projection runs (SSP119, SSP245, SSP585, SSP534OS, SSP534OS_10ye). All experiments were conducted from 30 different initial values (30 ensemble members), and the ensemble mean is shown by the bold line and the standard deviation by the light shade. b. Carbon dioxide concentration (in ppmv, million fractions) used in the model experiments for 1921-2100. The SSP119 run is based on a low emission scenario, the SSP245 run on a medium emission scenario, and the SSP585 run on a high emission scenario, respectively. The SSP534OS run is the same as the SSP585 run until 2040, but emissions are reduced to a mitigation scenario in which the radiative forcing from greenhouse gases is zero in 2070. The SSP534OS_10ye run reduces emissions 10 years earlier than the SSP534OS run.
Figure 2 shows the changes in sea ice concentration and zonal-mean ocean temperature (2081-2100 minus 2061-2080). The SSP585 forcing run shows a significant decrease in sea ice concentration in all regions, while the SSP534OS_10yr forcing run shows a significant increase in sea ice concentration in the Pacific and Atlantic sectors. Regarding the zonal-mean ocean temperature change, the SSP585 forcing run shows a significant increase in ocean temperature in the Antarctic Sea (south of 60°S) from the surface to a depth of 2,000 meters. This indicates that the heat absorbed by the ocean from the atmosphere is transported to the deeper ocean. On the other hand, the SSP534OS_10ye forcing run shows a significant decrease in the near-surface ocean temperature, corresponding to an increase in sea ice. In addition, there is a significant increase in ocean temperature at depths below 1,000 m. This indicates that heat absorbed by the ocean from the atmosphere is retained in the deeper ocean. These results suggest that the deep ocean circulation associated with deep convection will weaken in the Antarctic Sea and that the reduction in radiative forcing from greenhouse gases will not affect the deeper ocean.
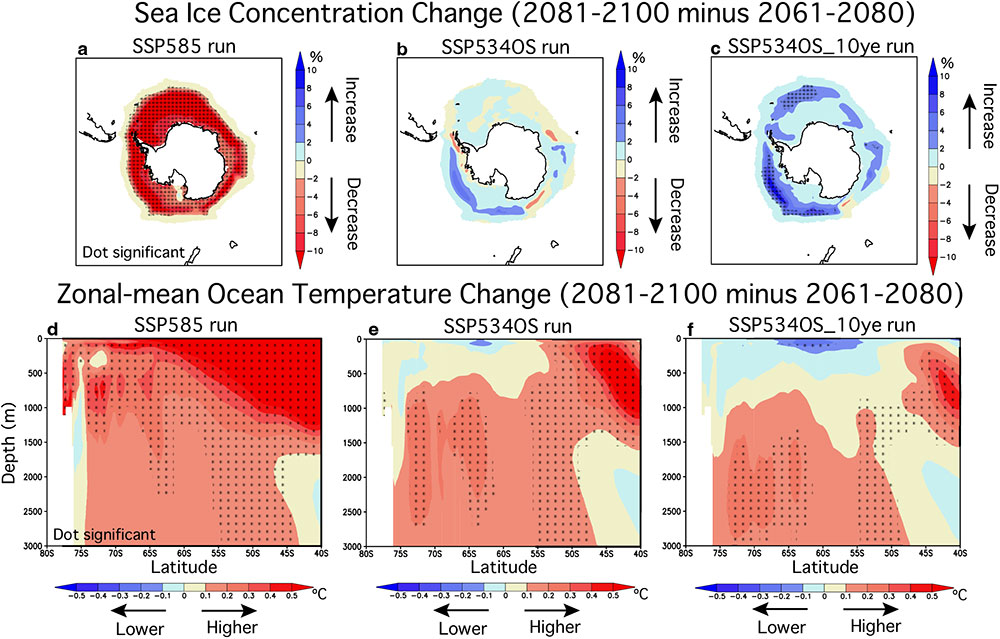
Figure 2 a-c. Changes in sea ice concentration (in %; 2081-2100 minus 2061-2080) for the SSP585, SSP534OS, and SSP534OS_10yr forcing runs of the atmosphere-ocean coupled model (SPEAR_MED). Dots represent statistically significant changes at 90% confidence level. d-f. Same as in a-c, but for the change in zonal-mean ocean temperature (in ºC). The horizontal axis represents latitude, while the vertical axis represents ocean depth.
In order to examine the relationship between Antarctic sea ice extent variability and climate indicators, we calculated correlation coefficients※4 with the strength of the Antarctic lower cell, the Antarctic mixed layer depth (a uniform density layer in the ocean surface layer at depths shallower than 200 m), the SAM index, and the NINO 3.4 index (Table 1). In the natural forcing run, the correlation between sea ice extent and lower cell strength or mixed layer depth is found to be negatively large and statistically significant. This suggests that when deep ocean circulation is strong in the Antarctic Sea, deep convection intensifies to bring warm and high-salinity subsurface water (at depths greater than 200 m) into the surface layer. This causes the mixed layer to deepen and sea ice to melt (Morioka et al. 2024; press release on November 8, 2024).
On the other hand, in the historical, SSP585, and SSP534OS forcing runs, the correlation with the lower cell strength gets smaller and the correlation with the mixed layer depth and the SAM index gets positively larger. This suggests that when the SAM is in a positive phase, the westerlies strengthen and the northward ocean heat transport (※5: Ekman heat transport) is enhanced due to the effect of the Earth's rotation. This results in lower ocean temperature, deeper mixed layer, and increased sea ice. On the other hand, an increase in radiative forcing from greenhouse gases weakens the deep ocean circulation associated with deep convection in the Antarctic Sea. This indicates that the effect of the deep circulation will weaken under the global warming.
Correlation coefficient
The strength of the connection (relationship) between two variables (e.g., x and y). Note that it does not represent a causal relationship. The correlation coefficient varies from -1 to 1. When the correlation coefficient is positive, the two variables (x and y) tend to vary with the same sign (e.g., in a positive direction).
Ekman heat transport
When wind blows at sea, the effect of the Earth's rotation (the Coriolis force) and the viscosity of the oceans causes an ocean current (the Ekman current) in the surface layer (shallow than about 50 meters) to the right of the wind direction in the Northern Hemisphere and to the left in the Southern Hemisphere while carrying heat in the upper ocean.
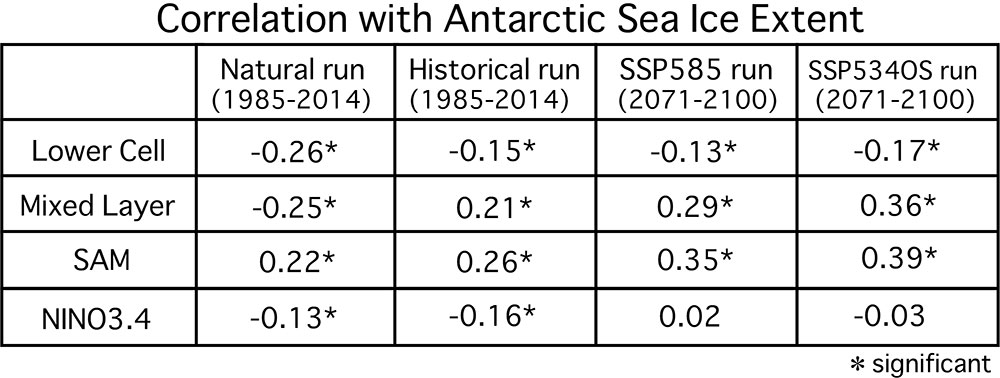
Table 1: Correlation coefficients between Antarctic sea ice extent and climate indicators from the atmosphere-ocean coupled model (SPEAR_MED) experiments. The indicators are the strength of the Antarctic lower cell, the mixed layer depth (a layer of uniform density in the ocean surface layer), the Southern Annular Mode (SAM) index, and the ENSO (NINO 3.4) index. We used the natural and historical runs from 1985-2014, while we used the SSP585 and SSP534OS runs from 2071-2100. It should be noted that we calculated correlation coefficients for 30 ensemble members over the 30-yr period. The asterisk indicates a statistically significant correlation at 99% confidence level.
To further investigate the ocean influence on the Antarctic sea ice extent variability, we calculated the regression coefficient※6 of zonal-mean ocean temperature onto the sea ice extent (Figure 3). In the natural forcing run, when sea ice extent increases, the near-surface ocean temperature decreases, while the subsurface (shallower than 200m) ocean temperature increases. This indicates that the deep ocean circulation associated with deep convection weakens so that warm and high-salinity subsurface water is less likely to affect the surface layer. On the other hand, the historical, SSP585, and SSP534OS forcing runs show that when sea ice increases, the near-surface ocean temperature decreases, but the subsurface (shallower than 200 m) ocean temperature does not increase as much as in the natural forcing run. This suggests that processes in the surface layer are more involved with sea ice increase than the deeper ocean.
Regression coefficient
The degree to which the one variable (y) changes when other variable (x) changes in a positive direction. Note that it does not represent a causal relationship.
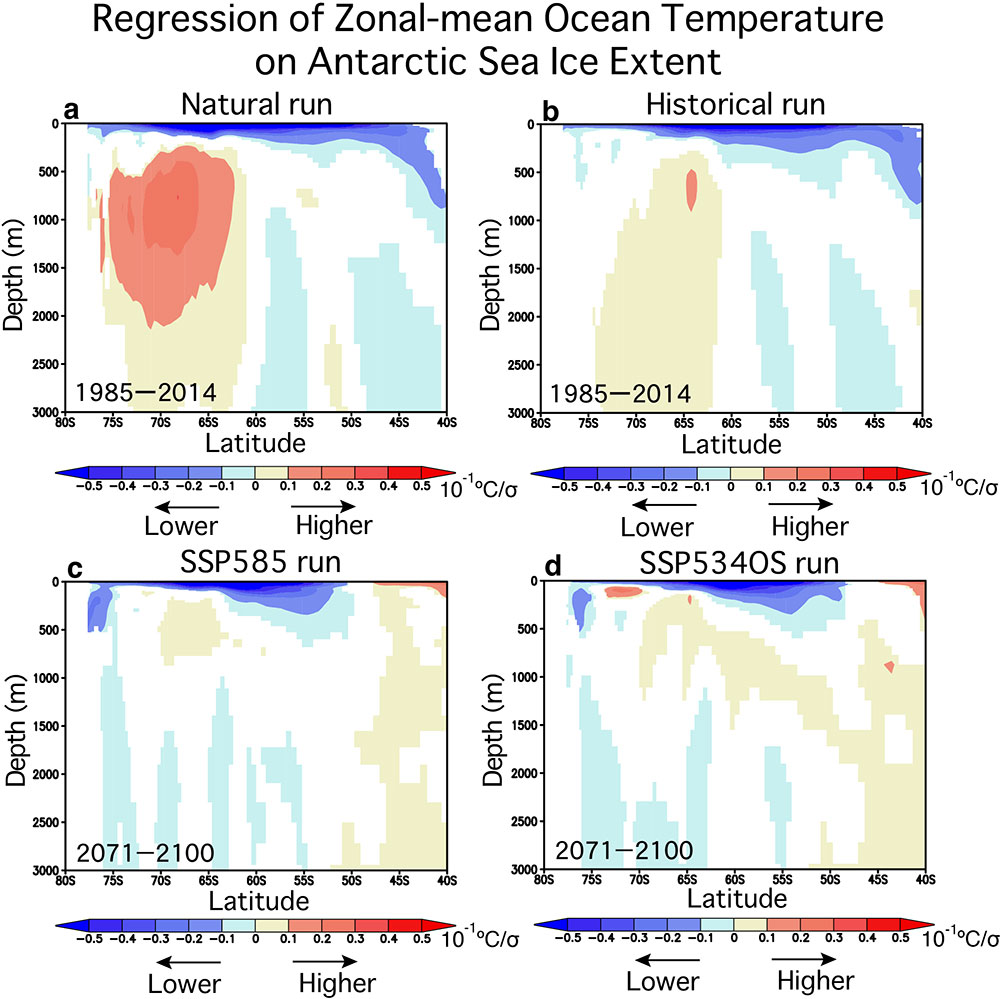
Figure 3 a-b. Regression coefficients of zonal-mean ocean temperature onto Antarctic sea ice extent (in 10-1 ºC/σ) using results from the natural and historical forcing runs of the atmosphere-ocean coupled model (SPEAR_MED). Regression coefficients represent how much ocean temperature changes when sea ice extent increases by one standard deviation (σ). We used the results for 1985-2014, and a color represents a statistically significant regression coefficient at 99% confidence level. c-d. Same as in a-b, but for the results from the SSP585 and SSP534OS forcing runs for 2071-2100.
Finally, to investigate the effect of the atmosphere on the Antarctic sea ice extent variability, we calculated the regression coefficient of sea level pressure on sea ice extent (Figure 4). In the natural forcing run, when sea ice increases, an anticyclonic circulation with a wavenumber three structure is seen in the mid-latitudes of the Southern Hemisphere, and a cyclonic circulation in the high latitudes. This indicates that the westerlies strengthen and the northward ocean heat transport (Ekman transport) is enhanced due to the effect of the Earth’s rotation, resulting in lower ocean temperatures. In addition to the positiv SAM, the stronger westerlies are also related to the remote influence of the atmospheric teleconnection※7 associated with La Niña in the tropical Pacific. On the other hand, the historical, SSP585 and SSP534OS forcing runs show an anticyclonic circulation with a wavenumber two structure at mid-latitudes and a cyclonic circulation at high latitudes in the Southern Hemisphere. This indicates that the positiv SAM is more strongly involved in strengthening the westerlies.
Teleconnection
A statistically significant relationship between physical quantities (such as atmospheric pressure) at two distant locations. A well-known example of atmospheric teleconnection in the Southern Hemisphere is the Pacific-South American (PSA) pattern associated with El Niño and Southern Oscillation.
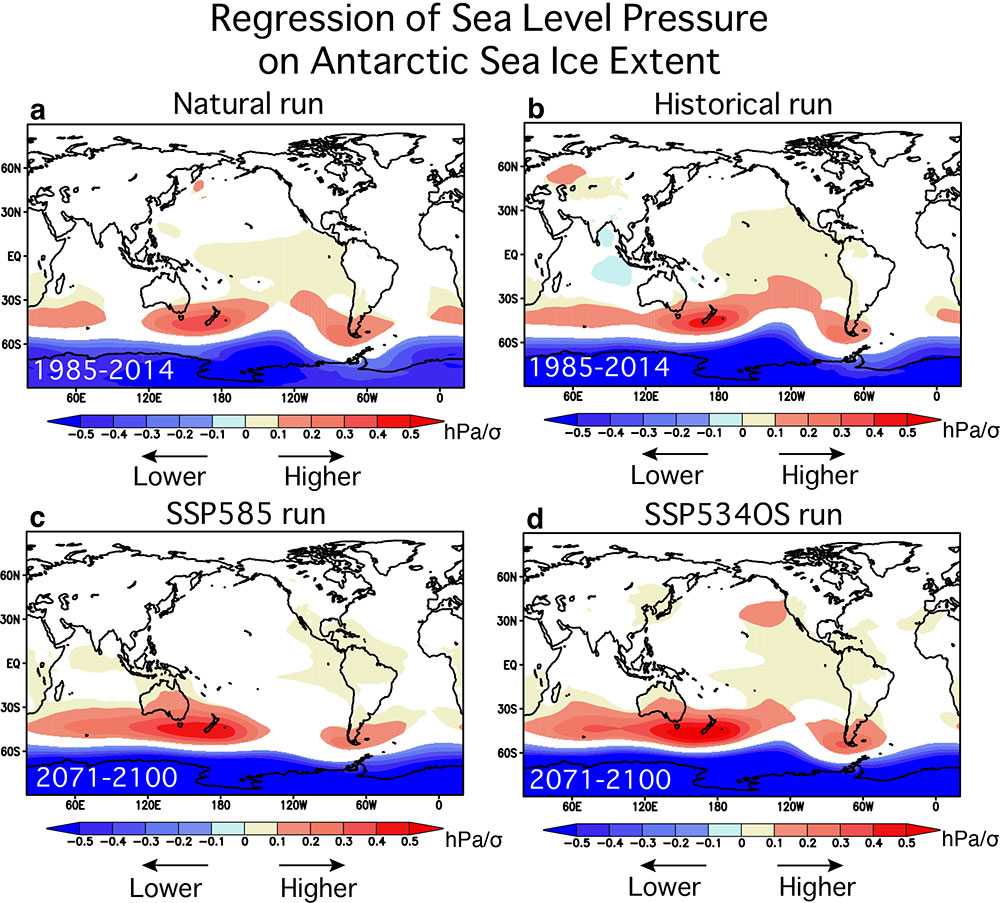
Figure 4 a-b. Regression coefficients of sea-level pressure (in hPa/σ) onto sea ice extent in Antarctica using results from the natural and historical forcing runs of the atmosphere-ocean coupled model (SPEAR_MED). The regression coefficients represent how much sea level pressure changes when sea ice extent increases by one standard deviation (σ). We used the results for 1985-2014, and a color represents a statistically significant regression coefficient at 99% confidence level. c-d. Same as in a-b, but for the results from the SSP585 and SSP534OS runs for 2071-2100.
5. Future Perspectives
In this study, we conducted a series of atmosphere-ocean coupled model experiments with varying radiative forcing from anthropogenic greenhouse gases and demonstrated that Antarctic sea ice extent will be more influenced by atmospheric variability (Southern Annular Mode) as a result of the weakening of the Southern Ocean deep convection (Figure 5). In a warming future climate, the near-surface ocean temperature will increase, while the ocean density will decrease as precipitation increases and ice sheets melt. As a result, the density difference between the surface and subsurface ocean (stratification) will increase, making vertical mixing more difficult. This prompts the surface ocean less susceptible to the subsurface ocean, so that atmospheric variability plays a more prominent role in Antarctic sea ice variability. To better understand and accurately predict sea ice variability in a warming future climate, not only atmospheric variability but also ocean surface layer must be accurately observed and simulated in the models.
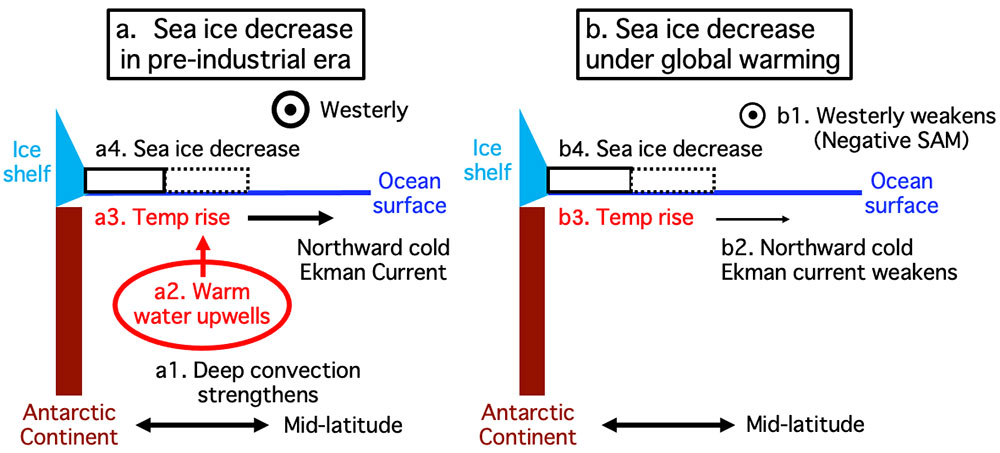
Figure 5: Schematic diagrams on the mechanism of sea ice decrease in the (a) absence and (b) presence of global warming. In the absence of global warming, when deep convection strengthens, warm subsurface water is upwelled to cause an increase in the near-surface ocean temperature, resulting in sea ice decrease. In the presence of global warming, when the westerlies weaken, the cold northward Ekman current weakens, thereby causing the near-surface ocean temperature to rise and sea ice to decrease.
This study also identified that Antarctic sea ice extent will increase (recover) until 2100 when radiative forcing from anthropogenic greenhouse gases is reduced to zero over a 30-year period from 2030 or 2040. As radiative forcing increases, Antarctic sea ice extent will decrease and the Southern Ocean deep convection will weaken. However, as the greenhouse gases gradually decrease after 2030 or 2040, Antarctic sea ice extent will start to increase (recover) under the influence of atmospheric change afterwards. This suggests that climate mitigation measures are effective for Antarctic sea ice recovery.
Finally, this study has focused on anthropogenic greenhouse gases such as carbon dioxide and methane, but Antarctic sea ice extent is also affected by the ozone layer. A previous study demonstrates that the ozone layer in the stratosphere over Antarctica decreased until the 2000s, which strengthened the polar vortex and westerlies, resulting in the increased sea ice extent (Ferreira et al. 2015). However, the ozone layer has been recovering in recent years and may have a limited impact on westerlies and Antarctic sea ice compared to other greenhouse gases. Predicting future Antarctic sea ice requires taking into account emissions of ozone-depleting gases and other greenhouse gases. This study is based on a single scenario in which future emissions of chlorofluorocarbons (CFCs) and other gases will decrease rapidly until 2100. Further studies are needed to clarify the relative roles of various greenhouse gases on Antarctic sea ice variability under different scenarios.
Contact
Japan Agency for Marine-Earth Science and Technology
About this research
Yushi Morioka, Senior Researcher Application Laboratory, Research Institute for Value-Added Information Generation
Press Office