Cruise observation in FY2016
(1) R/V Shinsei-maru (KS-16-8: 2016/7/5~7/13)
Subtropical region in the northwestern Pacific Ocean
Recovery and redeployment of the sediment trap at stn. KEO(2) TS Oshoro-Maru (2016/7/18~7/27)
Northeast region in the Japan sea
Primary productivity observation
(Global warming impacts on biogeochemical change in the Japan Sea)(3) TS Nagasaki-Maru (2016/10/11~10/15)
Southwest region in the Japan sea
Primary productivity observation
(Global warming impacts on biogeochemical change in the Japan Sea)(4) R/V Shinsei-maru (KS-16-19: 2016/11/19~11/29)
Off Fukushima
Recovery of the sediment trap at stn. F1
(Investigation of radionuclides derived from nuclear accident)
Topics
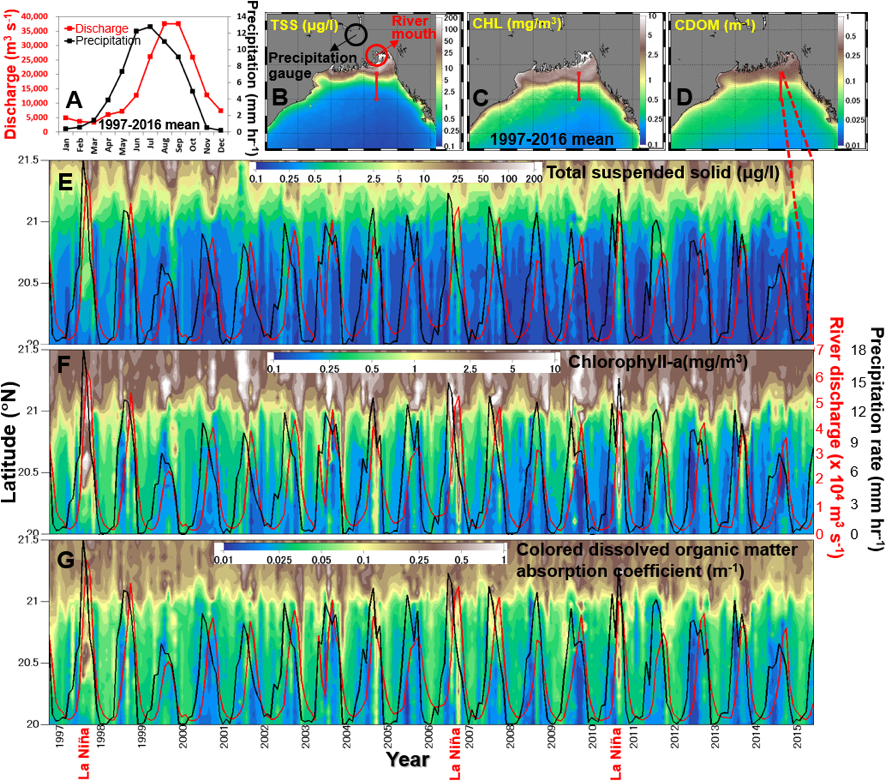
(1) Impacts of River Discharge on the Bay of Bengal Marine Environment
Transported by atmospheric deposition and river discharge, the Bay of Bengal (BoB) largely receives terrigenous materials. This study has been doing to understand how Ganges-Brahmaputra River discharge variability interannually influences ocean-color variables of phytoplankton biomass concentration (CHL), total suspended solid concentration (TSS), and colored dissolved organic matter absorption coefficient (CDOM) in the BoB. CHL, TSS, and CDOM within the period from 1997 to 2016 were assessed using satellite-derived remote sensing reflectance. For the same time-span, satellite-derived precipitation rate and in-situ Ganges-Brahmaputra River discharge were also analyzed. Further southward dispersions of high TSS, CHL, and CDOM can be observed during summer (E, F, G), when both precipitation rate and river discharge reached the highest (A). This indicates during rainy and flooding season, terrigenous suspended sediment, nutrients, and dissolved organic matter were largely supplied by Ganges-Brahmaputra River system to the BoB and widely distributed farther offshore ward. In particular, in summer of the years 1998, 2007, and 2011, further southward distributions of TSS, CHL, and CDOM were more pronounced compared to other years. The years 1998, 2007, and 2011 were La Niña years, and it is well known that summer precipitation in the upstream Ganges-Brahmaputra River basin was anomalously high during La Niña years. This study thus shows a teleconnection linking La Niña event in the tropical Pacific Ocean with the land-ocean interaction in the BoB.
(2)Responses of phytoplankton growth with the addition of aerosol nutrients in the oligotrophic subtropical Ocean
In the subtropical western North Pacific Ocean, nutrients are generally limited for phytoplankton due to the thermal stratification except for a mixing period in winter. Recently, shipboard observations and model simulation showed the supply of nutrients into the sea surface via the aerosol deposition during a stratification period (Fig. 1). Responses of phytoplankton growth with the addition of aerosol extract (PM2.5) were observed by the incubation experiments. The experiments were conducted by using the surface water which was taken at the subtropical western North Pacific Ocean in summer, and aerosols which were taken at Yokosuka. Although the growth of phytoplankton was not recognized with the simple addition of aerosol extract (Fig. 2: case 1), phytoplankton increased significantly with the supplemental addition of phosphorus (Fig. 2: case 2, 3, 5). Experimental results showed that the aerosol depositions supplied the nutrients of nitrogen and iron, but not of phosphorus. Both nutrients of nitrogen and phosphorus are completely depletion at the surface in summer, but our shipboard observations showed that nitrogen will be depleted earlier than phosphorus during spring. A supply of nitrogen nutrient via the aerosol deposition will contribute efficiently to the phytoplankton growth in spring, since the phosphorus nutrient is possibly remaining at the surface. The analyses of principal component and seasonal variation of aerosol deposition are currently in progress to estimate the impact of aerosol nutrients into the subtropical western North Pacific Ocean.
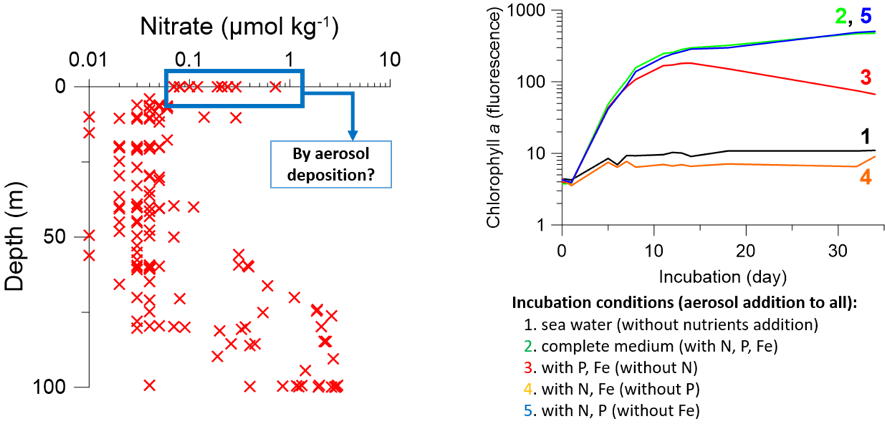
Fig. 2 (right panel): Growth experiments of phytoplankton with addition of aerosol extract in the variety of nutrient mediums.
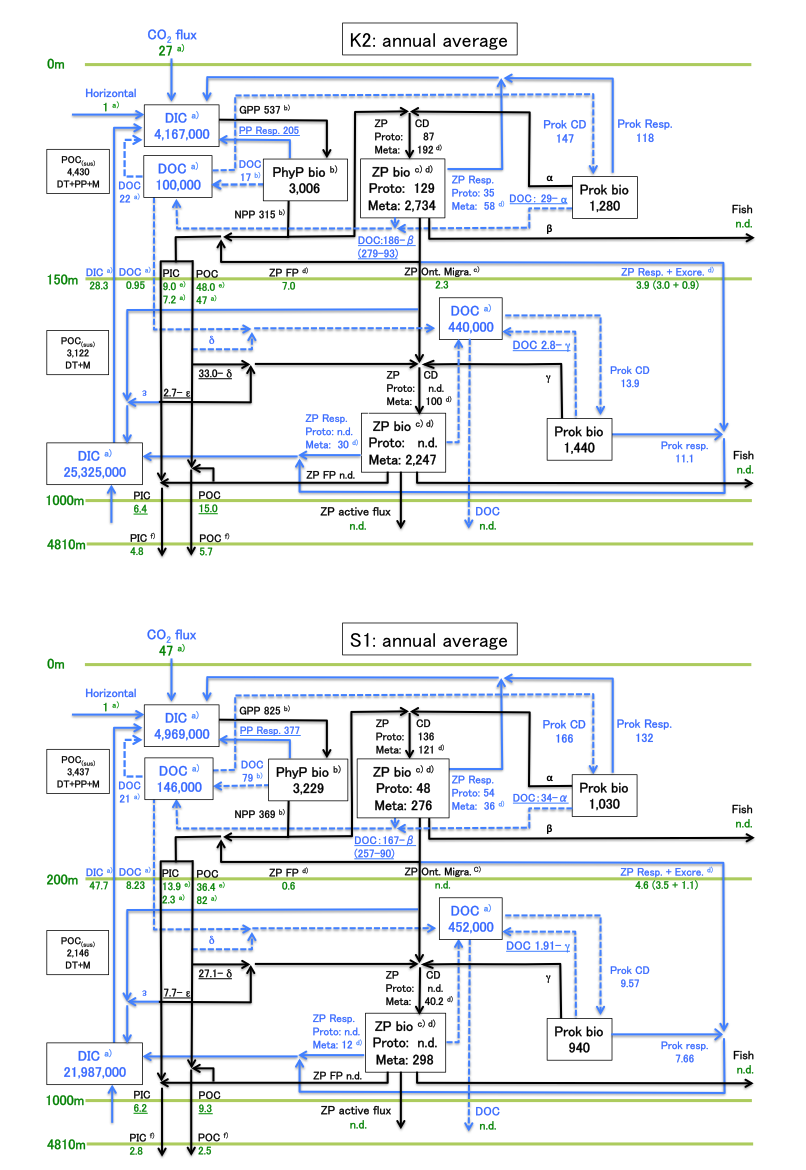
(3)Carbon budget at the Western Pacific subarctic station (K2) and subtropical station (S1) based on time-series biological and biogeochemical observation
It is well known that the North Pacific Western Subarctic Gyre (WSG) is a terminal area of deep sea water circulation and is therefore rich in nutrients, the result being that the area is highly productive. However, changes in the physics and chemistry of the ocean such as warming, stratification, hypoxia and acidification (multiple stressors) might change the ecosystem and biological pump in the western North Pacific. To collect essential baseline data about this ecosystem and its biological pump to facilitate predictions of changes of material cycles via biological activity, a comparative study of the ecosystem and its biogeochemistry was planned at time-series stations set in the subarctic (station K2: 47°N / 160°E) and subtropics (station S1: 30°N / 145°E). These two regions are characterized by different physical, chemical, and biological oceanography and are subjected to diverse allochthonous forcing, including seasonal monsoons, mesoscale eddies, and eolian inputs. Between 2010-2013, this time-series study entitled “Study of Change in Ecosystem and Material Cycles Caused by Climate Change and its Feedback: K2S1 Project” was conducted with seasonal scientific cruises of the R/V Mirai, time-series observations made with a mooring system, satellite data analysis, and numerical simulations. Details are provided mainly in papers in the Journal of Oceanography special issue “K2S1 project” [Honda M. C., K. Matsumoto, E. Siswanto et al. Journal of Oceanography, DOI: 10.1007/s10872-017-0423-3 (2017).]. As a result of “K2S1 project”, the carbon budget at both stations can be summarized as follow:
- Both of stations K2 and S1 are sink of atmospheric CO2. But uptake rate of CO2 at S1 is about 1.7 times higher than that at K2.
- Although concentration of nutrient at S1 in the upper layer is very low all year round and significantly lower than that at K2, primary productivity including dissolved organic carbon production at S1 is higher than that at K2.
- Biomass of zooplankton (Metazoan) and carbon export flux as fecal pellet at K2 are one order higher than those at S1. However there is not difference in carbon demand and carbon export flux by respiration and excretion of diurnally-migrated zooplankton between both stations. In addition, there is not big difference in abundance and carbon demand of Prokaryote between both stations either.
- Although particulate organic carbon (POC) flux at bottom of surface mixed layer are comparable at both stations, POC flux at K2 becomes significantly higher than that at S1 as water depth increases.