4.1 Results FY2011
4.1.1. Role of aerosol in biological pump
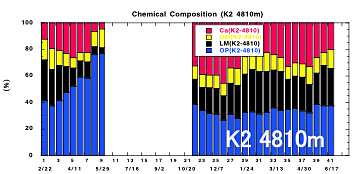
In June and July 2011, sediment trap mooring systems at time series stations K2 and S1 were successfully recovered, having been deployed in February 2010. Settled material samples were analyzed for biogenic (organic materials, biogenic opal, and CaCO3) and lithogenic content. Lithogenic materials in particles collected at 5000 m accounted for approximately 20% of the total particulate mass collected at both stations.

4.1.2. Spatial and temporal variability in atmospheric aerosol transport and deposition
Atmospheric aerosols and ocean water column properties were investigated during two research cruises, MR11-03 and 11-05. Aerosol chemical analysis included sulfate, nitrate, V, Fe and other trace metals for both coarse and fine mode samples. The WIBS4 instrument was determined to be capable of detecting dust particles separately from spherical particles by using shape information.
4.1.3. Understanding variability in aerosol supply
4.1.3.1 Temporal and special variability derived from satellite data
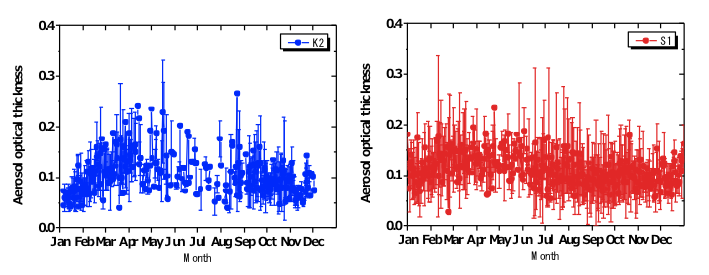
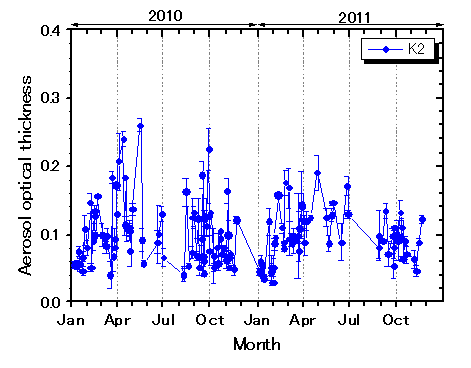
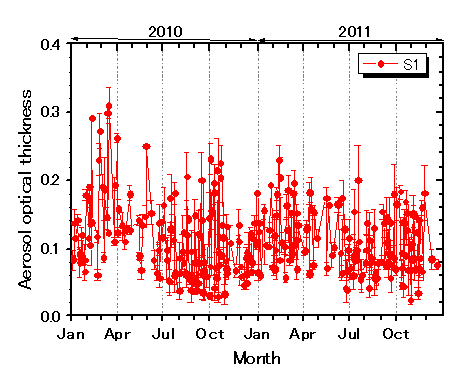
Temporal and spatial variability of aerosol distribution around time series stations K2 and S1 from 2002 to 2011 were derived from MODIS data (9-km spatial and daily temporal resolution), obtained from the National Atmospheric and Space Administration. To investigate the relationships between phytoplankton distribution and ocean physical conditions around both stations, multi-sensor satellite data were analyzed for ocean color, sea surface temperature, solar radiation, and sea level height. Seasonal variability of aerosol optical thickness (AOT) at K2 and S1 are similar and the increase in spring and fall AOT is similar to observed seasonal trends in chlorophyll concentration (Fig. 6). AOT in 2010 tends to be higher than in 2011 at both time series stations (Fig. 7). This is most evident at S1 in February and March and at K2 during the spring and fall months. Comparing these results with simulation forecasts of aeolian dust diffusion reported by the Japan Meteorological Agency, the AOT increase was not as evident.
4.1.3.2 Aerosol transport model development
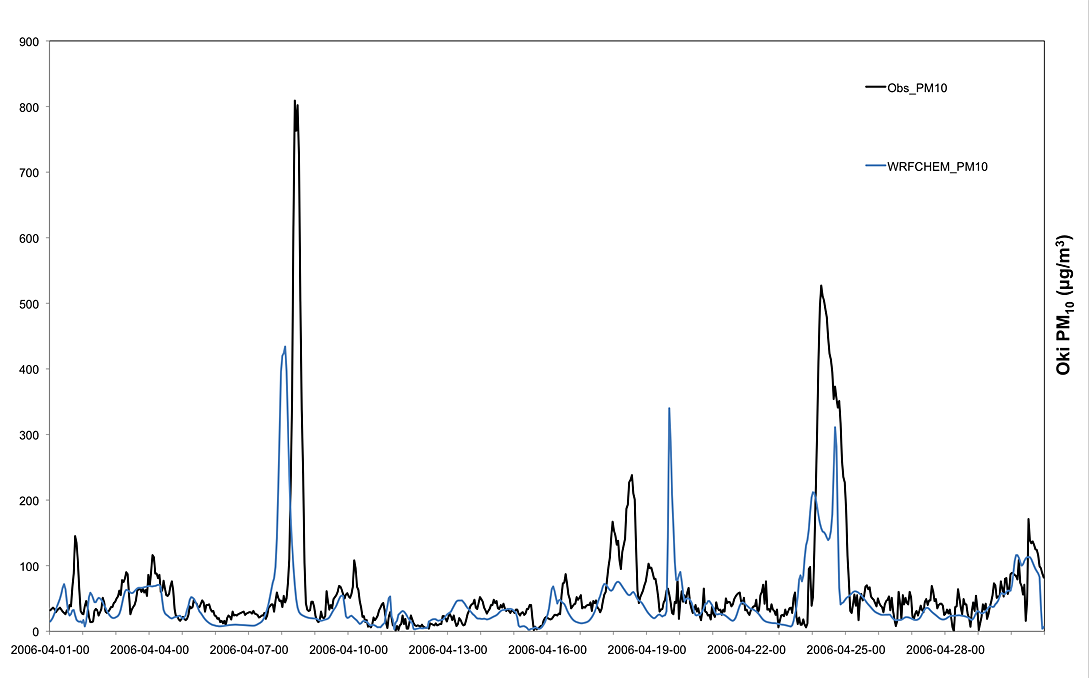
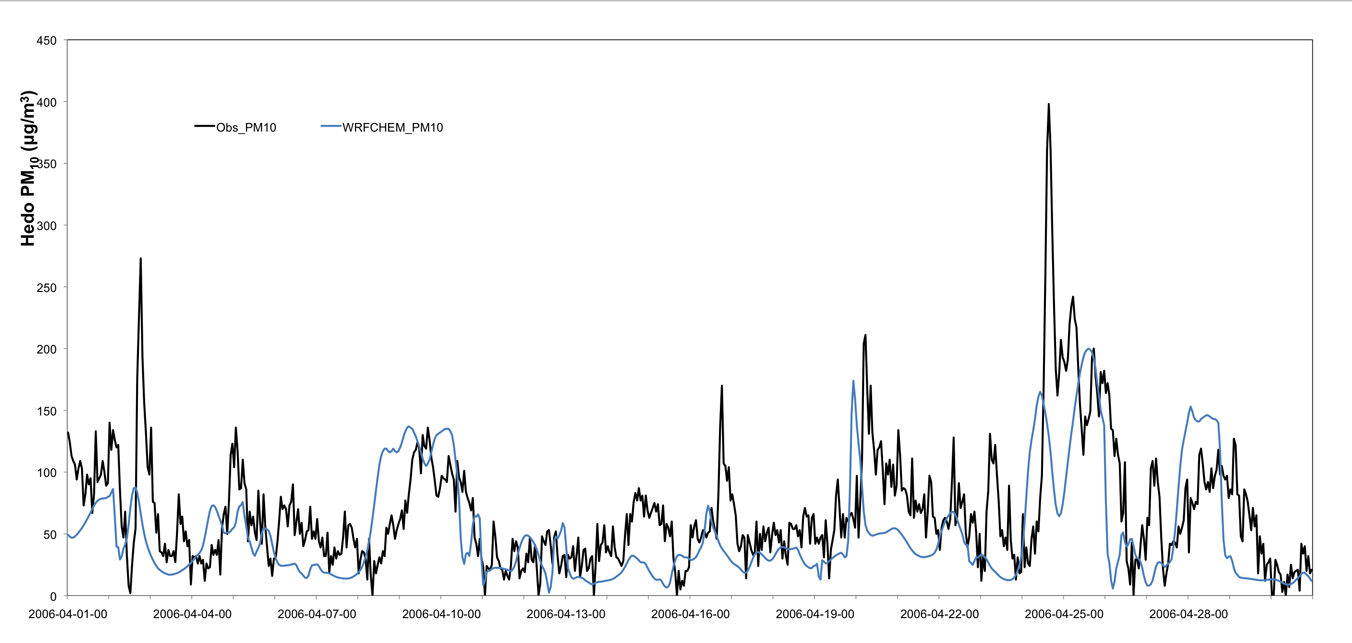
A regional chemical transport model (WRF/Chem) was modified to estimate the transport and deposition of natural and anthropogenic aerosols over East Asia. Numerical simulations were conducted and compared with observed meteorological fields derived from ground-based and radiosonde measurements, wind profiles, and satellite observations, compiled as the NCEP Global Upper Air and Surface Weather Observations (NCEP ds.337; http://rda.ucar.edu/datasets/ds337.0/). In addition, a biogenic emission flux estimation capability was added to the model based on the Model of Emissions of Gases and Aerosols from Nature framework (MEGAN 2.1; Guenther et al., Geosci. Model Dev. Discuss., 5, 2012), which can estimate the flux of volatile organic carbons released from vegetation by using radiation, humidity, and temperature calculated in the model. The flux of mineral dust is calculated by using soil moisture, soil type, and surface wind derived in the model. Emissions from biomass burning are estimated based on hotspot distributions observed in MODIS imagery. The simulations include both direct and indirect effects of aerosols.
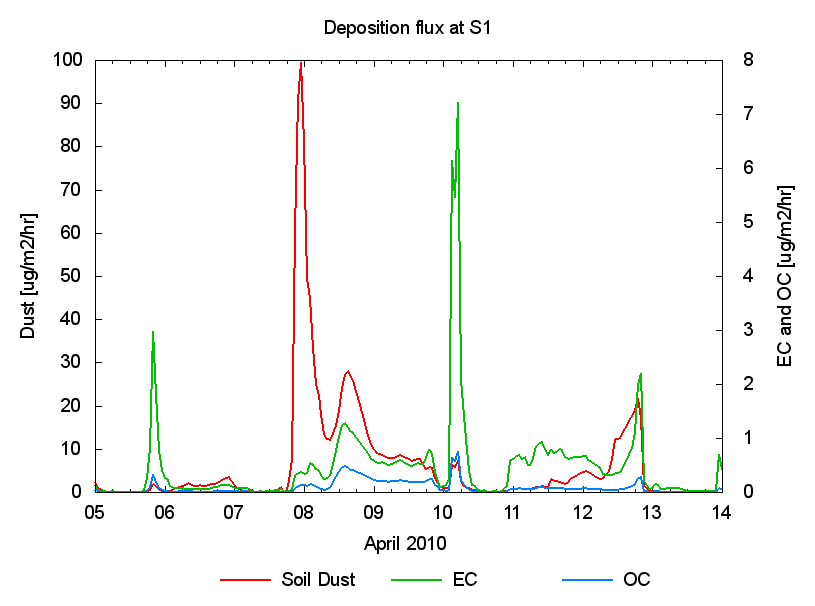
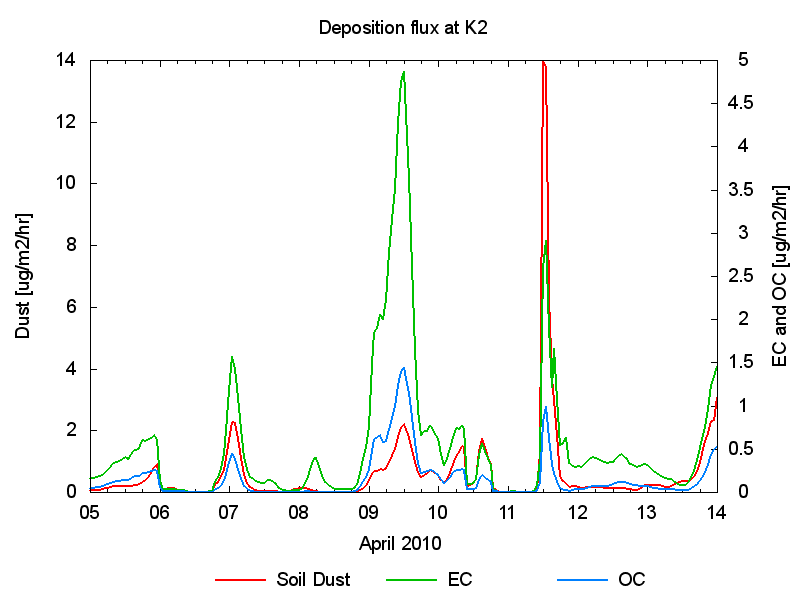
Modeled coarse mode aerosol concentrations agreed well with observations made at Oki and Hedo, Japan. The deposition flux of elemental carbon, organic carbon, and mineral dust at K2 and S1 in April 2010 were also estimated. The model was found to accurately reproduce deposition flux variability at K2, but the maximum rate of soil dust deposition and carbonaceous aerosol concentration are quite different at S1. This may be the result of variability in the source region of aerosols transported to S1, whereas K2 aerosols are mainly transported from the land via the passage of low-pressure systems over northern Japan.