Results in FY2012
1. Role of eolian dust in the biological pump
Relation between eolian dust and settling particles collected at time-series stations K2 and S1 was analyzed. The following is a summary of an oral presentation entitled “Biological pump and eolian dust in the Western North Pacific (I)” held in Oceanographic Society of Japan 2013 Spring meeting in March 2013.
(1) Ballast effect
In order to verify which ballast is most effective as “sinker” of organic materials for vertical transport, multiple regression analysis was conducted between organic carbon and biogenic opal, CaCO3 and lithogenic materials that must be an index of eolian dust. As a result, “transfer coefficient” of biogenic opal was the largest, that is biogenic opal was the most effective ballast at station K2 for sediment trap samples collected at all depths (Fig. 1). On the other hand, the ballast with largest “transfer coefficient” was not clear at station S1. At least, it can be said that lithogenic materials or eolian dust are not effective ballast of organic materials at both stations.
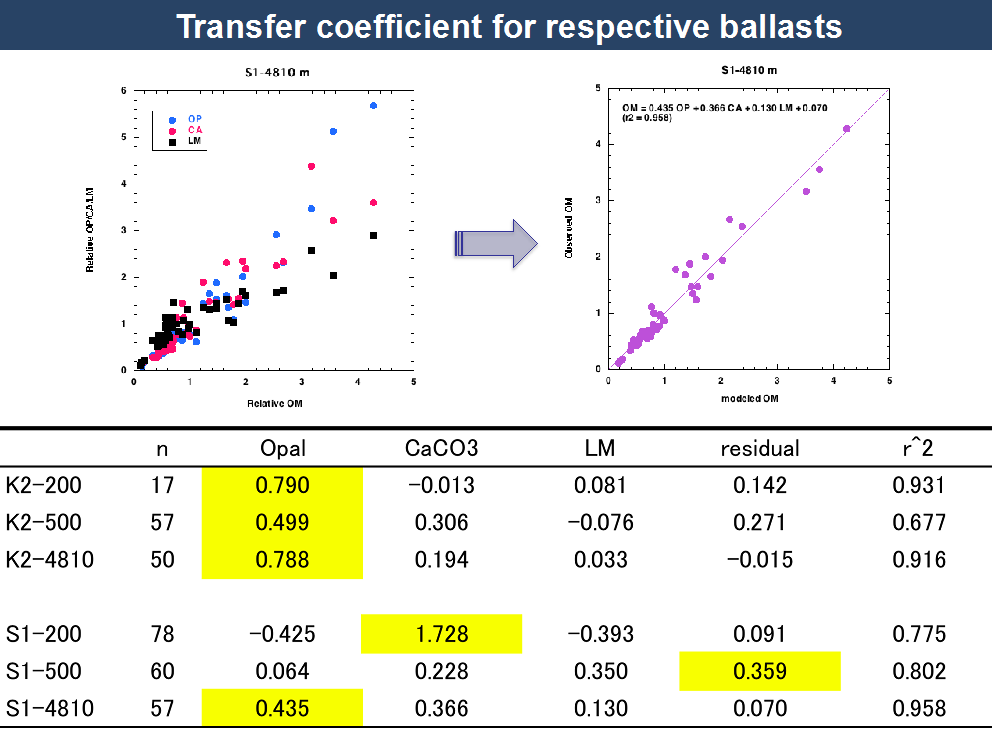
Organic carbon flux (OM) =
a×Opal flux + b×CaCO3 flux + c×Lithogenic material flux (LM) + residual , Where a, b, and c are transfer coefficients for opal, CaCO3 and lithogenic materials, respectively. ”n” is sample number and r^2 is correlation coefficient.
(2) Limiting factor of biological pump: correlation between chlorophyll-a and eolian dust
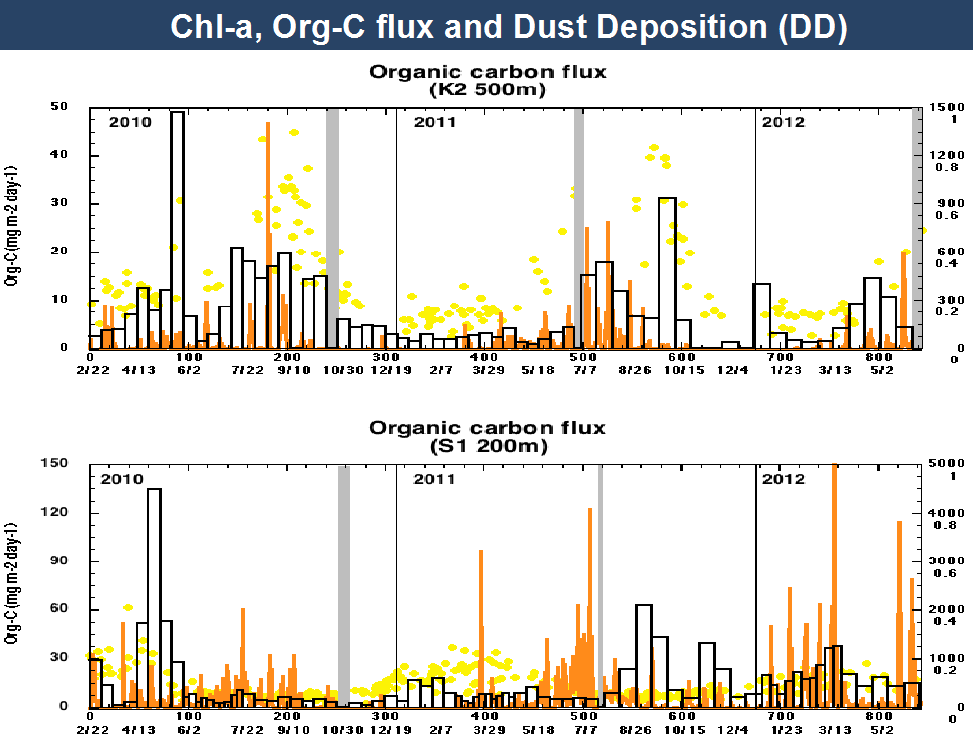
1) Organic carbon flux and concentration of chlorophyll-a in sea surface water
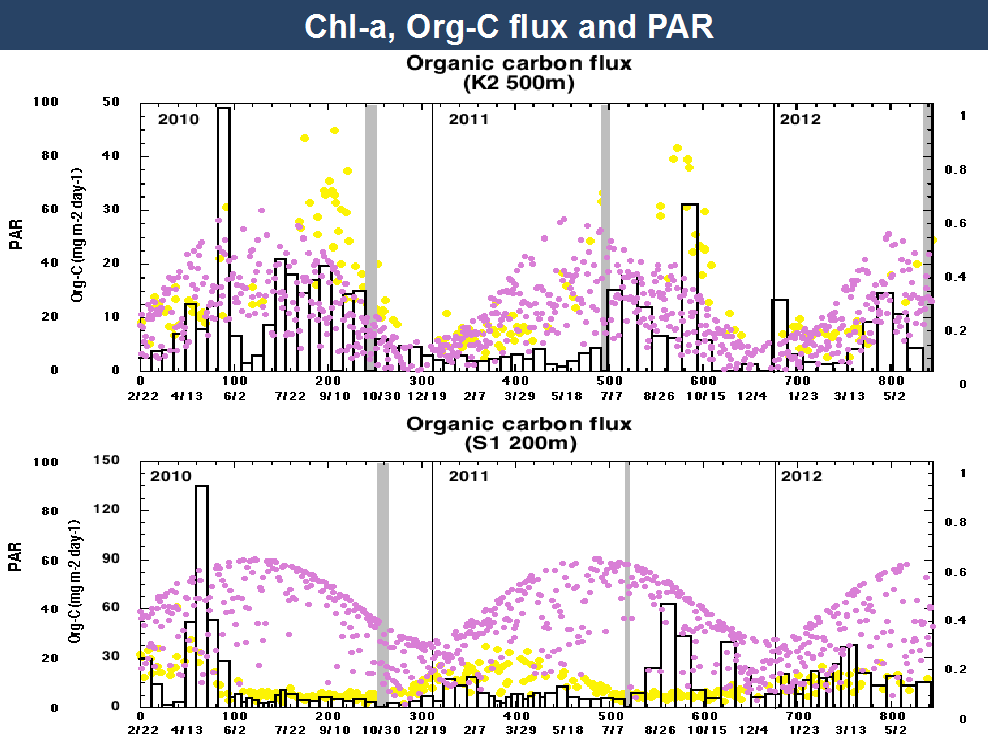
Organic carbon flux at K2-500 m and S1-200 m correlated well with satellite based sea surface chlorophyll-a concentration (chl-a). Thus correlation between chl-a and (a) sea surface temperature (SST), (b) photosynthetic available radiation (PAR) and (c) eolian dust were analyzed.
(a) SST
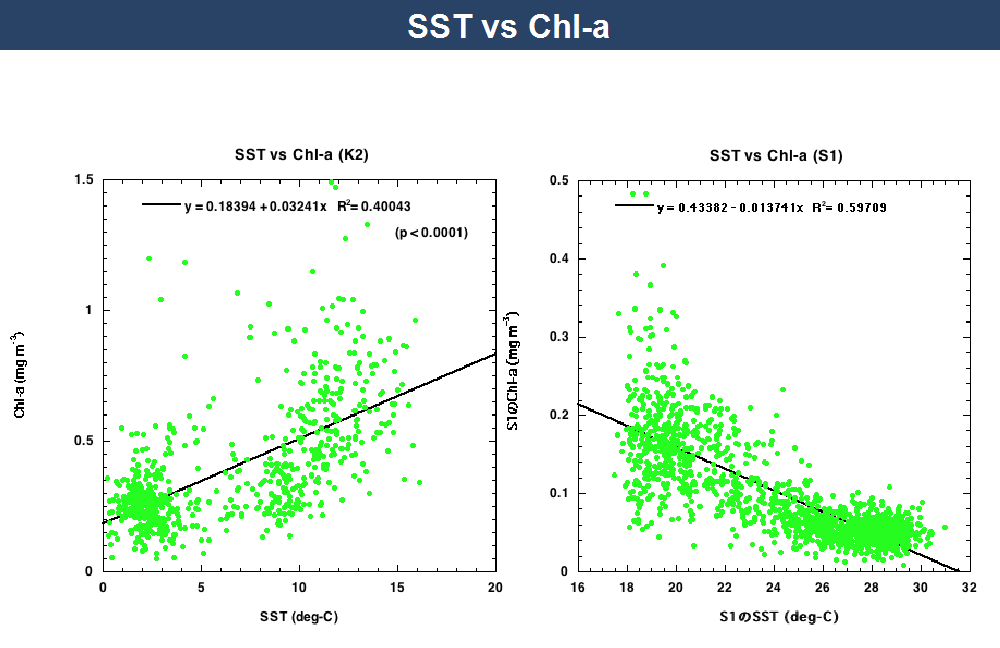
At station K2, chl-a positively correlated with SST (Fig. 2). In contrast, chl-a negatively correlated with SST at station S1. Unlike K2, concentration of nutrients in surface water at S1 is quite low or lack all year round. Negative correlation between chl-a and SST indicates that chl-a increases when colder subsurface water or subarctic water with high nutrients are supplied to S1 by physical events such as pass of meso-scale eddy.
(b) PAR
Satellite based PAR was annual maximum in May and July ay K2 and S1, respectively (Fig. 3). PAR was annual minimum in December at both stations. Compared to S1, PAR at K2 tends to be lower than theoretical PAR, which is likely attributed to that cloud cover lowers PAR very often at K2.
(c) Eolian dust
As eolian dust, the following two factors were analyzed.
(i) Aerosol Optical Thickness (AOT)
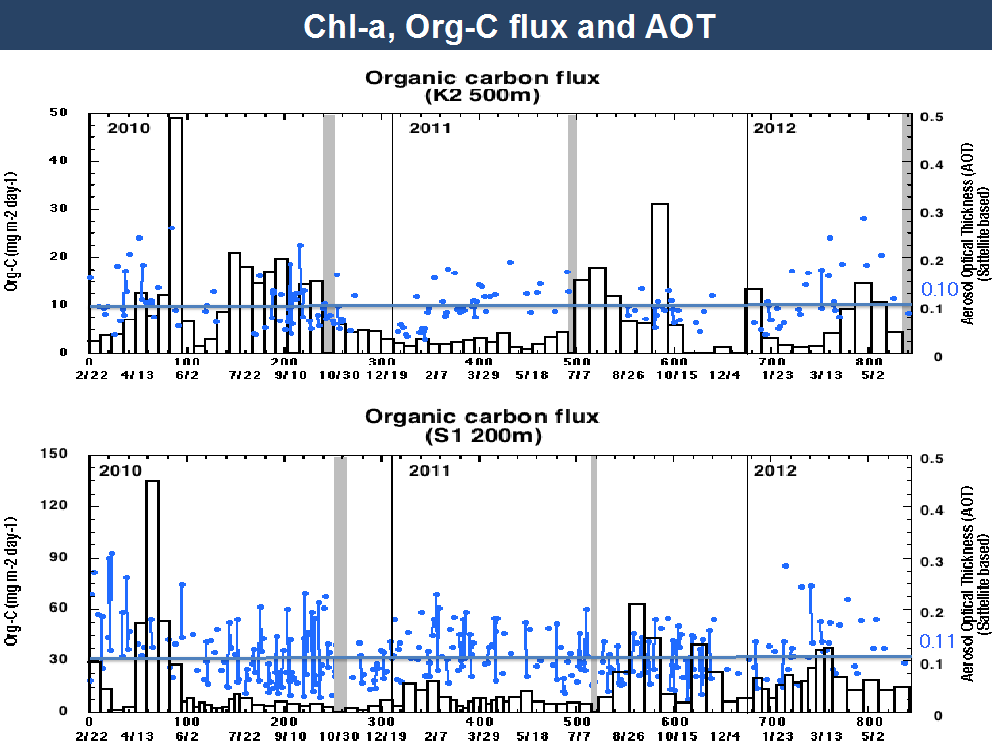
Temporal variability in Aerosol Optical Thickness (AOT) of 550 nm observed by NASA Satellite Terra and Aqua are shown in Fig. 4. Unlike we expected, seasonal variability of AOT was not large and average of AOT at K2 and S1 were comparable.
Results of multiple regression analysis is as follows:
Chl-a = 0.73 SST + 0.33 PAR + 0.025 AOT (Aqua, 550nm) – 0.080
(R^2 = 0.51)
Chl-a = 0.73 SST + 0.34 PAR - 0.004 AOT (Terra, 550nm) – 0.068
(R^2 = 0.54)
(S1)
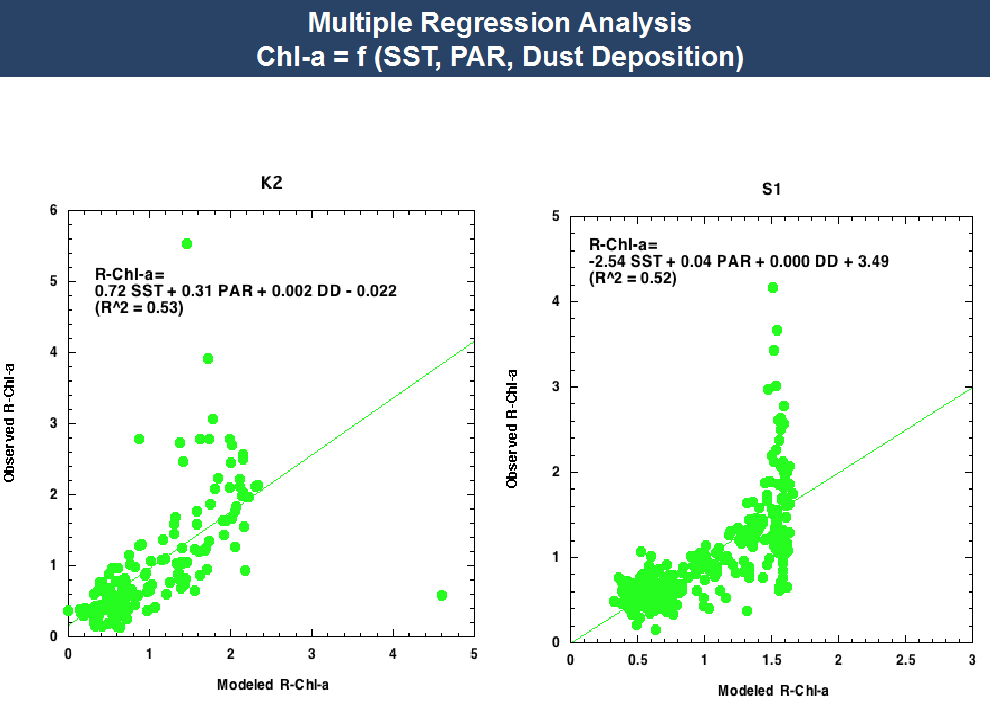
Chl-a = -2.56 SST + 0.22 PAR + 0.052 AOT (Aqua, 550nm) + 3.29
(R^2 = 0.49)
Chl-a = -2.70 SST + 0.26 PAR + 0.068 AOT (Terra, 550nm) + 3.37
(R^2 = 0.53)
At K2, positive correlation coefficient of SST with chl-a was higher, followed by PAR and, correlation of AOT with chl-a was low. At S1, negative correlation of SST with chl-a was found as described before. In addition, chl-a without relation between SST, PAR and AOT was also found. AT both statins, correlation between chl-a and AOT was quite low.
(ii) Mathematical simulation
Eolian dust deposition (DD) at K2 and S1 (spatial resolution: 1.1 degree) were computed with daily average of eolian dust concentration in the atmospheric lowest layer (kg m-3) and wet and dry deposition (mg m-2 day-1) based on global aerosol model “SPRINTARS”. As K2, DD increased in spring “KOSA” season and rainy season (Fig. 5). At S1, DD tended to increase in same period. Average of DD for S1 was estimated to be about 7 times larger than that for K2.
Multiple regression analysis was also conducted with DD instead of AOT. As a result, correlation between chl-a and DD was not found either (Fig. 6)
(d) Summary
Significant correlation between biological pump (organic carbon flu, chl-a) and eolian dust was not found this analysis. Mineralogical analysis on sediment trap sample and precise quantitative analysis of simulated data should be conducted in future.
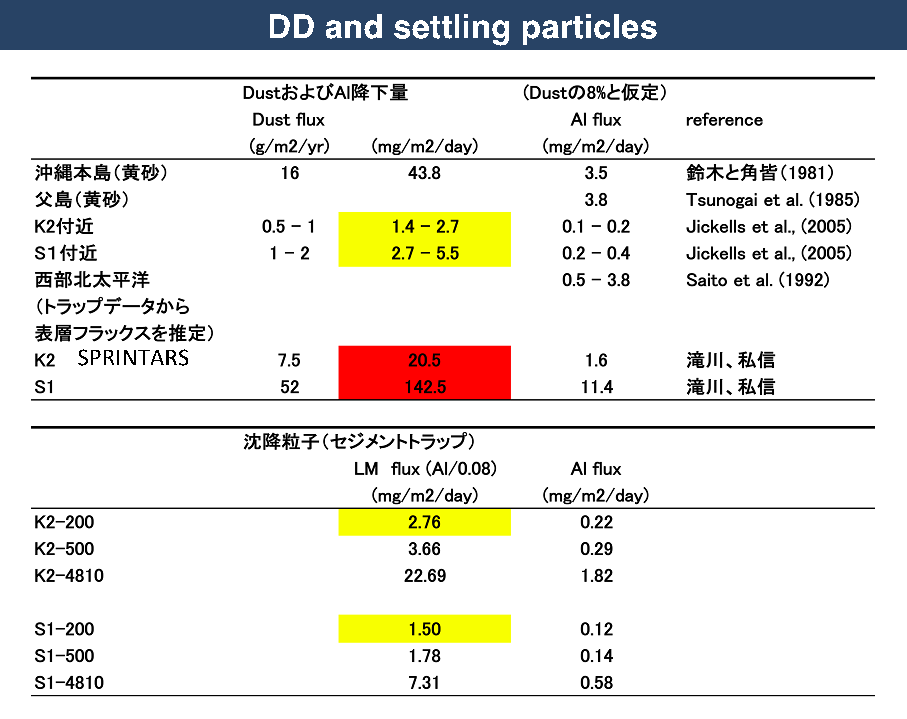
Appendix
Comparison of eolian dust flux computed with “SPRINTAR” with eolian dust flux observed previously and lithogenic material flux (or Al flux) in sediment trap samples.
2. Spatial and temporal variability in atmospheric aerosol transport and deposition
2.1 Composition analysis of atmospheric aerosol particles over the ocean
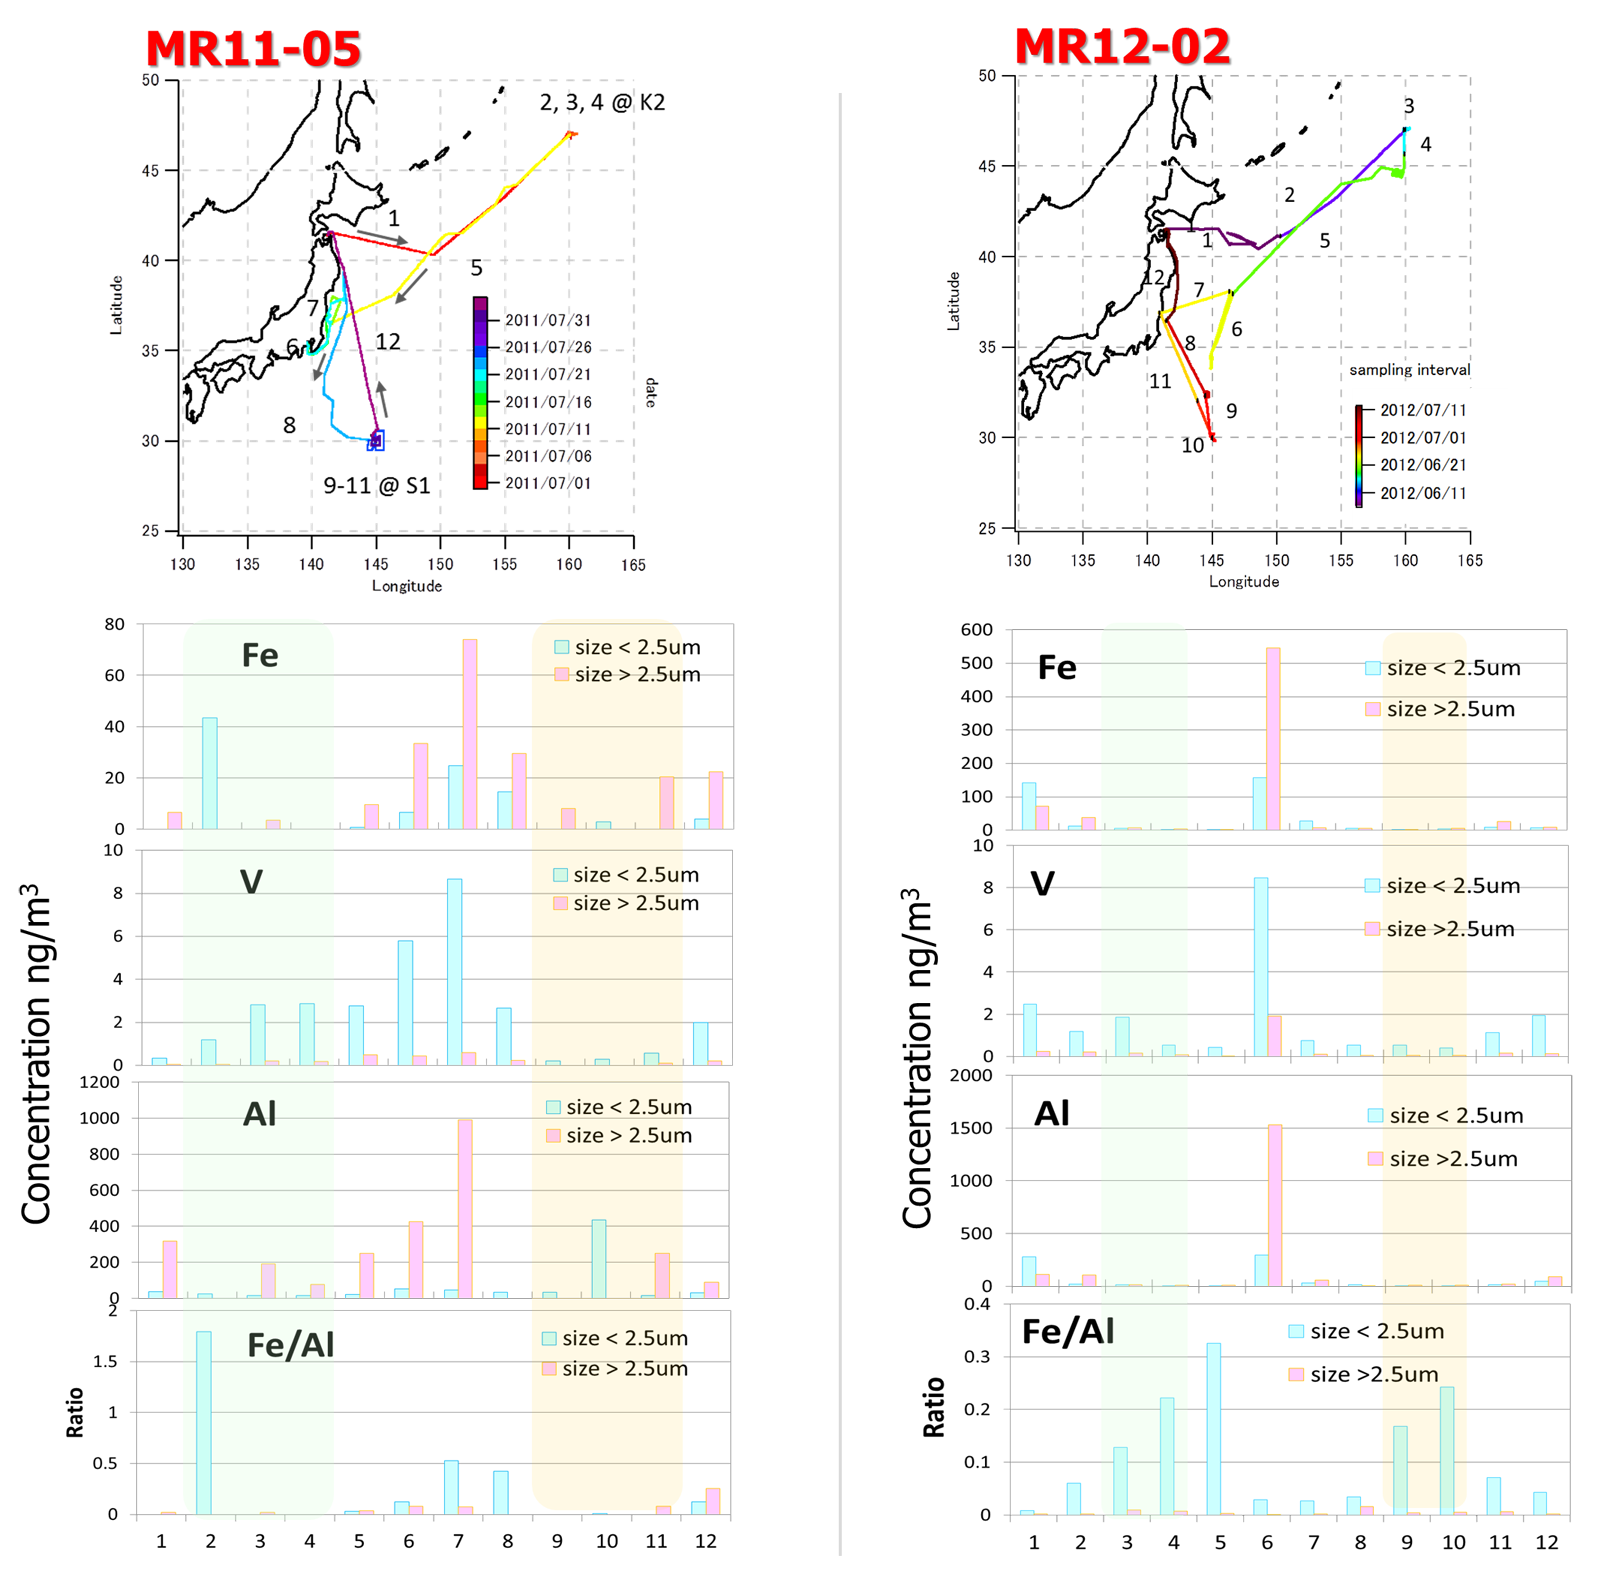
In the western North Pacific, it is suggested that eolian dust particles including iron(Fe) from the continental act as significant nutrient in the marine-ecosystem. Recently, it is suggested that emission of anthropogenic Fe to the atmosphere is increasing by economic growth in Asia region. However, it is not nuclear that their contribution to the marine-ecosystem. To investigate their influence we performed aerosol particles sampling over the western North Pacific using High-volume air sampler.
Figure shows the locations of aerosol particles sampling and results of their composition in the MR11-05 and MR12-02 cruises. The iron concentration were 0-157 ng/m3 and 0 - 546 ng/m3 for fine and coarse particles, respectively, suggesting that iron in the fine particle have significant contribution to the total iron concentration over the ocean. Furthermore, vanadium (V) which is indicator of oil combustion was detected significantly in fine particles, suggesting that anthropogenic particles are transported to the oceanic region. In the MR11-05 cruise, Fe/Al ratio of 1.8 was observed. Fe/Al ratio in eolian dust was reported from 0.44 to 0.82, suggesting that there is another source of particles.
3. Understanding variability in aerosol supply
3.1 Satellite data analysis
To understand the temporal and spatial variability of aerosol and chlorophyll a distribution around time-series stations K2 and S1, we obtained MODIS chlorophyll a concentration (chl-a) and aerosol optical thickness (AOT) of 869nm data (9-km spatial and monthly temporal resolution) from NASA Ocean Color Website (https://oceancolor.gsfc.nasa.gov/), and made a moving image. As a result of comparing the temporal and spatial distribution of chl-a and AOT during 2002 to 2012, no correlation between both variation patterns was found (See moving image).