4. Climate physics core model improvementResults Page | Top Page | ||||||||||||||||
|
The organization in charge: Earth frontier research system
a. Summary
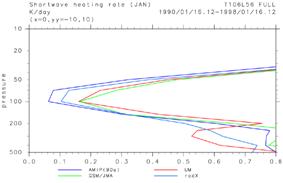
Improvement or the model taken in newly is developed for many processes of the stratosphere by the climate model (a CCSR/NIES model, existing) of an air - sea - land side which consists mainly of a physical process. This fiscal year performed the introduction and the test of a radiation code which were newly developed by CCSR while comparing the calculation result of the model of other organizations with the result of our model for improvement in the reproducibility near [ important for substance exchange of the troposhere and the stratosphere ] the tropopause. Consequently, the remarkable low-temperature bias seen near the tropopause of the general circulation model of CCSR/NIES has been improved epoch-makingly. Moreover, the direct resolving simulation of the air internal gravity wave which plays an important role in middle atmosphere general circulation was performed, and it succeeded in acquiring all ball distribution of the amplitude of a gravity wave, or a propagation direction in the lower stratosphere for the first time in the world. The resolution attained in the simulation of this fiscal year is a level T213 (0.55-degree lattice) and 300m of perpendicular thickness. Moreover, in experimenting in high resolution more, the calculation code of a general circulation model was improved so that the automatic [ in a node ] parallel function of an Earth Simulator might be used. b. Research purposeThere is the purpose of this research in understanding better various process in the atmosphere connected with it to be development - improvement of a climate physics model. In order to simulate correctly the interaction process of the change and climate of atmospheric composition in a middle atmosphere, the temperature place of the air motion which governs transportation of an air minor constituent or aerosol, and the atmosphere important for photochemical-reaction process especially needs to be appropriately reproducible. Cooling by heating which the large-scale circulation in a middle atmosphere, the seasonal variation of a temperature place, and solar-ultraviolet-radiation absorption according to ozone in order to more often reproduce change every year bring about, and the infrared radiation to which the greenhouse-effect gas made into representation releases carbon-dioxide - methane - ozone - steam, i.e., radiation process, and various airwaves ranging from hundreds of m to a planet scale are considered need to be appropriately expressed in a model, respectively. In order to express radiation process and a small-scale airwave correctly, it is thought that the level perpendicular resolution of a model must be to some extent high. However, resolution sufficient required when conducting the warming prediction experiment included to the interaction with atmospheric composition change over a long period of time is not clear enough even now. It is scientifically meaningful to carry out clear [ of the dependability over the model resolution of each process ] by large-scale calculation using an Earth Simulator, and it is the main subject of this sub thema while it is indispensable for the design of an integrated model. In the overall plan, while setting development of the general circulation model used as the foundation of a final integrated model as a long-term target, development - offer of the air model united with the needs of each subgroup (partial integrated model) is performed. c. A research program, a method, a scheduleImprovement or the model taken in newly is developed for many processes of the stratosphere by the climate model (CCSR/NIES a model, existing) of an air - sea - land side which consists mainly of a physical process. In order to adopt correctly the temperature of the stratosphere - mesosphere atmosphere, and the effect of the internal gravity wave which plays a big role in circulation - substance transportation, it is necessary to do a numerical simulation by the horizontal resolution of 20km and the about [ vertical thickness 100m ] model which do not carry out the parameter rise of the internal gravity wave but as for which direct picking treats it. This experiment will be conducted by 2nd, and while even a middle atmosphere is included, it enables it to include new parameterization in a resolution atmospheric chemistry - climate joint model in 3rd. The chemistry - climate joint model containing a middle atmosphere is sub thema (2). - Development - of a "warming - atmospheric composition interaction model" cooperates and furthers development in parallel, and experiments by inside resolution models, such as a synergistic effect of ozone layer depletion and warming. d. The research program in FY 2003The cause by which remarkable low-temperature bias appears near the tropopause is studied about a general circulation model (it omits Following AGCM), and bias is removed. Moreover, an inside resolution model also aims at the simulation of the middle atmosphere general circulation to which it is comparable to a high resolution model by searching for all ball distribution of an air internal gravity wave, and using as an input value of gravity wave resistance parameterization by a high resolution simulation. e. Reports in FY 2003e-1. Cause investigation of tropopause low-temperature biasBy the appeal of a symbiosis first division title (CCSR �Z group), they are all the Meteorological Agency ball spectrum forecast models (GSM) and Hadley Center Unified Model. It was able to have an opportunity to compare the result of (UM) with the result of CCSR/NIES AGCM in detail. Consequently, especially in CCSR/NIES AGCM, it turned out that the minimum of temperature low [ which is applied to the lower stratosphere from the tropical tropopause ] 10 degrees C or more and located in about 100hPa in observation or other models is located in 70hPa (figure 47a). In order to investigate the cause, detailed comparison was performed about the dynamics process and radiation process of each model, condensation process, etc. about the heat budget near the tropopause. Although the balance between the elements by which the temperature near the tropopause is characterized in each model differed, compared with other models, it turned out especially by CCSR/NIES AGCM that a small tendency has shortwave heating in the lower stratosphere (figure 47b).
In the radiation group of CCSR, renewal of the radiation code used for AGCM was performed. The following are mentioned as main changed parts.
The new radiation code (code name mstrnX) stated for the preceding clause was introduced into T106L56 AGCM, and it compared with the experimental findings performed on the same conditions using the conventional radiation code (Fig. 48 a, b). It turns out that the remarkable low-temperature bias decreased sharply especially in the lower stratosphere of the tropical tropopause and summer hemisphere. On the other hand, high temperature bias remarkable in the high latitude lower stratosphere appeared. When parameterization of orographic gravity wave resistance was not used as a result of subsequent investigation, it turned out that the high temperature bias of the high latitude lower stratosphere which was described above becomes small (figure 48c). This has suggested that the downward flow of the high latitude lower stratosphere becomes strong too much as a result of having weakened by force what suited the tendency for shortage of short wave radiation to act indirectly conventionally, and for the west wind of the inside latitude lower stratosphere to become strong by using gravity wave resistance parameterization strength. the case where gravity wave resistance parameterization is not used at all on the other hand -- the west wind of an inside latitude troposhere lower layer - a middle lamella -- strong -- becoming -- passing -- the earth surface of high latitude -- it was checked that atmospheric pressure compares actually and becomes small too much (48d of figures). This showed [ in / at least / the troposhere lower layer ] that a west wind needed to be moderately slowed down by orographic gravity wave resistance parameterization. You have to investigate from now on about whether it is suitable to reproduce general circulation with what most realistic parameter of a value.
an interaction with the detailed chemical process and the aerosol of the stratosphere or the troposhere be expressed , and it be decided from the request that moreover an ensemble experiment of a unit must be conduct for 100 years , by the earth system integrated model develop with this subject as a result of the examination performed during the current fiscal year that horizontal resolution T42 and the scale of about 80 layers of verticals be adopted about an air model . e.5. The direct simulation of a gravity waveIn case the air internal gravity wave which it is excited in the troposhere and spread up becomes unstable from the effect of density stratification, and carries out a breaking wave in a middle atmosphere or is decreased near [ of the background style ] the critical level to make, it delivers the conveyed momentum to a background place. The effect has made various phenomena including periodic vibration the semi- two-year periodic vibration seen in the equatorial stratosphere, and half a year. Moreover, in the lower stratosphere, the role important for determining the temperature of polar of the time which an ozone hole produces is borne. It can have big influence on the chemical process of the stratosphere by how the effect is taken into a model. Since T42 AGCM is used with this subject as stated previously, the effect by a small-scale internal gravity wave cannot be expressed directly. Therefore, it is necessary to carry out additional introduction of the parameterization of the gravity wave resistance which makes convective activity, a front, etc. the origin at parameterization of gravity wave resistance of the geographical feature origin adopted conventionally. Although what is depended on Hines (1997) was adopted, the realistic climate value of all ball distribution of a gravity wave is needed as the boundary condition. Since the information acquired from observation was inadequate, prior to the world, the direct simulation of a gravity wave was performed using the high resolution air model on the Earth Simulator, and it decided to use the result as an input value of parameterization. The horizontal resolution of the model used for the experiment is T106 and T213, and can resolve the level wavelength of 500km, and an about 250km gravity wave, respectively. Perpendicular resolution can fully express a gravity wave with a perpendicular wavelength of 1-2km which excels in the lower stratosphere by being referred to as 300m by taking 250 layers in a vertical direction. As an average, the output was performed four years by T106L250, and performed integration for one year by T213L250 for 1 hour. From the result of Fig. 49T106L250 experiment, it will ask for the frequency spectrum of the zonal wind of each lower stratosphere as December to February near Japan in June to August. About the spectrum of 5 hours or more, the gradient of a spectrum is equivalent to - (5/3) plex of frequency, and the cycle of winter shows the spectrum observed by MU radar of Shigaraki, and qualitatively good coincidence (Sato 1994). The spectrum of an on the other hand more short periodic belt is smaller than observation, and it has suggested that the gravity wave of such a short cycle cannot fully be expressed in the experiment with a level wavelength of 500km. In a summer, the gradient of a spectrum is large compared with winter, and this point is also qualitatively in agreement with observation. If it sees quantitatively, as for summer winter, a model will tend to overestimate observation with almost all the periodic belt beyond periodic 5 hour.
It asks for the perpendicular wavenumber spectrum of the relative temperature turbulence (T' / T0) in the lower stratosphere of the Australia northern part from the result of Fig. 50T106L250 experiment. By the long wavelength side, the gradient of a spectrum is proportional to a perpendicular wave number bordering on about 3.5km, and it is proportional to the 3rd [ -] power of a perpendicular wave number about in the short wavelength side. Allen and Vincent (1995) of this corresponds with that for which it asked from radiosonde observation quantitatively, and it can be said to be one of proof which can trust the result of this model. Moreover, compared with an ingredient with a level wavelength of 500-1250km shown by a dotted line, an ingredient with a level wavelength of 1250km or more shown with a dashed line has large power in the long wavelength side, and its power is small in the short wavelength side. From this result, by T42 model, since only a wave with a level wavelength of 1250km or more can be expressed, however it may enlarge perpendicular resolution, it will be guessed that the wave with short perpendicular wavelength cannot be expressed.
Fig. 51 a is what calculated the root mean square wind velocity (color) of a gravity wave with a level wavelength of 250-1250km, and the root mean square wind velocity of the gravity wave spread to eight directions on some lattice points (arrow) in 70hPa of lower stratosphere in T213L250 model January. The red line expresses the precipitation averaged through this period. Moreover, figure 51b shows the zonal wind in 70hPa. The following features are mentioned from these figures.;
Such features are as conformable as all ball distribution (e. g.Wu and Waters 1996) of the gravity wave obtained by satellite observation in recent years, and the observation (Vincent personal communication) by radiosonde network observation, and comparison with observation can be due to be advanced further from now on. Moreover, after the following fiscal year, gravity wave distribution of the lower stratosphere obtained in this experiment is very important, when improving non-orographic gravity wave parameterization of Hines. In addition, although the international conference on a gravity wave also released the experimental findings which introduced Hines parameterization and high evaluation has been obtained, it omits on account of space here, and suppose that it explains in full detail in the report of the following fiscal year.
f. ConsiderationIt can be said that the result as the overall almost original research program was attained. the gravity wave distribution when performing tuning of orographic gravity wave resistance parameterization at the time of using a new radiation code, improvement of non-orographic gravity wave resistance parameterization after being based on the result of a high resolution gravity wave simulation, and prolonged integration -- it is necessary to tackle succeedingly as a subject after the following fiscal year every year about verification of change and behavior of the gravity wave at the time of raising resolution further Acknowledgement :Calculation of this research was performed using the Earth Simulator. GFD-DENNOU Library and GTOOL were used for drawing. g. BibliographyAllen, S.J. and R.A. Vincent, Gravity wave activity in the lower atmosphere: Seasonal and latitudinal variations, J. Geophys, Res., 100, 1327-1350, 1995.Hines, C. O., Doppler-spread parameterization of gravity-wave momentum deposition in the middle atmosphere. Part 2: Broad and quasi monochromatic spectra, and implementation, J. Atmos. Solar Terr. Phys., 59, 387-400, 1997. Sato, K., A statistical study of the structure, saturation and sources of inertio-gravity waves in the lower stratosphere observed with the MU radar, J. Atmos. Terr. Phys., 56, 755-774, 1994. Wu, D.L. and J.W. Waters, Satellite observations of atmospheric variances: A possible indication of gravity waves, Geophys. Res. Lett., 23, 3631-3634, 1996. Sekiguchi Miho, the University of Tokyo doctoral dissertation, and 2004. River valley Research of the gravity wave using Yoshio and a general circulation model: The analysis of all ball distribution, and the source of excitation and the 3-dimensional propagation characteristic, the University of Tokyo doctoral dissertation, 2004. h. Announcement of a result :S. Watanabe and T. Nagashima, Seasonally and geographically varying gravity wave source for a Doppler-spread parameterization derived from a high-resolution GCM experiment; (I) Propagation direction, Amplitude distribution and saturation of gravity wave spectrum, Chapman Conference on Gravity wave processes and parameterization , Jan 13 2004, Hawaii, USA.S. Watanabe and T. Nagashima, Seasonally and geographically varying gravity wave source for a Doppler-spread parameterization derived from a high-resolution GCM experiment; (II) Impacts on large-scale circulations, Chapman Conference on Gravity wave processes and parameterization, Jan 13 2004, Hawaii, USA. |

![Fig. 49: Frequency power spectrum of zonal wind in grid near Japan of 106LT250 model [m2-/s2/Hz].(a) 12-2 monthly average](./figure/4-04.jpg)
![Fig. 50: Perpendicular wavenumber spectrum of relative temperature turbulence (T' / T0) in Australia northern part (139.5E, 20.748 S) of 106LT250 model [1/(1-/km)]](./figure/4-06.jpg)
![Fig. 51: (a) level wavelength 250 in T213L250 model 170hPa side per month The monthly average root mean square wind velocity [m/s] (color) of the gravity wave of - 1250 km, the monthly average root mean square wind velocity (arrow) of the propagation ingredient to eight directions in a typical grid, and monthly average precipitation [isoline:3 mm/day].(b) Zonal wind distribution [isoline : 5 m/s].](./figure/4-07.gif)
![(c) level wavelength 250 in the Figure 51(continuation):T213L250 model 770hPa side per month The monthly average root mean square wind velocity [m/s] (color) of the gravity wave of - 1250 km, the monthly average root mean square wind velocity (arrow) of the propagation ingredient to eight directions on a typical grid, and monthly average precipitation [isoline:3 mm/day].(d) Zonal wind distribution [isoline : 5 m/s].](./figure/4-08.gif)