4. Climate physics core model improvementResults Page | Top Page | |||||||||||||
|
The organization in charge: Earth environment frontier research center
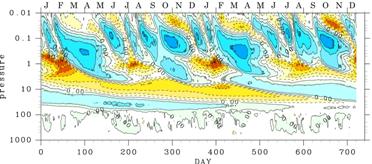
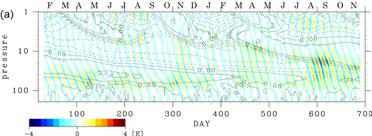
a. SummaryImprovement or the model taken in newly is developed for many processes of the stratosphere by the climate model (CCSR/NIES a model, existing) of the atmosphere, the ocean, and a land side which consists mainly of a physical process. About improvement of an air model (AGCM), improvement of many processes of an inadequate middle atmosphere (the stratosphere and mesosphere) is aimed at by the present model. That is, while change of the radiation from the physical chemistry process and the sun of an ozone layer peculiar to a middle atmosphere influences each other mutually and causes change of a middle atmosphere by invasion of the artificial origin substance to the inside of a middle atmosphere, it clarifies the mechanism which combines with change of the lower layer troposhere and produces a climate change by model experiment. Moreover, the action of an internal gravity wave and it clarify influence affect atmospheric circulation by a super-high resolution air model. In order to mitigate the low-temperature bias of winter stratosphere high latitude and to reproduce periodic vibration (QBO) appropriately with the horizontal resolution T42 of an integrated model for stratosphere equatorial semi- two years, this fiscal year concentrated on improving gravity wave resistance parameterization by Hines (1997) using the result of high resolution AGCM, and summarized various knowledge acquired in the process as a prepublication paper. It is under work succeedingly still now at the end of a fiscal year, and, first, a test is likely to be completed next year about the extension to the middle atmosphere of the integrated model which combination of the atmosphere, the ocean, land, a carbon cycle, atmospheric chemistry, and aerosol process completed, and introduction of a physical process component (a sigma-p hybrid coordinate system, a new radiation code, and Hines parameterization) required in the stratosphere. The highest resolution attained in the simulation of this fiscal year is a level T213 (0.55-degree lattice) and perpendicular thickness 100 m. b. Research purposeThe purpose of this research is to understand better various process in the atmosphere connected with it to be development and improvement of a climate physics model. In order to simulate correctly the interaction process of the change and climate of atmospheric composition in a middle atmosphere, the temperature place of the air motion which governs transportation of an air minor constituent or aerosol, and the atmosphere important for photochemical reaction process especially needs to be appropriately reproducible. Cooling by heating which the large-scale circulation in a middle atmosphere, the seasonal variation of a temperature place, and solar-ultraviolet-radiation absorption according to ozone in order to more often reproduce change every year bring about, and the infrared radiation to which the greenhouse effect gas make into representation releases carbon dioxide, methane ozone, and steam, i.e., radiation process, and various airwaves ranging from hundreds of m to a planet scale are consider need to be appropriately express in a model, respectively. In order to express radiation process and a small-scale airwave correctly, it is thought that horizontal / vertical resolution of a model must be to some extent high. However, resolution sufficient required when conducting the warming prediction experiment included to the interaction with atmospheric composition change over a long period of time is not clear enough even now. It is scientifically meaningful to clarify dependability over each process model resolution from the large-scale calculation using an Earth Simulator, and it is the main subject of this sub subject matter while it is indispensable for architecture of an integrated model. In the overall plan, while setting development of the general circulation model used as the foundation of a final integrated model as a long-term target, development is performed and offer of the air model united with the needs of each subgroup (partial integrated model) is performed. c. A research program, a method, a scheduleImprovement or the model taken in newly is developed for many processes of the stratosphere by the climate model (CCSR/NIES a model, existing) of the atmosphere, the ocean, and a land side which consists mainly of a physical process. Horizontal resolution which does not carry out the parameter rise of the internal gravity wave but as for which direct picking treats it in order to adopt correctly the temperature of the stratosphere and the mesosphere atmosphere, and the effect of the internal gravity wave which plays a big role in circulation and substance transportation It is necessary to do a numerical simulation by the model about 20 km and perpendicular thickness 100 m. This experiment will be conducted by 2nd, and while even a middle atmosphere is included, it enables it to include new parameterization in resolution atmospheric chemistry and a climate joint model in 3rd. The chemistry and the climate joint model containing a middle atmosphere are sub themes (2). - Development - of "warming and an atmospheric composition interaction model" cooperates and furthers development in parallel, and experiments by inside resolution models, such as a synergistic effect of ozone layer depletion and warming. d. The research program in FY 2004During FY 2004, the transplant of the troposhere chemistry model to an integrated model is due to be completed. After a transplant end, the model upper bed of an integrated model is extended to the stratosphere upper part, tuning is also performed, and it prepares for stratosphere chemical process introduction. In order to reproduce the atmospheric chemistry process in the stratosphere actually, removal of the low-temperature bias in the lower stratosphere and the reappearance of QBO in the low latitude stratosphere can call it a necessary condition. QBO etc. has played the role with an important internal gravity wave in formation of stratosphere atmospheric circulation, and it analyzes following FY 2003 about both the ingredient explicitly expressed by a high resolution air model, and the ingredient by which a parameter rise is carried out, and uses for improvement of gravity wave parameterization introduced into the integrated model. e. Reports in FY 2004The experiment by high resolution AGCM is conducted for the purpose of improvement of Hines gravity wave parameterization. Since the knowledge acquired through the analysis of those experimental findings was summarized to the prepublication paper in the current fiscal year, respectively, the content of the particulars sentence is introduced simply hereafter. e-1. Analysis of the tropical atmospheric general circulation reproduced by T63L250 AGCM (Watanabe and Takahashi 2005) In order to acquire the climate value of the gravity wave distribution inputted into Hines gravity wave parameterization, prolonged integration is performed with the high resolution AGCM, such as T106 and T213. The initiative was taken in those experiments, the preliminary experiment for six years was conducted using AGCM of the horizontal resolution T63 perpendicular resolution L250 in which an experiment for a short period of time is more possible, and the result was analyzed. As a result, it has checked that AGCM of this resolution can reproduce time development of periodic vibration (SAO) appropriately tropical QBO and stratosphere half a year, and that the behavior in AGCM of the Kelvin wave which are main equatorial waves was realistic. Moreover, comparison with observation was performed also about vibration of a mesosphere within a season. Fig. 54 -- T63L250 -- it is the time-advanced section for two years of the beltlike average zonal wind in the equatorial sky of AGCM. QBO of the lower stratosphere and SAO near a stratopause (~1 hPa) are simulated actually. In the lower stratosphere, the reversal to Kochi from a west wind took place to the first year, and Kochi has taken the place of the following year at the west wind. The maximum of Kochi and a west wind is -30 ms-1 and 20 ms-1, respectively. If all experimental periods are averaged, this cycle of QBO is longer than only two years, and can be said to be realistic. Time change of the zonal wind of the lower stratosphere bears a strong resemblance to the experimental findings which used T42 AGCM of Takahashi (1999). Stratopause SAO is also realistic. While the reversal to Kochi from a west wind has arisen in about 1 appearance in the large advanced range, as the west wind descended gradually, it has produced the shift to a west wind from Kochi. Furthermore, the cycle early in a year ("first cycle") has large amplitude compared with the cycle ("second cycle") of the second half. The maximum of the Kochi and the west wind in the cycle of the first half is -60 ms-1 and 30 ms-1 about, respectively. Time development of such a zonal wind is very well in agreement with the observation fact currently introduced in the review of Garcia et al. (1997). The difficult thing is known for low resolution AGCM even if simulating Stratopause SAO actually introduces non-orographic gravity wave parameterization (Amodei et al.2001). In the integrated model which introduced Hines parameterization from now on, it is made to investigate comparing with these experimental findings to what extent SAO can reappear actually. In a mesosphere, Stratopause SAO and the mesopause SAO of antiphase are seen, and when Stratopause SAO is a Dongfeng, the west wind which descends with time with 30 -40 diurnal periodicity is seen. Vibration of 30 -40 same diurnal periodicity is observed also by medium frequency radar, and it was checked about what is appearing in the AGCM result that it is a phenomenon peculiar to low latitudes like QBO etc.
Fig. 54: T63L250 Altitude-time cross section of the beltlike average zonal wind in the equatorial sky of AGCM. An isoline interval expresses 10 ms-1 and blue expresses a west wind. About the temperature of the equatorial sky, although Fig. 55 took out the ingredient among equatorial Kelvin waves on 12 to east-and-west wave number 1 and cycle the 20th, it shows an altitude-time cross section. An isoline is the beltlike average zonal wind of Fig. 54. For the first year whose equator QBO is a west wind, a Kelvin wave can spread only to near the maximum of the west wind of QBO, but signs that it is decreasing near the are looked at. Since maximum and the phase velocity of a Kelvin wave have the comparable west wind of QBO, this shows that perpendicular group velocity becomes very small near the, and a wave declines with time. Signs that a Kelvin wave passes the west wind of QBO and spreads high up in the sky occasionally are seen in the period when QBO changes from a west wind to Kochi. Moreover, when QBO is a Dongfeng, a Kelvin wave spreads to a central part stratosphere almost continuously, and the next QBO becomes a west wind and is amplifying near advanced. The character of such a Kelvin wave was well in agreement with the observation fact quantitatively, and it has checked that this AGCM could be expressing the Kelvin wave appropriately. Furthermore, the perpendicular wavelength of the Kelvin wave in a QBO west wind was able to be shown for the first time as research using AGCM of becoming shorter than it in QBO Kochi. Moreover, the actuality of a wave has mainly been checked from comparison with satellite observation also about the Kelvin wave with a shorter cycle.
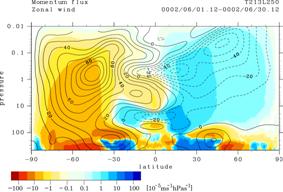
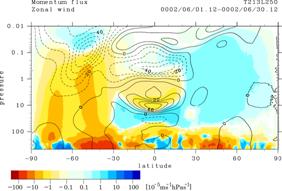
Fig. 55: T63L250 The east-and-west wave number 1 in the equatorial sky of AGCM, time-advanced sectional view of the temperature turbulence on 12 to periodic the 20th. e-2. Analysis about the difference in the momentum flux of a gravity wave and the structure of the beltlike average zonal wind of a middle atmosphere which are brought about by the difference in the horizontal resolution of AGCM (Kawamiya et al.2005) It has investigated about the influence an air internal gravity wave affects middle atmosphere general circulation using AGCM of FY 2003 in FY 2002, and the horizontal resolution from which T106 and T213 differ. By comparing those results directly, it was able to be shown clearly how horizontal resolution is important when simulating middle atmosphere general circulation actually. The minimum level wavelengths which can be expressed with the horizontal resolution of T106 and T213 are about 380 km and 190 km, respectively. In a vertical direction, 250 layers are taken from the ground before about 80 km, and the perpendicular resolution in a middle atmosphere is fixed at about 300 m. The bottom of the almost same experiment setup was integrated with AGCM of each horizontal resolution for several years. The result of these and for one year compared comrades. Fig. 56 is the beltlike average of the east-and-west momentum perpendicular flux (u'omega') by the isoline of the beltlike average zonal wind in June of T213 and T106 experiment, and a with an east-and-west wave numbers of five or more ingredient, respectively. Although two or more inversions of a zonal wind are seen in the Torrid Zone in a vertical direction, this expresses vibration of QBO, Stratosphere SAO, and a mesosphere within a season (Watanabe and Takahashi 2005). The maximum of the polar night jet of winter hemisphere in T213 experiment is as strong as about130'ms-1' in T106 experiment to being about100'ms-1'. Similarly, the maximum of mesosphere Jet Kochi of summer hemisphere is also strong with -60 ms-1 in the T106 experiment to abbreviation-50 ms-1 of T213 experiment. As for the maximum of such wind velocity, the way of T213 experiment is located in a low altitude. Furthermore, the polar night jet of T213 experiment is located more in low latitude. This is as conformable as the temperature of stratosphere high latitude being higher (a figure is omitted). It can be said that the T213 experiment of the wind velocity of a mesosphere is weaker, and it is having structure more realistic than T106 experiment generally. This has suggested that the T213 experiment of the slowdown of the beltlike average zonal wind by loss of a gravity wave is stronger, and it is more realistic. The mark of beltlike average east-and-west momentum flux is negative in the middle atmosphere of the Southern Hemisphere, and, on the other hand, has just become above the east-and-west wind velocity zero line of the Northern Hemisphere. This shows that upper part transportation of Dongfeng quantity of motion relative to the west wind of Background wind stands high that it is Southern Hemisphere = winter hemisphere. On the contrary, it is shown that upper part transportation of west wind quantity of motion relative to the Dongfeng of the background style excels in Northern Hemisphere = summer hemisphere. Such a momentum is carried by the gravity wave which it is generally excited in the troposhere and is spread to the perpendicular upper part. Although reduction in momentum flux is seen in a mesosphere, this is based on the breaking wave and saturation process of a gravity wave. Perpendicular emission of the momentum flux produced as a result works so that a beltlike average zonal wind may mainly be decelerated. Therefore, that the beltlike average zonal wind of a mesosphere is weak in T213 experiment originates in the value of momentum flux being large and perpendicular emission being still larger so that it may see in Fig. 56.
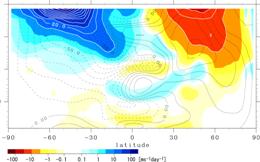
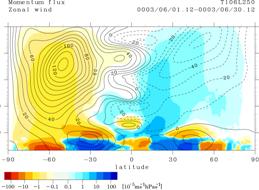
Fig. 56: (Left) T213 experiment (right), T106 experiment. Isoline: Beltlike average zonal wind [ms-1]. Color: Beltlike average east-and-west momentum perpendicular flux by a with an east-and-west wave numbers of five or more ingredient (u'ω') [10-5ms-1hPas-1]. A color is a logarithm scale. The beltlike average zonal wind of Fig. 57T213 experiment and T106 experiment and the difference in beltlike average east-and-west momentum perpendicular flux are expressed. Both hemispheres are understood that the size of the east-and-west momentum flux in T213 experiment is far large compared with the thing of T106 experiment. By inside and high latitude, the value of T213 experiment has especially reached also the twice of T106 experiment (refer to Fig. 56). Although the difference in the phase of QBO or vibration within a mesosphere season has appeared about the Torrid Zone, it does not observe here. In the Southern Hemisphere, 2 independent beltlike negative east-and-west momentum flux is extended from the troposhere to the up stratosphere. Among these, the thing by the side of high latitude is related to contribution of the orographic gravity wave on the South Pole having become large. Although this point was explained in full detail behind, in the T213 experiment, the orographic gravity wave excited since finer geographical feature can be expressed increased. On the other hand, since the small-scale non-orographic gravity wave by the cumulus convection included in an extratropical storm and the orographic gravity wave excited near the Andes increased, the thing of inside latitude is considered. The positive deviation seen in an up mesosphere means the lower thing which it is advanced and the breaking wave of a gravity wave came to produce. This is as conformable as a stronger gravity wave having come to be excited in the troposhere. In the Northern Hemisphere, an orographic gravity wave is filtered by the critical level in the lower stratosphere. Therefore, it is excited by the cumulus convection that positive east-and-west momentum flux increased, and it means that the small-scale non-orographic gravity wave spread facing west with big phase velocity increased. A part of these cumulus convections are included in temperate hand atmospheric pressure, and others are contained in the large-scale cloud cluster (scale which occupies two or more grids of GCM) which progresses on a continent.
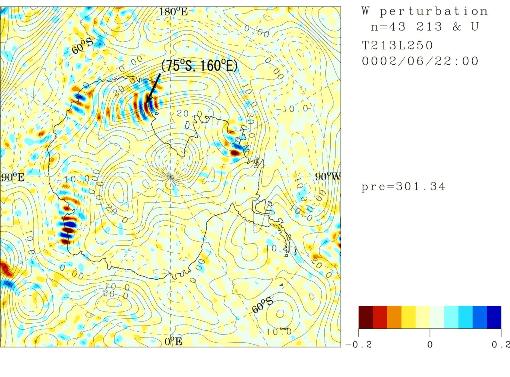
Fig. 57: Fig. 54 and the same figure having shown difference between T213 experiment and T106 experiment Thus, the increase in the horizontal resolution of AGCM made the momentum transfer by a small-scale gravity wave increase, and bringing about middle atmosphere general circulation more realistic than the result was shown. This result is qualitatively in agreement with the simulation result performed by GFDL SKYHI GCM (Hamilton et al.1999). By using perpendicular resolution (L250) higher than SKYHI in our experiment, about the position where perpendicular propagation of a gravity wave and change of the character accompanying it can be expressed more appropriately, and especially the maximum of a winter polar night jet exists, it is nearby low latitude, and is more realistic than their result. In addition, the second peak of the west wind of the high latitude of a winter mesosphere was also reproduced (Fig. 56 left). On the other hand, since it is still a little stronger than observation about the maximum wind speed of a polar night jet, if the high experiment of horizontal resolution is conducted more, it has left a possibility that the structure of a jet will become more realistic. e-3. Analysis about influence in the orographic gravity wave which a katabatic wind excites on the South Pole, and its middle atmosphere (Watanabe et al.2005) As introduced for the preceding clause, when horizontal resolution of AGCM was set to T213 from T106, it became the size which cannot disregard the momentum flux by the gravity wave spread from near the South Pole of winter to the sky. In order to investigate this cause, analysis which observed near the South Pole of the winter of T213L250 AGCM was conducted. It became clear that the katabatic wind which blows a slope to a sea surface and gets down from the South Pole ice sheet in the result, especially the Ross Sea west coast excites an orographic gravity wave for the first time. Fig. 58 is June 22 00 standard time of 213LT250 experiment. The turbulence (here, it is regarded as a gravity wave ingredient) with a level wavelength of less than 1000km of the perpendicular style and the 300hPa side horizontal distribution of the zonal wind used as a background are shown. In the area along the shore near an east longitude 60-right angle, the wave train on a par with orientation about parallel to the seashore is seen. This wave is considered to be the orographic gravity wave produced when the cold katabatic wind which runs down the slope of the South Pole ice sheet overcame the geographical feature on the South Pole ice sheet. However, since this gravity wave appears in the inside of the east style, it cannot be spread into a west wind high up in the sky. On the other hand, the wave train located in a line with the seashore and the orientation which goes direct is seen in the Ross Sea west coast. Since the west wind is blowing the Ross Sea west coast, if this wave is an orographic gravity wave, a possibility of spreading the inside of the west wind of the stratosphere and affecting the atmosphere high up in the sky will come out.
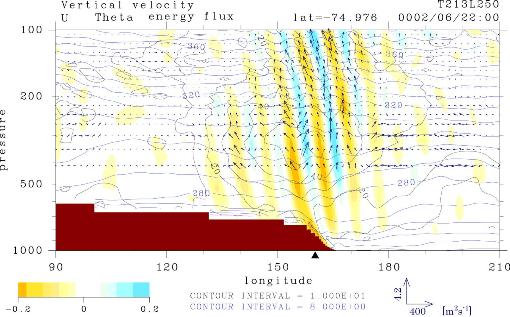
Fig. 58: T213L250 Zonal wind used as the turbulence (color) of the perpendicular style of under level wavelength 1000 km in AGCM 300 hPa, and a background (isoline interval: 5 ms-1). Fig. 59 is a longitude-advanced sectional view which expanded Ross Sea West Kishibe along with the latitude circle of south latitude 75 degrees. As for a color, in the perpendicular style, a black isoline expresses the zonal wind of a background and a blue isoline expresses potential temperature, respectively. The arrow shows the energy flux by a under level wavelength 1000 km ingredient. The seashore is in the 160 east longitudes about, and the katabatic wind of a strong west wind from which it blows and gets down along the slope has appeared. West winds are more than 30 ms-1 and downward flow. It is strength called -0.25 ms-1. Over the slope of the seashore, sedimentation of an air pillar has arisen in the large advanced range, and the structure of the wave carried out clearly is extended to the lower stratosphere in the leeward side. Energy flux is extended from the seashore to the lower stratosphere like these waves, and it is shown that this wave is an orographic gravity wave. An orographic gravity wave is usually seen on the leeward of mountains, and although accompanied by blocking of the flow produced by mountains up mountains' windward in many cases, the gravity wave is excited in this case by the katabatic wind which blows the cliff of the ice of the seashore and gets down from it. The level wavelength of this gravity wave in the lower stratosphere is about 220 km, a perpendicular wavelength is about 11 km, and it turned out that the breaking wave is spread and carried out to a mesosphere.
Fig. 59: Background zonal wind (black isoline) of perpendicular style (color) in the 75 south latitude, longitude-advanced sectional view of potential temperature (blue isoline). An arrow is the energy flux by a under level wavelength 1000 km ingredient. Fig. 60 Level wavelength 1000 which averaged Fig. 60 by atmospheric pressure 1-0.1hPa to the vertical direction, and was averaged in the period on 21-June 28 The horizontal distribution of an acceleration slowdown of the zonal wind by under km ingredient is shown. A warm color system expresses the slowdown of a west wind. An arrow expresses horizontal circulation. An isoline shows a geopotential height. It turns out that the center of a polar vortex shifts in the 30 west longitude direction from the South Pole, and it is located. The west wind jet of a mesosphere is near the 40 to 50 south latitude about, and the slowdown of a strong west wind has produced it with loss of a gravity wave there. On the other hand, over the South Pole, there is a slowdown region of the west wind isolated over Ross Sea. This is brought about by the orographic gravity wave seen in Figs. 58 and 59. The slowdown of this local west wind acts like an obstacle at the horizontal circulation place of the background style, and produces ageostrophic wind circulation. In the upstream of this slowdown region, the flow which crosses a contour line and goes in the direction of a center of circumpolar whirl has arisen, and the flow which goes to the outside orientation of circumpolar whirl has produced the downstream side. Such an effect may have big influence on transportation and the mixing process of the substance in the inside of a polar vortex. In addition, the level wavelength of an orographic gravity wave needs the experiment of high resolution for a quantitive understanding, in order to be greatly dependent on the horizontal resolution of AGCM.
Fig. 60 June 21-28, zonal wind or slowdown horizontal distribution (color) by under level wavelength 1000 km ingredient averaged by 1-0.1hPa. Isoline: Geopotential height [m]. Arrow: Level wind. e-4. Improvement of Hines parameterization (Watanabe 2005) It has tried to derive the information on the non-orographic sauce given to Hines parameterization from the result of high resolution AGCM since the last fiscal year. It became the first problem from the result of high resolution AGCM what kind of information is inputted into Hines parameterization. In original code, distribution (8 direction ingredients) of the level wind velocity about the gravity wave in initial altitudes (tropopause etc.), an excellence level wavelength, and the level wind velocity and lift frequency of a background place (large-scale place) be inputted from the outside, and momentum flux be computed from the cut-off perpendicular wavelength compute based on an original theory using the dispersion relation of the gravity wave which gave inside frequency band approximation inside Hines parameterization. That is, the input about a gravity wave was 8 direction ingredients and the excellence level wavelength of level wind velocity distribution. Although the distribution and the level wavelength which were computed using the hodographic analysis and perpendicular spectral analysis which are usually used in point observation at first were inputted, distribution of the obtained momentum flux was seldom in agreement with the result of the original high resolution AGCM. The problem of this technique had that not the quantity of a certain advanced side but the amount of averages of a certain advanced range will be calculated, and the large error of the own natural period which can be found in hodographic analysis, and it was that it becomes impossible to also disregard the error of the excellence level wavelength which can be found as a result. The improvement extensive to a result was found by inputting into Hines parameterization with level distribution in quest of the momentum flux of one layer of initial altitudes from the result of direct AGCM, and finally, changing a code so that the excellence level wavelength which balances those momentum flux and level distributions inside may be computed. It became one more problems that advanced change of the momentum flux calculated by Hines parameterization is not in agreement with the result of high resolution AGCM. Two problems became clear from the result of the sensitivity experiment which the level wind velocity distribution inputted into the detailed analysis and Hines parameterization of an AGCM result was changed, and performed it. One is that the gravity wave has spread in the direction of latitude especially by AGCM to Hines parameterization not taking the horizontal transmission of a gravity wave into consideration by a perpendicular one plane. About this point, three dimension-ization of Hines parameterization must be disregarded from it being difficult for theoretical and a calculation science target. Another was that distribution of level wind velocity required for loss of the same gravity wave as an AGCM result to arise needs to be large in Hines parameterization as compared with the result of AGCM. Although this very thing was the problem of a theoretical design of Hines parameterization, the momentum flux substituted for an initial altitude was not changed, and the big improvement was found by giving the tuning which enlarges the value of distribution of level wind velocity about 3 times. This is equivalent to the excellence level wavelength calculated inside becoming long. Distribution of the gravity wave resistance in the inside of winter hemisphere and high latitude calculated by Hines parameterization became a near more realistic thing by the high resolution AGCM result through the above improvement. Fig. 61 is the acceleration slowdown (left row) of the zonal wind by the gravity wave with a level wavelength of less than 1000km which averaged December 21 to 28 days of T213L250AGCM. The acceleration slowdown (right row) of a zonal wind by the momentum flux of the gravity wave for which it asked in respect of 70hPa of T213L250AGCM, and the gravity wave which inputted level wind velocity decentralization into Hines parameterization, and carried out off-line calculation under the background place which carries out time diversification and by which the parameter rise was carried out is shown. A right row is a result when giving the tuning described above. Although Hines parameterization tends to overestimate a zonal wind acceleration slowdown in an up mesosphere, the tolerably quantitive coincidence including regional distribution is obtained in the other station.
Fig. 61: Level wavelength 1000 Acceleration slowdown of the west wind by the gravity wave of under km (December 21 -28 daily mean). A T213L250 AGCM result (left row) and Hines parameterization (right row). Isoline: Zonal wind. Upper row: Horizontal distribution of 1-0.1 hPa average. Lower berth: Beltlike par latitude-advanced distribution. Since the thing of the off-line calculation performed by the result of Hines parameterization inputting the background place of T213L250 AGCM has the same zonal wind distribution. It is expected also by the integrated model of horizontal resolution T42 by performing future still finer tuning the structure of a polar night jet, seasonal advance of a high latitude lower stratosphere temperature place, and that Equator QBO etc. can reappear actually further. f. ConsiderationThe extension to the middle atmosphere of an integrated model and introduction of a physical process required in the stratosphere were able to deepen mist and an understanding of each process connected to improvement of non-orographic gravity wave resistance parameterization analyzing the result of high resolution AGCM although it is behind from the original schedule. It is important to perform the tuning which was able to balance dynamics process and a physical process to the integrated model after extending to a middle atmosphere from now on. For example, problems, such as coexistence (balance of cumulus convection parameterization and Hines parameterization) of tropical convective precipitation and the reproducibility of Stratosphere QBO and coexistence (balance of the rate of radiant heating and orographic gravity wave resistance parameterization) of the temperature near the tropopause and the reproducibility of troposhere subtropical jet distribution, are important. In the process which tunes up Hines parameterization finely, it is thought that it is necessary to conduct the experiment using high resolution AGCM continuously. Acknowledgement :Calculation of this research was performed using the Earth Simulator. GFD-DENNOU Library and GTOOL were used for drawing. g. BibliographyAmodei, M., S. Pawson, A.A. Scaife, U. Langematz, W. Lahoz, D.M. Li and P. Simon, The SAO and Kelvin waves in the EuroGRIPS GCMS and the UK Met. Office analyses, Ann. Geophys, 19, 99-114, 2001. Garcia, R.R., T.J. Dunkerton, R.S. Lieberman and R.A. Vincent, Climatology of the semiannual oscillation of the tropical middle atmosphere, J. Geophys. Res., 102, 26019-26032, 1997. Hamilton, K., R. J. Wilson, and R. S. Hemler, Middle atmosphere simulated with high vertical and horizontal resolution versions of a GCM: Improvements in the cold pole bias and generation of a QBO-like oscillation in the tropics, J. Atmos. Sci., 55, 3829-3846, 1999. Hines, C. O., Doppler-spread parameterization of gravity?wave momentum deposition in the middle atmosphere. Part 2: Broad and quasi monochromatic spectra, and implementation, J. Atmos. Solar Terr. Phys., vol.59, no.4, pp.387-400, 1997. Kawamiya, M., C. Yoshikawa, H. Sato, K. Sudo, S. Watanabe and T. Matsuno, Development of an Integrated Earth System Model on the Earth Simulator, in preparation, 2005. Takahashi, M., Simulation of the quasi-biennial oscillation using a general circulation model, Geophys. Res. Lett., 26, 1307-1310, 1999. Watanabe, S. Explicit simulation of gravity waves and its use for investigating performance of gravity wave drag parameterizations. Part 1: Results of a T213L250 GCM, in preparation, 2005. Watanabe, S., K. Sato, and M. Takahashi, Orographic gravity waves over Antarctica excited by Katabatic winds; a GCM study, Geophys. Res. Lett., 32, doi:10.1029/2005GL023084, 2005 (submitted). Watanabe, S. and M. Takahashi, Kelvin waves and ozone Kelvin waves in the QBO and SAO; a simulation by a high-resolution chemistry-coupled GCM, J. Geophys. Res., 110, doi:10.1029/2004JD005424, 2005 (submitted). h. The announcement of a resultA contributed paper Watanabe, S., K. Sato, and M. Takahashi, Orographic gravity waves over Antarctica excited by Katabatic winds; a GCM study, Geophys. Res. Lett., 32, doi:10.1029/2005GL023084, 2005 (submitted). Watanabe, S. and M. Takahashi, Kelvin waves and ozone Kelvin waves in the QBO and SAO; a simulation by a high-resolution chemistry-coupled GCM, J. Geophys. Res., 110, doi:10.1029/2004JD005424, 2005 (submitted). The oral announcement in an international society, poster announcement : S. Watanabe and M. Takahashi, Kelvin waves and ozone Kelvin waves in the QBO and SAO; a simulation using a high-resolution chemistry-coupled GCM, Quadrennial Ozone Symposium, June 1-8, Kos, Greece. S. Watanabe and T. Nagashima, A quantitative comparison of gravity waves simulated by a high-resolution GCM to those calculated within the Doppler spread parameterization, SPARC 3rd general assembly, August 1-8, Victoria, Canada. S. Watanabe and M. Takahashi, Intraseasonal Oscillation in the Equatorial Mesosphere (60-80km) Appeared in a GCM, International workshop on equatorial and low latitude atmosphere studies by MLT radar network observations, January 18, Uji, Kyoto. |
![21-figure months [ 60:6 ] 28 and 1-0.1 The zonal wind or slowdown horizontal distribution (color) by a under level wavelength 1000 km ingredient averaged by hPa](./figure/2004-60.jpg)