Advanced Visualization and Perception Research Group/Research
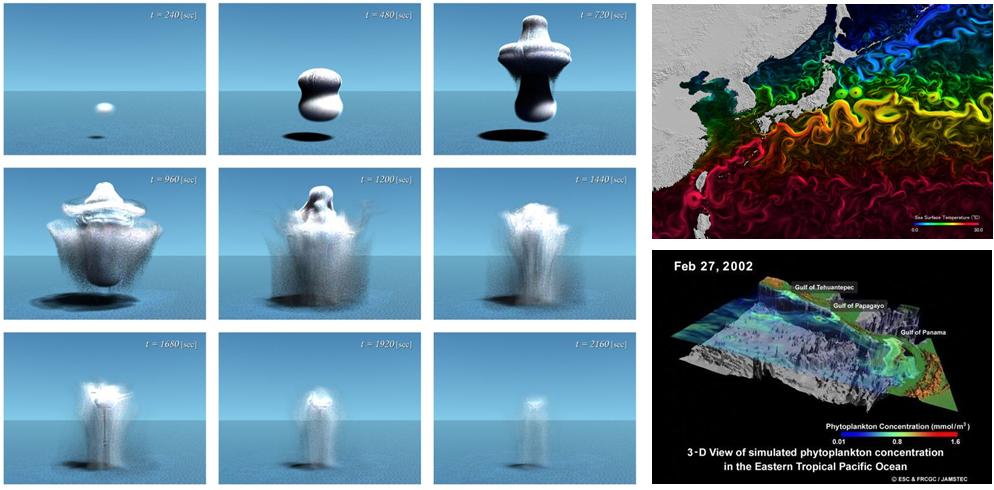
Data visualization is an indispensable step in the simulation researches. We can extract hidden information behind massive numerical data only through the visualization. When the output data to be visualized are small enough, simple graphs or charts are sufficient to understand what happened, or simulated, in the computer. However, when the data size becomes large, more sophisticated methods or tools than simple graphs are required for the data visualization. Although a lot of visualization software and hardware have been developed so far, the Earth Simulator produces super-large scale of data that is beyond the "traditional" visualization tools and methods. The scale difference between the simulations by the Earth Simulator and other supercomputer makes qualitative, rather than quantitative, differences of the visualization difficulty. Therefore, we have to investigate high performance visualization algorithms and software for the Earth Simulator by ourselves. The purpose of the data visualization is to grasp the structure or information hidden behind the data sea. The simulation researchers can have clear "image" of the simulated phenomena only after they analyze the output data by the visualization. The next step is to convey the image to other researchers and non-researchers. This is the data representation, which is another research topic of the Advanced Visualization and Perception Research Group. The data representation spans wide variety of researches; photo-realistic image generation, easy-to-use presentation software/hardware of 2D and 3D objects, advanced rendering algorithm, and so on. One of the focused technologies in our research and development is the virtual reality (VR). Our VR system is described in other page. We investigate the application of advanced VR technology to the large scale data visualization and representation.
 |