Press Releases
JAMSTEC
Kagawa University
Tsunamigenic subduction structure identified in Southern Ryukyu Trench
- Based on observation of plate boundary faults and low-frequency earthquakes -
Overview
A research team led by Dr. Ryuta Arai at Research and Development Center for Earthquake and Tsunami, the Japan Agency for Marine-Earth Science and Technology (JAMSTEC: Asahiko Taira, President) carried out seismic experiments using refraction*1 and reflection methods*2 , and passive seismic observation with ocean bottom seismometers in the southern Ryukyu Trench. They revealed that low-frequency earthquakes*3 occur along the plate interface, and that high-pressure fluids, which are likely to trigger such earthquakes, exist there. In addition, they found that the plate interface and a branching fault form a low-velocity wedge at the trench. The wedge structure coincides with one of the estimated source models of huge tsunami during the Yaeyama earthquake in 1771.
The team's detailed analysis confirmed that the plate interface in the southern Ryukyu Trench is dominated by slow earthquakes, including tsunami earthquakes, low-frequency earthquakes and slow slip events, from shallow to deep parts almost seamlessly and thus a typical interplate locked zone like Nankai Trough may be missing.
These new findings of the characteristics of the plate interface and the branching fault should help better understand the mechanisms of tsunami generation and propagation in this region.
This study was supported by the research project for compound disaster mitigation on the great earthquakes and tsunamis around the Nankai Trough region by the Japanese Ministry of Education, Culture, Sports, Science and Technology.
The above study results were published in Nature Communications on July 22, 2016 (JST).
Title: Structure of the tsunamigenic plate boundary and low-frequency earthquakes in the southern Ryukyu Trench
Authors: Ryuta Arai1, Tsutomu Takahashi1, Shuichi Kodaira1, Yuka Kaiho1, Ayako Nakanishi1, Gou Fujie1, Yasuyuki Nakamura1, Yojiro Yamamoto1, Yasushi Ishihara1, Seiichi Miura1, Yoshiyuki Kaneda2
1. JAMSTEC
2. Kagawa University
*1 Refraction method
The refraction method uses seismic refractions (refracted waves) to measure the velocity of the materials through which the waves travel. Acoustic waves generated by air-gun shots propagate downward through the water column and crust, and then are refracted back to the seafloor. Ocean bottom seismographs deployed at a regular interval on the seafloor record the refraction waves. Based on travel times of refracted P-wave (primary wave, which is the fastest to arrive) and reflected waves from structural boundaries (plate boundary and Mohorovičić discontinuity), P-wave velocity of the crust and locations of reflection interfaces are estimated.
*2 Reflection method
The reflection method is to estimate sub-seafloor structure and properties by analyzing arrival time and amplitude of near-vertical seismic reflections. Acoustic waves generated by air-gun shots propagate downward through the waver column and crust, and then are reflected back to the sea surface. The reflected waves are captured by a streamer cable with hydrophones towed at the sea surface.
*3 Low-frequency earthquakes (LFEs)
Compared with regular earthquakes, LFEs are enriched in low frequency components of 10Hz or less. High-pressure fluids are considered to be an important factor for causing these earthquakes.
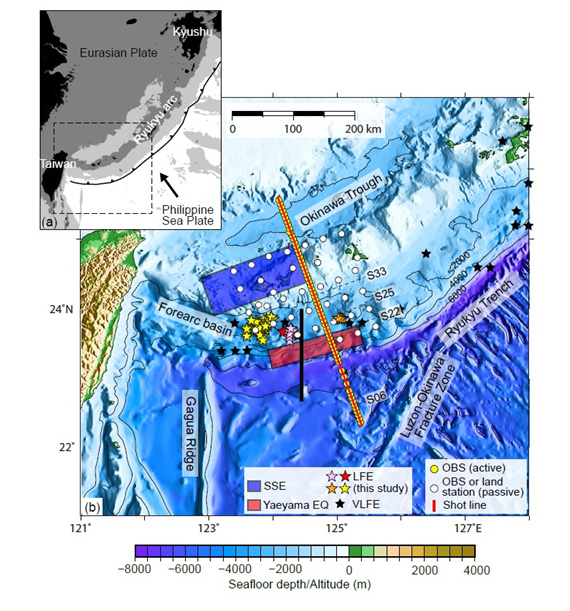
Figure 1. Layout of the seismic experiment
(a) Regional tectonic map of the Ryukyu subduction zone. Areas above sea level are shaded black, and seafloors shallower than 1,000 m and 4,000 m below sea level are shaded dark grey and light grey, respectively. Black arrow indicates the convergence direction of the Philippine Sea plate with respect to the Eurasian plate. (b) Bathymetric map of the southern Ryukyu. Background colors represent seafloor depth in meter, with contours every 2,000 m. Yellow and white circles indicate the positions of ocean-bottom seismographs (OBSs) for active and passive sources, respectively. Air gun shots were carried out on the red line. Low-frequency earthquakes (LFEs) detected by this study (colored stars) consist of four sequences and their colors correspond to different sequences of LFEs (sequence-A to -D). Black stars indicate epicenters of very low frequency earthquakes (VLFEs) observed in the past. The source regions of the Yaeyama earthquake in 1771 and repeating slow slip events (SSEs) are shown by a red and blue square, respectively.
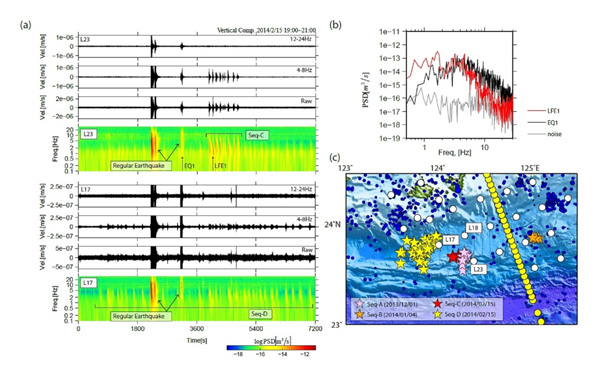
Figure 2. Seismic records and distribution of low-frequency earthquakes (LFEs)
(a) Band-pass-filtered and raw seismograms and spectrograms of velocity waveforms for sequence-C at ocean bottom seismograph (OBS) L17 and for sequence-D at OBS L23. It is noted that LFEs are enriched in low-frequency (4-8 Hz) energy and depleted in high-frequency (12-24 Hz) energy although regular earthquakes show clear signals in the both frequency bands. (b) Comparison of power spectral density (PSD) of the selected LFE, regular earthquake and background noise. (c) Epicenters of LFEs (stars) and regular earthquakes (blue dots). Colors of the stars correspond to different sequences of LFEs (A to D). Yellow and white circles indicate the positions of OBSs for active and passive sources, respectively. It is noted that hypocenter locations of sequence-C were accurately determined by manually picked arrival times, while only epicentral locations were constrained by the envelope correlation method for sequence-A, -B, and -D.
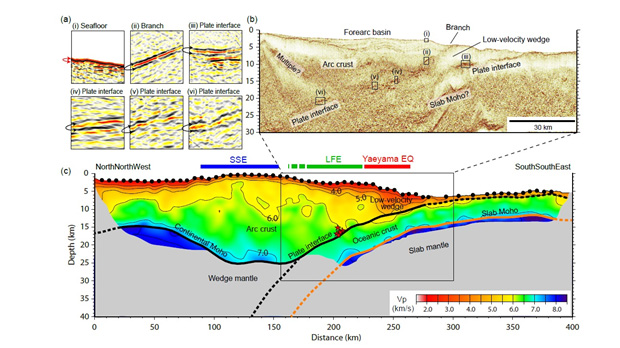
Figure 3. Seismic structure of the southern Ryukyu Trench
(a, b) Seismic reflection images. A negative polarity at the branch (panel ii) and at several locations of the plate boundary (panes iii-vi) suggests a sudden velocity reduction probably due to high pore fluid pressures. The locations of the branch and low-velocity wedge overlap a source region of the Yaeyama earthquake tsunami in 1771 indicated by a previous study. It is likely that seismic slips in the branch faults or shallow parts in the plate boundary are related to tsunami generation. (c) P-wave velocity model. Black dots show the locations of ocean bottom seismographs (OBSs). Areas with poor checkerboard recovery are masked. Thick black and orange lines indicate locations of the plate boundary/continental Moho and the Moho of the incoming oceanic plate, respectively. Dashed parts of these bold lines are not constrained by the data. Red stars in (c) indicate the locations of the low-frequency earthquakes (LFEs) (sequence-C in Fig. 2). The source regions of the Yaeyama earthquake in 1771 and slow slip events (SSEs) are shown above the P-wave velocity model by red and blue bars, respectively. The distribution of LFEs (green bar) bridges the spatial gap between these two regions.
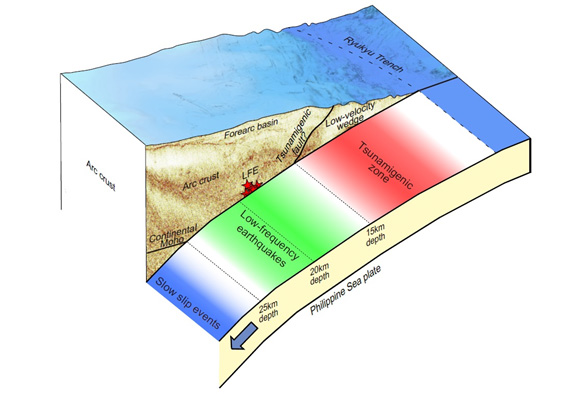
Figure 4. Perspective view of the subduction structure and distribution of low-frequency earthquakes (LFEs) at the southern Ryukyu Trench
Red stars in the reflection image indicate the locations of the LFEs (sequence-C in Fig. 2). In the shallow part of the subduction zone (red zone), a branch from the plate interface may have acted as a tsunamigenic fault. The observed LFEs occur at 15-18 km depths along the plate interface, and their distribution (green zone) bridges the gap between the shallow tsunamigenic zone (red zone) and the deep slow slip region (blue zone). It is considered that no asperities are likely to exist there.
Contacts:
- (For this study)
- JAMSTEC
- Ryuta Arai, Scientist, Research and Development (R & D) Center for Earthquake and Tsunami (CEAT)
- Tsutomu Takahashi, Senior Scientist, Research and Development (R & D) Center for Earthquake and Tsunami (CEAT)
- (For press release)
- JAMSTEC
- Tsuyoshi Noguchi, Manager, Press Division, Public Relations
- Kagawa University
- Toyohiro Maekawa, Deputy Director of Public Relations Office