Press Releases
JAMSTEC
Precursory Signal for Stagnant Bonin Slab to Penetration into Lower Mantle
- Implications of Unusually Deep Bonin Islands Earthquake on May 30, 2015 -
Overview
Dr. Masayuki Obayashi at Department of Deep Earth Structure and Dynamics Research, the Japan Agency for Marine-Earth Science and Technology (JAMSTEC: Asahiko Taira, President) and his colleagues analyzed an M7.9 earthquakeoccurred on May 30, 2015 at an unusual depth of 680-km downward and away from the well-defined Wadati–Benioff (WB) zone of the southern Bonin arc (“Bonin super deep (BSD) earthquake”). The analysis integrates 1) morphological changes of the subducting Pacific slab*2 based on a seismic tomography*1 model and their relationship with the BSD earthquake; 2) hypocentral distribution and focal mechanisms of the mainshock and aftershocks; and 3) deformation around the hypocenter induced by past WB zone seismicity.
The results suggest that it is likely that the horizontal bending slab along the 660-km discontinuity begins to penetrate into the lower mantle from its bending portion and the BSD earthquake was a precursory signal to slab penetration. The BSD earthquake and its aftershocks may be regarded as forerunners of WB zone earthquakes at greatest depths in the near-vertically downgoing Bonin slab continuing all the way from the surface. The penetration process of the horizontal slab into the lower mantle shown in this study provides a clue to better understand plate dynamics on a global scale.
This work was supported by JSPS KAKENHI Grant Number JP25287116 and JP25247074. The above results were published in the online Earth and Planetary Science Letters on December 5, 2016 (JST).
Title: Unusually deep Bonin earthquake of 30 May 2015: a precursory signal to slab penetration?
Authors: Masayuki Obayashi1, Yoshio Fukao2, Junko Yoshimitsu1
1. Department of Deep Earth Structure and Dynamics Research, JAMSTEC
2. Research and Development Center for Earthquake and Tsunami, JAMSTEC
*1 Seismic tomography: It is an imaging technique to create three-dimensional images of Earth's interior based on arrival time and waveform data of seismic waves.
*2 Slab: It refers to subducted oceanic plate.
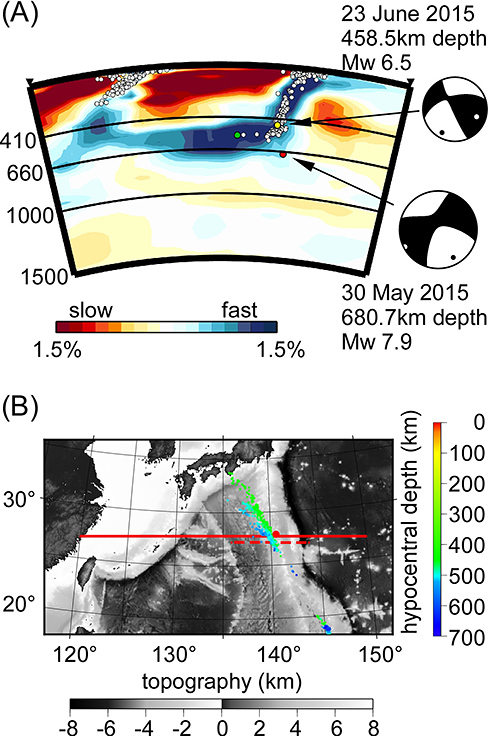
Figure 1. Location of the BSD shock.
(A) The east-west crosssection (solid red line in (B)) of the GAP_P4 model. White dots indicate the hypocenters (Engdahl et al., 1998) within a band 50 km wide on both sides of the section plane. The focal mechanisms of the BSD shock and a subsequent earthquake on June 23, 2015 are projected onto the section plane. Black and white dots on the focal mechanism indicate the maximum and minimum compression directions, respectively. (B) Geographical location of the BSD shock (red dot). The hypocenters below 400 km are shown by colors varying with depth. The three broken red lines are referred to in Figures 4.
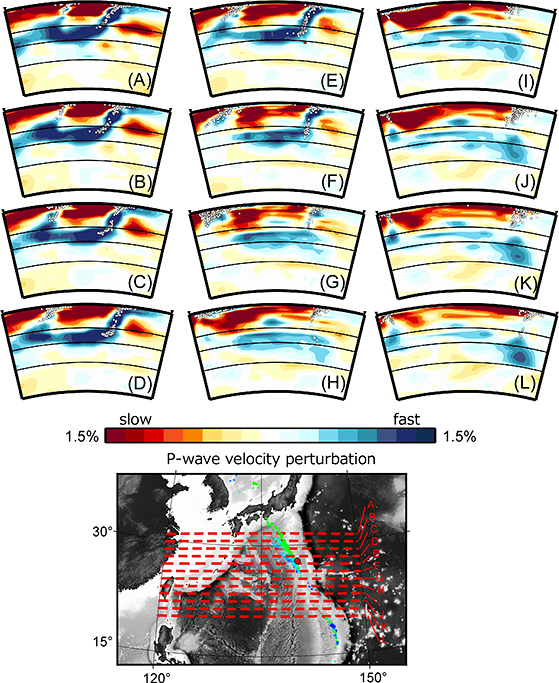
Figure 2. Successive cross-sections of the GAP_P4 model across the northern Bonin (A-D), southern Bonin (E-H) and northern Mariana (I-L) arcs. The profiles of the cross-sections are shown in the bottom map. Section (E) is the same as in Figure 1A. The three depth lines indicate 410 km, 660 km and 1000 km.
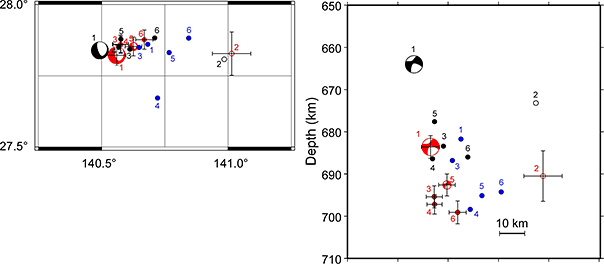
Figure 3. Locations of the BSD shock and its aftershocks. The events are numbered in temporal order. Events 1 and 5 are the main shock and largest aftershock. The locations from this study, the USGS-NEIC (National Earthquake Information Center) and the JMA (Japan Meteorological Agency) are shown in red, black and blue, respectively. This study's result is shown with error bars. Open circles indicate the location of Event 2 (not reported by JMA) calculated using less than 20 stations. Closed circles indicate the locations of all the other events calculated using more than 60 stations. The CMT solution of the mainshock (Event 1) and the inferred focal mechanism of the largest aftershock (Event 5) are shown at the relocated hypocenters. Right: Projection onto the horizontal plane. Left: Projection onto the section plane in the Figure 1A.
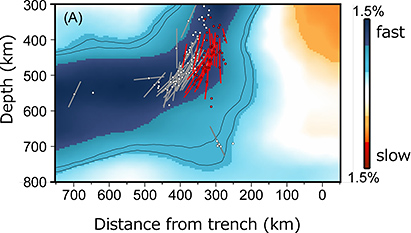
Figure 4. Cross-sections of the GAP_P4 model across the southern section of the northern Bonin, showing principal compressional axes. Shown in the gray bars are directions of compression axes inferred from the focal mechanism and earthquakes within a band 100 km wide on the northern sides of the section plane, and the red on the southern side.
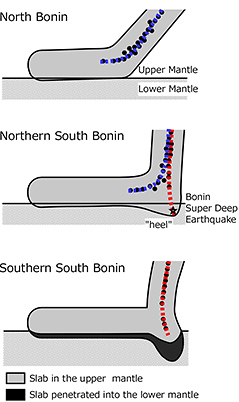
Figure 5. Morphological changes of subducting slabs in the northern and southern Ogasawara and direction of principal compression axes in the slabs inferred from the WB zone deep earthquakes, which are shown in the dotted lines. The blue and red dotted lines indicate the compression axes aligned with the horizontally bending slab and aligned near-vertically toward the heel. The black dots indicate hypocenters.
Contacts:
- (For this study)
- Masayuki Obayashi, Senior Scientist, Department of Deep Earth Structure and Dynamics Research
- (For press release)
- Tsuyoshi Noguchi, Manager, Press Division, Public Relations Office