Press Releases
JAMSTEC
Shallow Fault Slip during 2011 Tohoku-oki Earthquake Quantified
- Clue to understand characteristic of shallow slip near trench axis -
Overview
A research team formed by University of Victoria, Pacific Geoscience Centre in Canada with Dr. Shuichi Kodaira and Dr. Toshiya Fujiwara at Research and Development Center for Earthquake and Tsunami, the Japan Agency for Marine-Earth Science and Technology (JAMSTEC: Asahiko Taira, President) evaluated fault slip distribution across the trench axis during the 2011 Tohoku-oki earthquake using three-dimensional elastic finite element model that incorporates actual fault geometry and long-wavelength bathymetry.
During the 2011 Tohoku-oki earthquake, a very large slip occurred on the shallowest part of the subduction megathrust. Quantitative information on the shallow slip is very important to distinguish between different rupture mechanics and understanding the generation of the ensuing devastating tsunami. However, the magnitude and distribution of the shallow slip have not been clear mainly due to the lack of near-trench constraints. To quantify the shallow slip, the research team has modelled high-resolution bathymetry differences before and after the earthquake across the trench axis. As a result, the average slip is determined to be about 62 m over the most near-trench 40 km of the fault with a gentle increase towards the trench. This slip distribution indicates that marked net weakening or strengthening of the shallow fault did not occur during the Tohoku-oki earthquake.
The above study results were published the online Nature Communications on January 11, 2017 (JST).
Title: Large fault slip peaking at trench in the 2011 Tohoku-oki earthquake
Authors: Tianhaozhe Sun1, Kelin Wang2,1, Toshiya Fujiwara3, Shuichi Kodaira3, Jiangheng He2
1. School of Earth and Ocean Sciences, University of Victoria, Canada
2. Pacific Geoscience Centre, Geological Survey of Canada, Canada
3. Research and Development Center for Earthquake and Tsunami, JAMSTEC
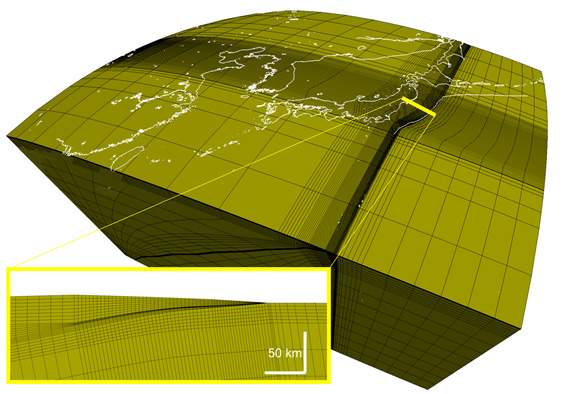
Figure 1. A three-dimensional elastic finite element model used for synthetic differential bathymetry (SDB) calculation. The left below is a cross-section view along the analyzed corridor.
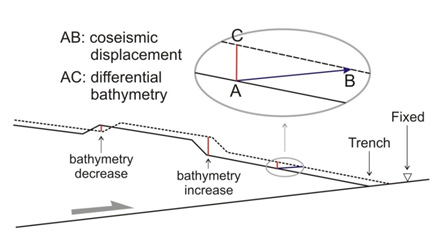
Figure 2. Cartoon illustration of the generation of differential bathymetry by a trench-breaching subduction earthquake. Solid and dashed lines show the bathymetry before and after the earthquake, respectively. While coseismic deformation is of long wavelength, local seafloor slope variations can lead to coherent short-wavelength features of bathymetry decrease or increase.
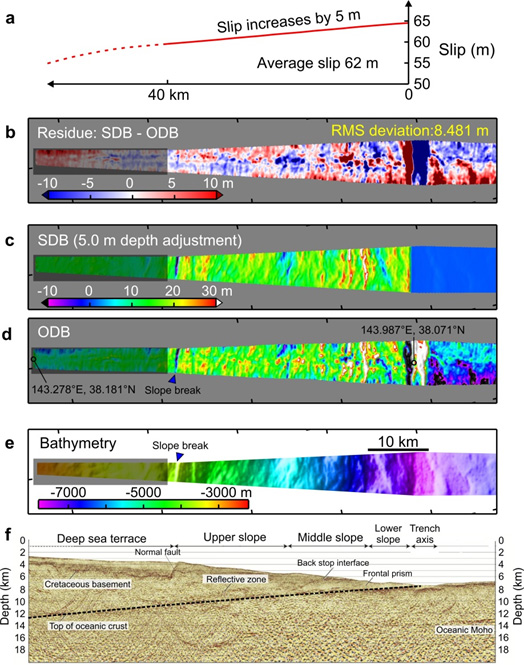
Figure 3. The optimal SDB model along the analyzed corridor. The location of the corridor is shown in Figs. 1 and 4 insets. (a) Fault slip distribution over the most seaward 40 km. (b) Residue between the SDB (c) and 1999–2011 observed differential bathymetry (ODB) (d). (c) SDB produced using the slip distribution shown in a. (d) 1999–2011 ODB. (e) Bathymetry acquired in 1999. The deep sea terrace segment (<3,500 m; shadowed in b–e) has large uncertainties in water sound speed and the interpreted seafloor depth, and submarine landslides at the trench axis are not modelled in the SDB. Therefore, these segments as well as that seaward of the trench are not included for calculating the root mean square deviation. (f) Seismic reflection section along the same track. Thick dashed line shows the megathrust fault.
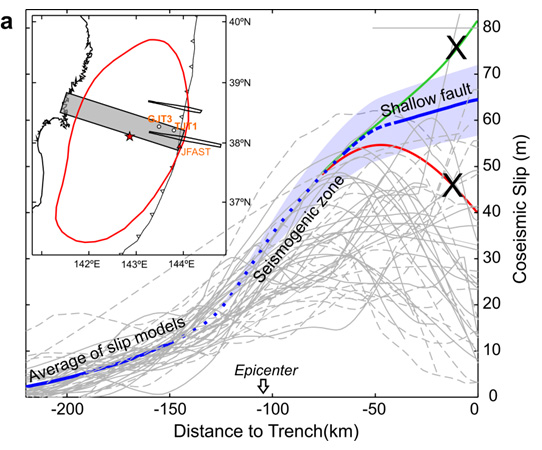
Figure 4. Illustrations of different mechanical behaviours of the shallow fault and their resultant slip distributions along the corridor rejected and supported by SDB modelling. It also shows comparison between the optimal shallow fault slip of this work (blue line) and the 45 published slip models. The error range (blue shading) is based on models with root mean square deviation <8.55m. Dotted part of the blue line is a hand-drawn, poorly constrained smooth connection between the near-trench slip determined in this work and the slip further downdip based on an average of the 45 slip models. Slip scenarios represented by the green (coseismic weakening) and red (velocity-strengthening) lines are not supported by the SDB analysis.
Contacts:
- (For this study)
- Toshiya Fujiwara, Senior Research Scientist, Research and Development Center for Earthquake and Tsunami
- (For press release)
- Tsuyoshi Noguchi, Manager, Press Division, Public Relations Office