Press Releases
JAMSTEC
New Study Identifies Decadal Climate Predictability
Using Sea Surface Temperature Data
- Efforts may help mitigate climate risks over southern Africa -
Overview
Decadal climate variability in the southern Indian Ocean could be predicted up to 10 years ahead, according to a study led by Dr. Morioka at Application Laboratory, the Japan Agency for Marine-Earth Science and Technology (JAMSTEC: Asahiko Taira, President) and his colleagues. To investigate the predictability, the scientists have used sea surface temperature (SST) observation data during 1982 to 2015 to initialize a state-of-the-art coupled general circulation model, the Scale Interaction Experiment Frontier Research Center 2 for Global Change (SINTEX-F2*) with a simple SST-nudging scheme. Their decadal reforecast experiments demonstrated moderately high prediction skills of yearly mean SST in the southwest Indian Ocean at 10-year lead time.
In the southwest Indian Ocean, SST changes slowly, not only seasonally or annually, but on 10- to 20-year timescales. Such decadal climate variability in the southern Indian Ocean influences climate variation over southern Africa through modulations in atmospheric circulation. Through associated changes in precipitation, the decadal variability influences the river flow, crop yields and incidence rate of infectious diseases such as malaria. Efforts have been made to predict the decadal climate variability by using climate models initialized with multiple observation data from atmosphere, ocean and sea ice. The observation data are, however, not always sufficient for prediction of long-term variability, especially in southern Indian Ocean where the internally generated decadal variability is pronounced.
These study results are very remarkable; they presented a simple method that enables higher predictability of decadal climate variability even with SST observations alone for initialization of climate models. It means that the predictability dating back to older years could be further examined in the Northern Hemisphere, where SST data over longer period are available. Although there is still some disagreement in the atmospheric circulation anomalies between the observation and the model experiments, further improvement in model physics and initialization scheme would contribute to successful prediction of most if not all decadal climate variability over southern Africa. In the near future, this effort would eventually help in mitigating potential risks to the region by taking appropriate measures based on the predicted climate.
The above study results were published in Scientific Reports on January 26, 2018 (JST).
Title: Decadal climate predictability in the southern Indian Ocean captured by SINTEX-F2 using a simple SST-nudging scheme
Authors: Yushi Morioka1, Takeshi Doi1, Swadhin K. Behera1
1. Application Laboratory, JAMSTEC
*SINTEX-F2 is an upgraded version of SINTEX-F1, a high-resolution coupled model developed in 2005. The system is used to predict seasonal anomalies of atmospheric and ocean circulations. Seasonal prediction using the system is released every month.
( http://www.jamstec.go.jp/frcgc/research/d1/iod/seasonal/outlook.html )
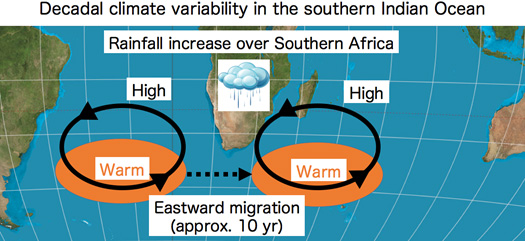
Figure 1. Schematic diagram of decadal climate variability in southern Indian Ocean
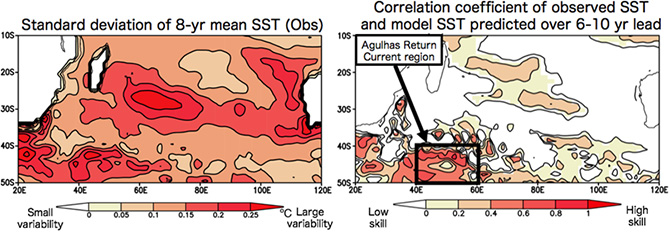
Figure 2. (Left) Standard deviation of decadal sea surface temperature (SST) anomalies (°C) in the observation. 8-yr running mean was applied to calculate decadal SST anomalies. (Right) Anomaly correlation coefficient (ACC) of the 5-yr mean SST anomalies between the observation and reforecast experiments over 6-10 year lead times. The significant ACCs above the persistence values are colored. The black box square area is the Agulhas Retroflection region (40-60°E and 40-50°S), which has indicated higher predicatbility of the model.
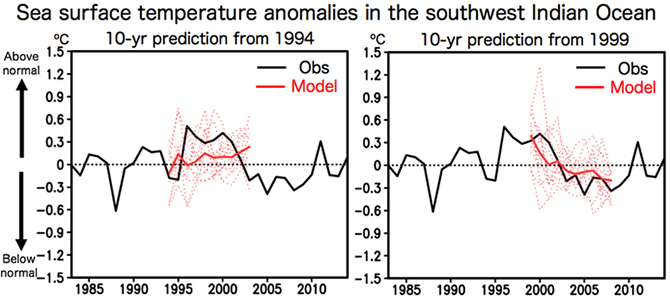
Figure 3. (Left) Time series of yearly mean SST anomalies (in °C) averaged in the southwest Indian Ocean (black square box in the right panel of Fig. 2). Observation (black line) and reforecast experiments (red lines) initialized from March 1st 1994 are shown. The thick red line corresponds to 12 ensemble mean results, whereas the thin red dotted lines correspond to each ensemble member. (Right) Same as in the left panel, but for the other reforecast experiments initialized from March 1st 1999.
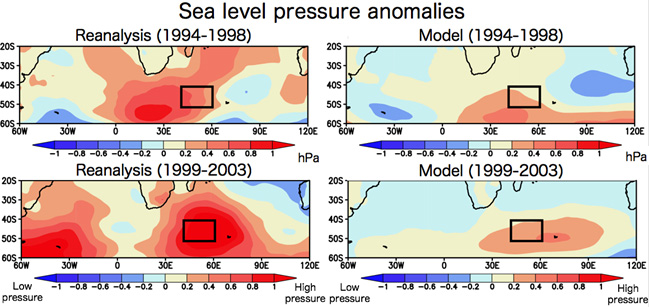
Figure 4. (Left) 5-yr mean sea level pressure (SLP) anomalies (in hPa) observed during 1994-1998 and 1999-2003, respectively. The black square area corresponds to the Agulhas Return Current region in the right panel of Fig. 2. (Right) Same as in the left panel, but for the reforecast experiments initialized from March 1st 1994. Shown here are 12 ensemble mean SLP anomalies.
Contacts:
- (For this study)
- Yushi Morioka, Scientist, Application Laboratory
- (For press release)
- Tsuyoshi Noguchi, Manager, Press Division, Public Relations Department