JAMSTEC News
Future outlook for Super El Niño
- Signs of La Niña in late 2016 -
Application Laboratory
El Niño event that emerged in the tropical Pacific Ocean shortly after this spring has become as strong as the record-breaking phenomenon in 1997, as our Application Laboratory predicted. The Super El Niño, accompanied by Indian Ocean Dipole (hereinafter referred to as IOD) which arose in the Indian Ocean as predicted, has already caused abnormal weather across the globe. This year’s El Niño has gained prominence abroad owing to its intensity, coming to be called Godzilla El Niño based on the old Japanese movie. In this column, we would like to analyze the Super El Niño along with future prospects.
1. Could Super El Niño have been predicted prior to the event?
Niño3.4, an index, which defines deviation between region-averaged SST (sea surface temperature) in the eastern tropical Pacific Ocean and the average year value, is used often to determine whether El Niño event is emerging, Continuation of values above 0.5 °C for several months is considered indication of an El Niño event. Figure 1 (a) illustrates time-series of the Niño3.4 showing the index exceeded 1 °C this spring, developed rapidly followed by reaching above 2 °C in September. We may judge from these values that present El Niño is at least comparable to the scale of Super El Niños in 1982-1983,and in 1997-1998.
Note: The terminology Super El Niño began to be used in scientific papers (Hong et al. 2014).

- Figure 1:
- (a) Niño3.4, El Niño Index (deviation between region-averaged SST in the eastern tropical Pacific Ocean and the average year value. Unit: °C). Blue and red lines indicate observation values and predictive values obtained with SINTEX-F prediction system on 1st May 2015 respectively. For forecasting, ensemble prediction method – a methodology where calculations are performed several times while slightly changing initial values and model configurations - is employed. The figure represents an average value of 9 ensemble predictions in red, and each ensemble value in gray.
(b) IOD Index (SST difference between the western and eastern Indian Ocean. Unit: °C). Colors used follow the same principle as in (a). The threshold of + 0.5 °C denotes positive IOD occurrence.
Both figures indicate that the prediction based on the data as of May 1st, 2015, was successful in predicting well the observed real development.
Application Laboratory (previously known as Climate Variations Research Program, Frontier Research Center for Global Change), JAMSTEC, successfully developed a prototype of SINTEX-F seasonal forecast system (*1) in 2005, commenced monthly experimental predictions for climate variability inducing abnormal weather. This year marks 10th anniversary of initiation of delivering prediction information to the world. Prediction made under initial conditions on 1st May 2015 successfully predicted this year’s El Niño with accuracy.
As one of the strongest events ever, called Super El Niño (Figure 1 a) The system also predicted evolution of positive IOD which could bring extreme summer heat to Japan in contrast to El Niño which could cause cool summer (Figure 1 b). In fact, Japan experienced the impact from two contradicting events this summer; IOD in the Indian Ocean brought unusually hot conditions in July and the first half of August, whereas El Niño in the Pacific brought cool and wet conditions in the latter half of this summer
Note: For IOD, readers may be referred to our previous column issued on 24th July 2015; Signs of Indian Ocean Dipole as Predicted.
2. What will happen next?
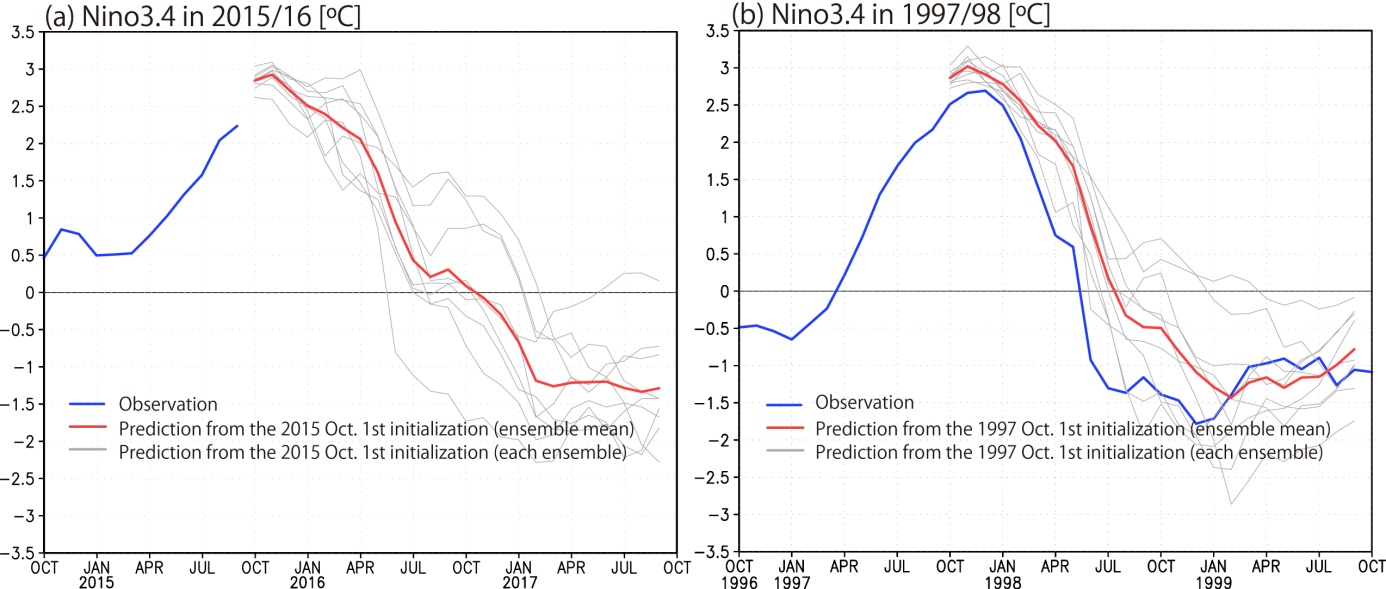
According to latest forecast with SINTEX-F (forecasting as of 1st October 2015), the intensifying El Niño will reach its peak late this autumn, retaining the momentum until this winter (Figure 2 a) which may result in warmer winter in Japan (Figure 3).
For further details, see Latest Seasonal Outlook; information on forecast is updated every month.
- Figure 2:
- (a) Niño3.4 predicting over the next 2 years based on the data as of October 1st, 2015.
(b) Niño3.4 at the strongest El Niño event in 1997-1998. Red line stands for predictive values gained applying initial values on 1st October 1997. The method applied is called hindcast experiment, simulating a past event by using initial values before the event.
- Figure 3:
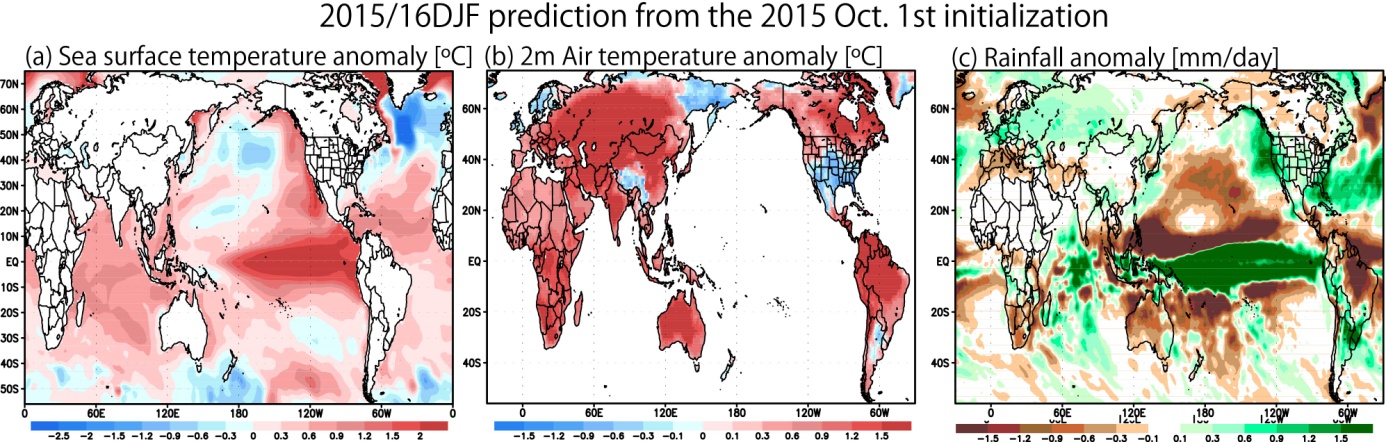
- Predictive values for the upcoming winter (average values between December 2014 and February 2016) based on the data as of October 1st, 2015.
(a) SST deviation from the climatological value (°C). Warm and cold colors represent higher and lower temperatures compared to the climatology, respectively.
(b) Deviation of the land surface air temperature from the climatological value (°C). Likewise, higher and lower temperatures than the climatology are shown in warm and cold colors, respectively.
(c) Precipitation deviation from the climatological value (mm/day). Green and brown are indicators for higher and lower than normal, respectively. Strong El Niño emergence may lead to warmer than normal winter in large areas of the world including Japan. Meanwhile, colder climate will affect northern Europe, northeastern Russia, southern China and the US. Also, there will be smaller amounts of rainfall in Australia, southern Africa, Brazil and Southeast Asia whereas northern Europe and the US (especially eastern) will receive larger precipitation. Specifically, California Niña event may generate high precipitation in the east coast of the United States.
3. La Niña may take over El Niño late next year
Based on the results from the SINTEX-F forecasting system, the extremely strong El Niño will lose its strength next spring, take turn with La Niña event next winter (December 2016 through February 2017) that causes cooler than normal sea temperature in the eastern tropical Pacific Ocean. While most other forecasting agencies around the world make a 6 to12-month prediction, SINTEX-F forecast system of Application Laboratory succeeded in predictions of El Niño and La Niña events 2 years in advance, making itself the sole system in the world to monthly distribute 2-year prediction information on El Niño and La Niña. We note that SINTEX-F was successful in predicting the following 2 events; Super El Niño that emerged in 1997 and suddenly waned in the spring of 1998, and La Niña emergence in January 1999 (Figure 2 b). The integrity of the system evinces a great likelihood of La Niña event next year. La Niña event is considered to bring wintry weather to affected areas in winter.
Global Warming Hiatus appears to have ended in 2014 and we expect a start of a reversed decadal-scale phase which may strengthen the global warming impacts However, the winter from 2016 through 2017 may be an exception during which it does not get so warm. For reference, see Figure 4 illustrating climate prediction for the winter averaged between December 2016 and February 2017. Note that some of the data in it may not be as reliable as others since the diversity among the forecast ensembles large.; in particular, we should be careful to interpret the results near Japan because of the big diversity among forecast ensemble.

- Figure 4:
- Prediction for next winter based on the data as of October 1st, 2015 (average between December 2016 and February 2017). Influence of potential La Niña may appear in the United States in the form of smaller precipitation and warmer winter. Especially, California Niña event will induce low precipitation in the west coast of the United States. The impact may also include severe winter in northern Africa, southern Eurasia continent excluding India, and northern Brazil.
*1: SINTEX-F seasonal prediction system; a computer-based system to predict El Niño, La Niña and seasonal deviations from the climatology across the world with predictability ranging from several months to 2 years. It comprises groups of formula (models) related to atmosphere-ocean-land physics by segmenting the earth into 3-dimentional grids, and numerically integrating the formula over time for each grid point. The algorithm calculates how the current situations (initial state) obtained through observations will develop with time. Originated as SINTEX-F, an atmospheric-ocean circulation model co-developed by Japan and Europe, the system is operated with a super computer called the Earth Simulator of JAMSTEC. Since its launch in 2005, we have been experimentally operating the system for seasonal prediction while further improving the system. It achieved one of the world’s most advanced prediction systems for El Niño and IOD (See Jin et al. 2008 Climate Dynamics).
Our laboratory delivers results of the monthly seasonal prediction on the following website on a near-operational basis.
(Link) Seasonal forecasting:
Most recently, we verified predictability of coastal Niño event that emerges along the western coast of major continents, proposing a new paradigm for research on seasonal prediction in the mid-latitude region.
(Disclaimer)
The information contained herein is provided as a public service to introduce our research activity and seasonal prediction experiments conducted at Application Laboratory (APL)/JAMSTEC. We do not warrant or take any responsibility for the accuracy, completeness, reliability or suitability with respect to the website or the information, products, services, or related graphics contained on the website for any purpose. Any reliance you place on such information is therefore strictly at your own risk.
When a part or all of the contents of this site are refereed to, please acknowledge as “Provided by Application Laboratory (APL)/JAMSTEC”.