Press Releases
JAMSTEC
Improved prediction of decadal sea ice variability in the west Antarctic Seas
―Key roles of ocean and sea ice observation data―
1. Key Points
- ◆
- Skillful prediction of decadal sea ice variability in the west Antarctic Seas is demonstrated using an ocean-atmosphere coupled model in which the ocean and sea ice are initialized with the observation data.
- ◆
- Initialization of ocean temperature and salinity in the model leads to improved accuracy in sea ice prediction over the Amundsen-Bellingshausen Sea, while initialization of sea ice concentration improves the prediction accuracy over the Weddell Sea.
- ◆
- The Antarctic Circumpolar Current intensifies in the Amundsen-Bellingshausen Sea to enhance zonal sea ice advection from the Ross Sea and induce anomalous cooling in the subsurface ocean, leading to a sea ice increase since the late 2000s.
2. Abstract
Yushi Morioka (Researcher at Application Laboratory, VAiG, JAMSTEC) and his research team demonstrated improved prediction of decadal sea ice variability in the west Antarctic Seas by conducting reforecast experiments (※1) using a coupled general circulation model (SINTEX-F2 ※2) in which ocean and sea ice variables are initialized with observation data using the Earth Simulator.
Antarctic sea ice has slightly increased over the past few decades, in contrast to rapidly decreasing Arctic sea ice under the influence of global warming. Several factors are reported to explain the increasing sea ice trend in the Antarctic Seas. Some studies have suggested that decadal sea ice variability with a frequency of more than 10 years contributes to the sea ice increase. However, accurate prediction of the decadal sea ice variability in the Antarctic Seas remains challenging for the climate modeling community.
One of the underlying causes is a difference in ocean and sea ice states between the observation data and coupled model simulations. Satellite observations have made sea surface temperature (SST) and sea ice concentration (SIC) data in the Antarctic Seas available since the 1980s. However, temperature and salinity data from subsurface ocean observations in the Antarctic Seas are few compared with other ocean basins. Most of the coupled models employ ocean reanalysis products (model output) to initialize the ocean model to compensate for the lack of subsurface ocean observations. Nevertheless, in recent years, subsurface ocean observations have significantly increased since the late 2000s, following implementation of Argo floats (autonomous descending/ascending drifting buoys). Incorporating these observation data into the coupled models may help improve the prediction accuracy of decadal sea ice variability in the Antarctic Seas.
In collaboration with researchers from CMCC, we developed a decadal prediction system using the SINTEX-F2 model, in which the SST, SIC, and subsurface ocean temperature and salinity are initialized with the observation data. Here, we demonstrate that decadal sea ice variability in the Amundsen-Bellingshausen Sea can be skillfully predicted. In the Amundsen-Bellingshausen Sea, the eastward Antarctic Circumpolar Current intensifies to increase zonal sea ice advection from the Ross Sea and induce anomalous cooling in the subsurface ocean, leading to an increase in sea ice since the late 2000s.
These results have implications for decadal sea ice prediction in the west Antarctic Seas, which requires accurate initialization of ocean and sea ice states in a coupled model. Further improvement of sea ice prediction accuracy needs a greater number of ocean and sea ice observations in the Antarctic Seas. It is highly anticipated that the results obtained from this study can be applied to other prediction studies on Arctic sea ice.
The paper is published in Communications Earth & Environment on Sep 12, 2022 (6 pm, JST). This research was supported by JSPS KAKENHI Grant-in-Aid for Early Career Scientists (19K14800JP) and Grant-in-Aid for Scientific Research (C) (22K03727).
- Application Laboratory, VAiG, JAMSTEC
- Ocean Modeling and Data Assimilation, CMCC
3. Background
Antarctic sea ice has slightly increased over the past few decades, in contrast to rapidly decreasing Arctic sea ice under the influence of global warming. Several factors have been reported to explain the sea ice increase in the Antarctic Seas, but previous studies have suggested that decadal sea ice variability, which is pronounced in the west Antarctic Seas, contributes to sea ice increase. For example, the sea ice increase in the Ross Sea has been linked to anomalous southerly winds, which are associated with a deepening of the Amundsen Sea Low. On the other hand, the sea ice increase in the Weddell Sea is not only linked to local wind variability but also to a decrease in ocean temperature caused by a strengthening of the Weddell Gyre (Ref).
Numerous studies have explored the physical processes of the decadal sea ice variability in the west Antarctic Seas, but few studies have discussed the decadal sea ice predictability and its underlying causes using a coupled model. A previous study has suggested that most coupled models used for global warming studies could neither reproduce the increasing sea ice trend in the Antarctic Seas nor predict it for more than a few years.
One of the underlying causes is a difference in the ocean and sea ice between the observation data and the coupled model. Observed sea surface temperature (SST) and sea ice concentration (SIC) data in the Antarctic Seas have been available only since the 1980s with the progress of the satellite observations. However, subsurface ocean observations such as temperature and salinity in the Antarctic Seas are few compared with the other ocean basins. Therefore, most coupled models employ ocean reanalysis products (model output) to initialize their ocean models to compensate for the lack of subsurface ocean observations. Since the late 2000s, the implementation of Argo floats (autonomous descending/ascending drifting buoys) has led to a significant increase in subsurface ocean observations such as temperature and salinity. The integrated ocean database that comprises various sources of ocean observations has recently become available (Ref), and incorporating these open data into a coupled model may improve sea ice prediction accuracy. Therefore, this study evaluates how far and accurately the decadal sea ice variability in the west Antarctic Seas can be predicted and identifies the underlying physical processes.
4. Results
Figure 1 shows prediction accuracy of 1-5 and 6-10 year lead SICs obtained from a series of coupled model experiments. We evaluated the prediction accuracy during 1982-2019 and calculated correlation coefficients between the observed and predicted SIC anomalies from the model experiments. Positively high correlation coefficients indicate high prediction accuracy. For example, a correlation coefficient of 0.8 means the model can predict 64% of the observed SIC variability during the analysis period.
Compared to the control experiment in which the model’s SST was initialized with the observation data (Figs. 1a, d), the sea ice initialized experiment showed higher prediction accuracy for 1-5 and 6-10 year lead SIC anomalies in the Weddell Sea. Additionally, the ocean and sea ice initialized experiment (Figs. 1c, f) showed higher prediction accuracy in the Amundsen-Bellingshausen Sea than the sea ice initialized experiment (Figs. 1b, e).
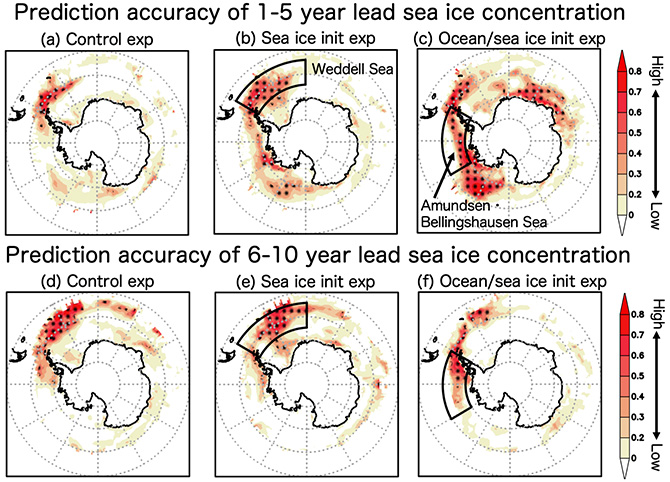
Figure 1: (a) Prediction accuracy of 1-5 year lead sea ice concentration (SIC) for the control experiment. The accuracy was measured with the correlation coefficient between the observed and predicted SIC anomalies during the analysis period of 1982-2019. Black dots indicate statistically significant correlation coefficients exceeding the 90% confidence level. (b) Same as in (a), but for the sea ice initialized experiment. The black box corresponds to the Weddell Sea. (c) Same as in (a), but for the ocean and sea ice initialized experiment. The black box corresponds to the Amundsen-Bellingshausen Sea. (d-f) Same as in (a-c), but for the prediction accuracy of 6-10 year lead SIC.
Focusing on the Amundsen-Bellingshausen and Weddell Seas, we plot a time series of prediction accuracy as a function of each lead year (1-10) in Figure 2. In the Amundsen-Bellingshausen Sea (Fig. 2a), all the model experiments showed a significant decrease in the prediction accuracy at a 2-year lead, but the ocean and sea ice initialized experiment showed the highest accuracy over 4-6 year leads. Additionally, in the Weddell Sea (Fig. 2b), all the experiments showed a gradual decrease in prediction accuracy, but the sea ice initialized experiment demonstrated the highest prediction accuracy with a significant recovery over 8-9 year leads.
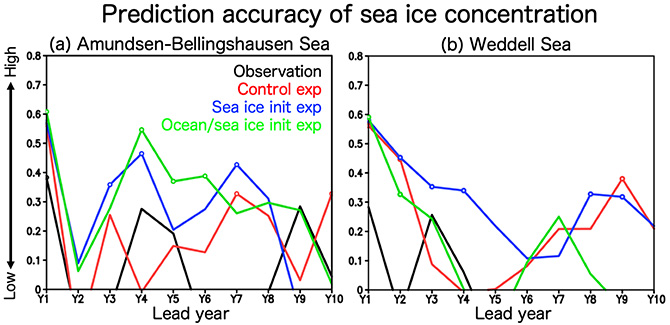
Figure 2: (a) Prediction accuracy of sea ice concentration (SIC) in the Amundsen-Bellingshausen Sea at each lead year (1-10) for the observation (black line), control experiment (red line), sea ice initialized experiment (bule line), and ocean and sea ice initialized experiment (green line). The accuracy was measured with the correlation coefficient between the observed and predicted SIC anomalies during the analysis period of 1982-2019. Open circules indicate statistically significant correlation coefficients exceeding the 90% confidence level. (b) Same as in (a), but for the Weddell Sea.
To examine the high prediction accuracy in the Amundsen-Bellingshausen and Weddell Seas, we displayed the SIC anomalies averaged during the high sea ice period of 2008-2017 (Fig. 3). Compared to the observation data (Fig. 3a), the positive SIC anomalies in the control experiment (Fig. 3b) had smaller amplitudes. The positive SIC anomalies in the Amundsen-Bellingshausen and Weddell Seas became larger in the sea ice initialized experiment (Fig. 3c) compared to the control experiment (Fig. 3b). Furthermore, much larger positive SIC anomalies, closer to the observation data (Fig. 3a), were seen in the Amundsen-Bellingshausen Sea (Fig. 3d) for the ocean and sea ice initialized experiment.
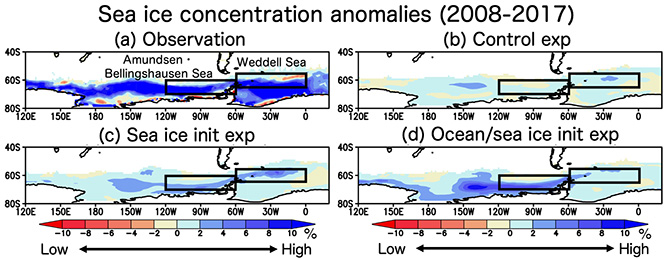
Figure 3: (a) Sea ice concentration (SIC, in °C) anomalies during the high sea ice period of 2008-2017 from the observation data. Black boxes indicate the Amundsen-Bellingshausen and Weddell Seas, respectively. (b-d) Same as in (a), but from the control, sea ice initialized, and ocean and sea ice initialized experiements, respectively.
To investigate the underlying causes of the sea ice increase in the Amundsen-Bellingshausen Sea, we evaluated tendency anomalies of sea ice volume during 2008-2017 for the ocean and sea ice initialized experiment (Fig. 4a). From 2009 to 2017, total tendency anomalies were positive, which are attributed to both the zonal sea ice advection and the residual processes (vertical processes including atmospheric and oceanic cooling). We also found that the sea ice zonal velocity anomalies were positive (Fig. 4b). This suggests that more sea ice was advected from the west, i.e., the Ross Sea, and converged west of the Antarctic Peninsula, leading to a sea ice increase in the area.
Furthermore, we found that the residual processes were linked to negative temperature anomalies in the surface mixed layer and the subsurface ocean (Fig. 4c). The zonal ocean velocity showed positive anomalies, indicating a strengthening of the eastward Antarctic Circumpolar Current (Fig. 4d). These results suggest that the strengthening of the Antarctic Circumpolar Current increases zonal advection of sea ice and cold water from the Ross Sea, leading to sea ice increase in the Amundsen-Bellingshausen Sea.
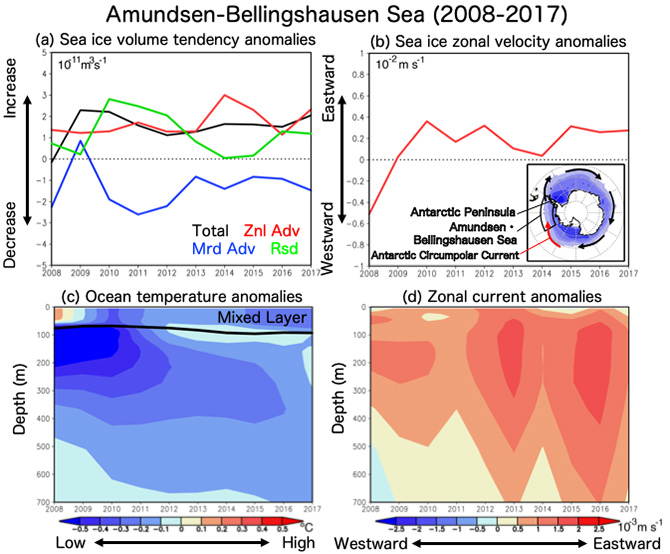
Figure 4: (a) Sea ice volume tendency anomalies (in 1011 m3 s-1) in the Amundsen-Bellingshausen Sea during 2008-2017 from the ocean and sea ice initialized experiment. Total tendency anomalies (black line), zonal sea ice advection (red line), meridional sea ice advection (blue line), and residual (green line) components are shown. (b) Same as in (a), but for the sea ice zonal velocity anomalies (in 10-2 m s-1). A schematic in the panel shows Antarctic sea ice (color) and Antarctic Circumpolar Current (arrow). (c) Same as in (a), but for the upper 700 m ocean temperature anomalies (in °C). The black line indicates mixed layer depth. (d) Same as in (c), but for the zonal current anomalies (in 10-3 m s-1).
5. Future prospects
This study demonstrates skillful prediction of decadal sea ice variability in the west Antarctic Seas by conducting decadal reforecast experiments in which the SINTEX-F2 (※2) model’s ocean and sea ice are initialized with the observed data. Initialization of the model’s ocean temperature and salinity effectively improves sea ice prediction in the Amundsen-Bellingshausen Sea, while initialization of the model’s sea ice concentration enhances sea ice prediction accuracy in the Weddell Sea. In the Amundsen-Bellingshausen Sea, the eastward Antarctic Circumpolar Current intensified to increase the zonal sea ice advection and decrease the subsurface ocean temperature, leading to the sea ice increase since the late 2000s. However, it is unclear why the Antarctic Circumpolar Current was strengthened in the model. Previous studies (Ref) have reported a southward shift of the Antarctic Circumpolar Current in the Indian Ocean sector during the past decades. Further studies are needed to determine the underlying causes using observation and model experiments.
This study has implications for the role of ocean and sea ice observation data in the accurate prediction of decadal sea ice variability in coupled models. Subsurface ocean observations in the Antarctic Seas are fewer than those in other ocean basins. However, the number of subsurface ocean observations significantly increased from the 2000s (Fig. 5a) to the 2010s (Fig. 5b) owing to the implementation of Argo floats (autonomous ascending/descending drifting buoys). Nevertheless, the Weddell Sea still suffers from fewer observations because of its larger sea ice extent compared to the rest of the Antarctic Seas. This may be one of the reasons for the smaller improvement in the sea ice prediction accuracy in the Weddell Sea (Fig. 2b).
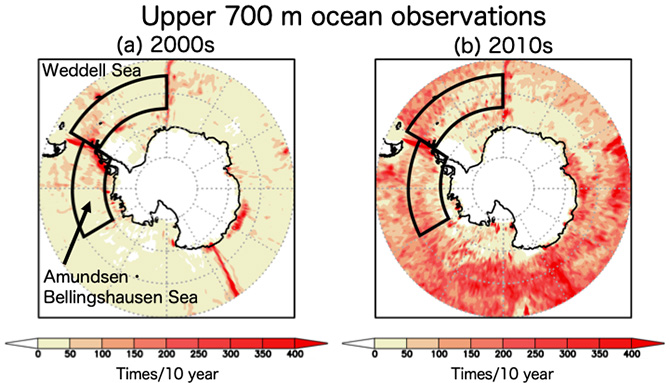
Figure 5: (a) Number of the upper 700 m ocean observations in the Southern Ocean and the Antarctic Seas during the 2000s. Color represents the total number of ocean observations using Argo floats, CTD (Conductivity, Temperature, and Depth) profilers, XBT (Expendable Bathythermograph) profilers, and ocean buoys. Black boxes indicate the Amundsen-Bellingshausen Sea and the Weddell Sea, respectively. (b) Same as in (a), but during the 2010s.
A recent study (Ref) has reported that initialization of sea ice concentration and thickness improves sea ice prediction accuracy on a seasonal timescale. Therefore, implementing sea ice thickness in additon to sea ice concentration into a coupled model may furhter improve the prediction accuracy of decadal sea ice variability in the west Antarctic Seas.
Finally, the methodology and results of this study can also be applied to decadal prediction studies on Arctic sea ice. JAMSTEC started constructing an Arctic research icebreaker in 2021 (Ref), and will conduct intensive observations and simulation studies in the Arctic. Morevoer, we plan to further improve the coupled model by comparing it with the observation data and developing more accurate sea ice prediction systems on a longer timescale.
【Supplementary Information】
- ※1
- Reforecast experiments:
In contrast to future prediction starting from the present day, the reforecast experiment starts from the past day to predict the observed state in a coupled model. This allows to evaluate the prediction accuracy of the model by comparing the observation data and the model results. In this study, we conducted the reforecast experiments for 10-yr leads starting from each year of 1982-2009.
- ※2
- SINTEX-F2:
Ocean and atmosphere coupled general circulation model developed on the Earth Simulator under the international research collaboration between European research agencies and JAMSTEC. The model is written with a series of numerical program codes that describe physical and dynamical processes of the ocean and climate systems. The SINTEX-F2 model is mainly used for physical processes and prediction studies on climate variability.
Contacts
- (For this study)
- Yushi Morioka, Researcher, Application Laboratory (APL), Research Institute for Value-Added Information Generation (VAiG), Climate Variability Prediction and Application Research Group, JAMSTEC
- (For press release)
- Press Office, Marine Science and Technology Strategy Department, JAMSTEC