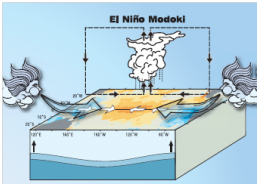
El Nino Modoki has recently been identified as a coupled ocean-atmosphere phenomenon in the tropical Pacific Ocean and has been shown to be quite different from the canonical El Nino/Southern Oscillation (ENSO) in terms of its spatial and temporal characteristics as well as its teleconnection patterns (Ashok et al. 2007; Weng et al. 2007; Ashok and Yamagata 2009). Traditionally the term “El Nino” was used for the canonical El Nino associated with warming in the eastern tropical Pacific. However, as we realize now, during El Nino Modoki the sea surface temperature (SST) anomaly in eastern Pacific is not affected, but a warm anomaly arises in the central Pacific flanked by cold anomalies on both sides of the basin (Fig. 1). Together with its counterpart La Nina Modoki, when colder central Pacific is flanked by warmer eastern and western Pacific, the new phenomenon is now called as the ENSO Modoki that assumes both warm and cold phases of its behavior. Several studies have shown that the ENSO Modoki has become more prominent in recent times, as compared to ENSO, and thereby changing the teleconnection pattern arising from the tropical Pacific. Moreover, the associated decadal changes in the sea level are shown to affect not only the islands of central Pacific but remote regions off California and southwestern Indian Ocean (Behera and Yamagata 2009).
 |
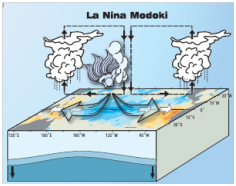 |
Figure 1: Schematic diagrams of El Nino Modoki and La Nina Modoki the two phases of ENSO Modoki.
ENSO and ENSO Modoki modes are easily captured as the first two dominant modes of variations in an EOF analysis of SST anomalies. The EOF1 pattern that explains about 45% of the SST variability captures the essential features of El Nino whereas the EOF2, which generally explains about 12% of the SST variability, captures a zonal tripole pattern in the tropical region. In this EOF2 pattern both eastern and western tropical Pacific SST anomalies have loadings of the same sign, while those of the central tropical Pacific are of opposite sign (cf. Ashok et al. 2007). Associated with this difference, it is found that the correlation between PC2 and Nino3 index is negligible (-0.09) while the correlation between PC1 and Nino3 index is very high (0.98). Therefore, Ashok et al. (2007) formulated an ENSO Modoki Index (EMI) to capture the unique tripolar nature of the ENSO Modoki linked SST anomalies:
The three terms on the right hand side of the equation are derived from the area-averaged SST anomaly over each of the regions A (165°E-140°W, 10°S-10°N), B (110°W-70°W, 15°S-5°N), and C (125°E-145°E, 10°S-20°N), respectively.
The ENSO Modoki has distinct teleconnections and affect many parts of the world. For example, the West Coast of United States of America is wet during El Nino but dry during El Nino Modoki (e.g. Weng et al. 2008). Recent studies show that teleconnections associated with ENSO Modoki influence the rainfall over India and South Africa (Ratnam et al. 2010; Ratnam et al. 2011).