Press Releases
March 7, 2013
JAMSTEC
NiPR
Radiosonde Observations over the Arctic Ocean Improve Model Reproductivity of Atmospheric Circulation at Mid and High Latitudes
—Role of Data Collected by the Research Vessel Mirai—
Overview
A research group led by Dr. Jun Inoue of the Observing System Research and Ensemble Data Assimilation Development Research Team of the Earth Simulator Center, Japan Agency for Marine-Earth Science and Technology (JAMSTEC: Asahiko Taira, President), by using the data assimilation system*1developed by the Earth Simulator Center, has shown that radiosonde observation data collected by the Research Vessel Mirai during an Arctic Ocean cruise improved model reproductivity of atmospheric circulation over the Arctic Ocean and the midlatitudes including Japan. Conducting upper atmospheric observations in the data-sparse area above the Arctic Ocean provides improved initial data for numerical weather forecasts, suggesting the improvement of the predictability of weather forecasts for the northern shipping routes for stormy weather caused by the decline in sea ice. In addition, it is expected that changes in atmospheric circulation that lead to severe weather and other phenomena can be predicted with increased accuracy. The monitoring network over the Arctic Ocean will be strengthened through international cooperation and further forecasting experiments will be conducted to provide more detailed assessment of effects.
The findings were published in the online edition of the American Geophysical Union's journal Geophysical Research Letters on March 6.
Note
* 1: Data Assimilation System
The Earth Simulator Center optimized the atmospheric general circulation model AFES and the assimilation code LETKF to the Earth Simulator in order to construct the global atmospheric reanalysis dataset ALERA2.
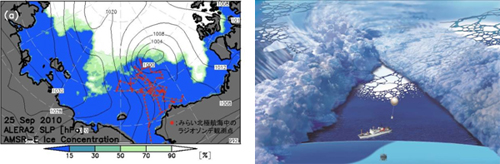
Figure 1. The sea-level pressure pattern (contours) for the Arctic cyclone encountered by the Mirai on September 25, 2010, sea ice distribution (color indicates sea-ice concentration (%)) and the sites of radiosonde observations (red dots) conducted by the Mirai during the Arctic Ocean cruise are shown in the left panel. A schematic image of the Mirai conducting radiosonde observations in the center of the Arctic cyclone is shown in the right panel. The Mirai was successful in conducting detailed observations of the Arctic cyclone that appeared at the sea-ice edge near 79° North.
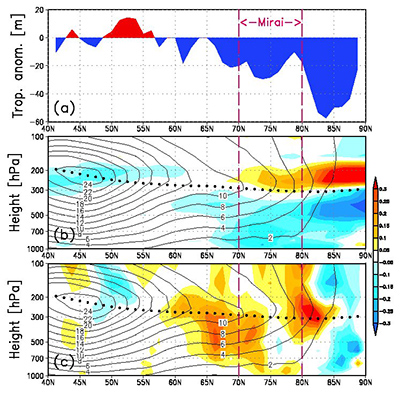
Figure 2. Differences between the experimental cases for assimilating and not assimilating radiosonde observation data collected by the Mirai (Assimilating case minus Not Assimilating case). Latitudinal distributions for differences in (a) tropopause height (m), (b) temperature (°C), and (c) zonal wind (m/s: warm colors indicate strong westerly winds). The averaging time period after development of the Arctic cyclone was from September 24, 2010 to October 13. Isopleths show westerly winds (m/s) for the data assimilation case. The dotted line is the tropopause.
The effects of data assimilation were observed at latitudes other than the latitude band observed by the Mirai. The tropopause height of the high latitude and the temperature for the whole troposphere including the air temperature near the surface are lower for the data assimilation case. From around 65° North where the north–south temperature gradient becomes pronounced, westerly winds strengthen from the upper atmosphere to near the surfaces. This results in changes in heat transport between the ocean and atmosphere at high latitudes. Accurately understanding the heat transport between ocean and atmosphere at high latitudes during this period is important for estimating the air temperature over the Arctic Ocean from fall to winter, which affects the growth of sea ice during the winter season. This will also lead to a better understanding of the accelerating sea-ice decline in the Arctic region in recent years and of Arctic amplification. A low temperature signal also appeared around 45° North near the upper atmosphere 250 hPa-level.
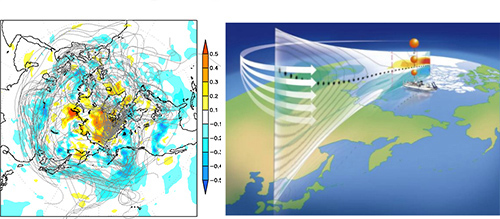
Figure 3. The left panel shows the increases and decreases in air temperature (°C: shown by color) that occur at the 250 hPa-level when the radiosonde observation data collected by the Mirai is assimilated, and the two-week forward trajectories (indicating where the air masses flow) with Mirai as the starting point. The dots are the operational radiosonde stations. The right panel is a schematic diagram of the effect of radiosonde observations over the Arctic Ocean on modeled middle-latitude atmospheric circulation.
For the case when the radiosonde observation data collected by the Mirai is assimilated, the temperature in the middle-latitude upper atmosphere decreases. This indicates that middle-latitude atmospheric circulation might also be affected as a result of the air masses above the Mirai, for which more observed information is becoming available, flowing to the middle-latitude upper atmosphere.
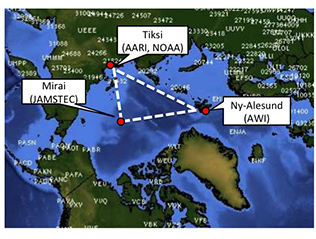
Figure 4. International collaboration of the radiosonde intensive observation network scheduled for September 2013
The Mirai (JAMSTEC) will be covering the Arctic Ocean. The white letters and numerals in the figure indicate the radiosonde observation sites for this project. This figure is taken from the University of Wyoming Web site at the following link.
http://weather.uwyo.edu/upperair/sounding.html
Contacts:
- Japan Agency for Marine-Earth Science and Technology (JAMSTEC)
(For the study) - Jun Inoue,
Earth Simulator Center (ESC) Observing System Research and Ensemble Data Assimilation Development Research Team (OREDA)
Research Institute for Global Change (RIGC) Climate Dynamics Research Team
Inter-university Research Institute Corporation Research Organization of Information and Systems National Institute of Polar Research
- (For the data assimilation system)
- Nobumasa Komori,
Earth Simulator Center (ESC) Observing System Research and Ensemble Data Assimilation Development Research Team (OREDA)
- (For publication)
- Kazushige Kikuchi, Director
Planning Department Press Office
Email: press@jamstec.go.jp