Press Releases
June 29, 2013
JAMSTEC
Elucidating Climate Changes and Variations in the Northern Hemisphere
–Sudden Change in the Greenland Sea Surface Temperature and Accompanying Changes in the Northern Hemispheric Climate–
1. Overview
Senior Scientist Mototaka Nakamura of the Research Institute for Global Change, Japan Agency for Marine-Earth Science and Technology (JAMSTEC: Asahiko Taira, President) analyzed the impact of the large scale atmosphere-ocean interactions, the primary driver of the dynamics of large-scale atmospheric flows in the northern North Atlantic Ocean region, on climate changes and variations in the northern hemisphere. The European Centre for Medium-Range Weather Forecasts Re-analysis Data Archive (ERA-40 *1), the US National Oceanic and Atmospheric Administration Re-analysis Data (NCEP/NCAR *2) and the UK Met Office Hadley Centre Sea Surface Temperature Data (*3) were used in this analysis. The results show that the Greenland Sea surface temperature rose rapidly between February and March 1979, changing the atmospheric dynamics on a large scale and climate. The comprehensive analysis of the data before and after the event is the first logical explanation of how the change in 1979 may have been a major inflection point between the northern hemisphere cooling from the 1940’s to the 1970’s and the warming from the 1980’s. With the change, the interannual variation of monthly average temperature in the region around Japan has increased for many calendar months and the probability of extreme events has also increased since 1979 compared to that before 1979.
These findings show that global long-term cyclic climatic variations can be logically explained by focusing on dynamic factors based on observation data. It is anticipated that these findings will contribute to improving the accuracy of predictions for long-term global environmental change including the possibility of future northern hemispheric cooling.
These findings are scheduled to be published as an Early Online Release by the Journal of Climate on June 29 (JST).
Title: Greenland Sea surface temperature change and accompanying changes in the northern hemispheric climate
Author: Mototaka Nakamura
*1 ERA-40 Re-analysis Data Archive
ERA-40 is a re-analysis data set produced by the European Centre for Medium-Range Weather Forecasts that covers the period from September 1957 to August 2002; it is an atmospheric data set produced from various observation data by analysis using advanced data assimilation techniques. The temperature data for the lowest layer of the atmosphere is considered to be more accurate than those used for other re-analysis data sets. Most of the data used in this research were obtained from ERA-40.
*2 NCEP/NCAR Re-analysis Data
National Centers for Environmental Prediction/National Center for Atmospheric Research(NCEP/NCAR)re-analysis data were produced by the US National Oceanic and Atmospheric Administration; this atmospheric data set was produced from various observation data by analysis using advanced data assimilation techniques. Although they cover a longer period than ERA-40, the accuracy of temperature data for the lowest layer of the atmosphere is lower because the actual observation station data reports were not assimilated. Thus, only the surface atmospheric pressure, which is not included in ERA-40, was used.
*3 Hadley Centre Sea Surface Temperature Data Set
The global sea surface temperature data set from 1870 to present based on observational data produced by the UK Met Office.
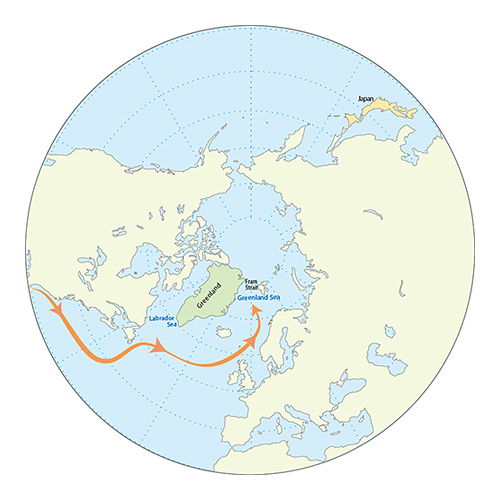
Figure 1 Map of the Northern Hemisphere mid- and high-latitudes
The Greenland Sea is located east of Greenland and is connected to the Arctic Ocean by the Fram Strait. The Gulf Stream, indicated by the orange curve, is the source of warm and high salinity seawater that flows northeastward to the vicinity of the Greenland Sea. In the Greenland Sea, strong temperature gradients are formed as the Gulf Stream flow collides with cold seawater from the Arctic Ocean.
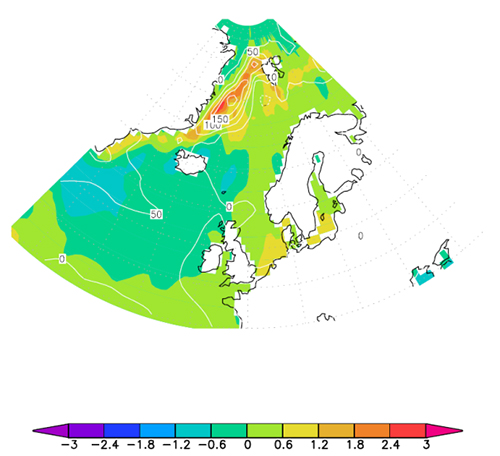
Figure 2 Composited differences in the sea surface temperature (color scale, °C) and atmosphere-ocean surface heat flux (white lines, Wm-2, positive value for upward heat transport) based on the February Empirical Orthogonal Function Mode 1 for the east-west baroclinicity in the vicinity of the Greenland Sea; calculated for the 1958 to 2002 period. Composited differences were calculated by subtracting the average of negative cases from the average of positive cases.
Above the Greenland Sea area, where the water temperature difference is large, there is a similar air temperature difference. Thus, the east-west baroclinicity difference on the west side of the area is large. In the vicinity of the Greenland Sea, large amounts of heat have been released into the atmosphere from areas of warm water and the atmosphere has been warmed. Here, for the 1957 to 2002 period, the patterns shown are the average of extreme positive conditions minus the average of extreme negative conditions. Only the signals associated with the strongest variation patterns for the east-west baroclinicity in the vicinity of Greenland are shown.
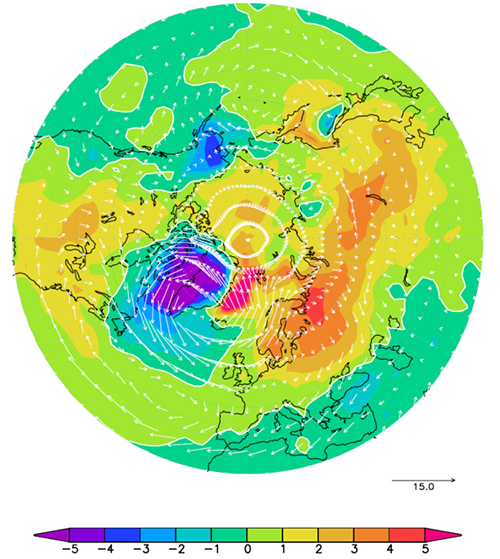
Figure 3 Composited differences of the near-surface air temperature (color scale, °C) and winds at around 5000 m altitude (arrows, ms-1) corresponding to the composited differences shown in Figure 2. The southern boundary is 30°N. The thick white line is the zero line between positive and negative.
When there are extreme differences in seawater temperature as seen in Figure 2, there are large differences in winds, flowing northward on the east side of Greenland and flowing southward on the west side of Greenland. Northward heat transport is increased east of Greenland and decreased west of Greenland. Differences in the near-surface air temperature accompanying this are as follows: east of Greenland including most of the Eurasian continent is warmer while Greenland and the region immediately to the west and south are colder. The average of the composited temperature differences for the whole region north of 30° N is about +0.8°C.
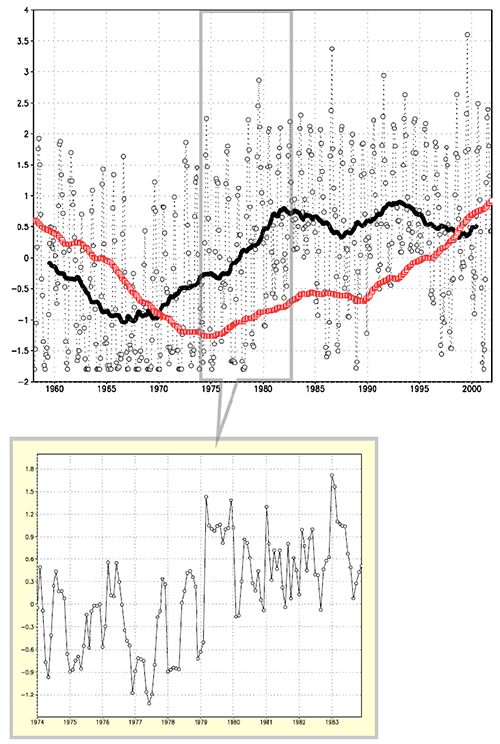
Figure 4 Top: Monthly values for the Greenland Sea Surface Temperature Index or GSSTI (thin black dotted lines and open circles), 5 year moving average values for GSSTI (thick black line), Atlantic Multidecadal Oscillation index (red line, values are 5 times actual values to adjust scales). Data are shown for 1957 to 2002. Bottom: 10 year period around 1979, monthly GSSTI anomaly for 1974 to 1983. (Shown here are deviations from the monthly climatological values computed from the entire period, 1957–2002, for each calendar month.)
The Atlantic Multidecadal Oscillation Index is essentially the average surface water temperature for the North Atlantic Ocean from 0°N to 70°N, filtered by the 10 year moving average to remove extreme monthly and annual values. The monthly GSSTI values show an increase in their reference values around 1980. The long term cyclic oscillation of the 5 year moving average of the GSSTI shows a similar transition 10 to 15 years in advance of change in the Atlantic Multidecadal Oscillation. The GSTTI suddenly increased by about 2°C during the period between February and March 1979 and has fluctuated at a high range since then. This sudden rise is prominent, as there are almost no other months from 1957 to 2002 with a sudden change in the monthly anomaly greater than 1°C between two consecutive months.
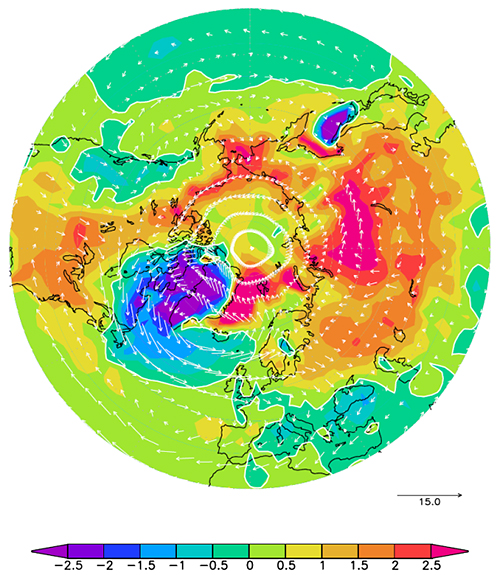
Figure 5 Values calculated by subtracting the climatological values for February 1958 to 1978 from the climatological values for February 1979 to 2002.
The near-surface air temperature (color scale, °C) and winds at approximately 5000 m altitude (arrows, ms–1). Color scale is half that used in Figure 3. The thick white contours show the boundary zero line between positive and negative.
Unlike Figure 2, all cases are included; this includes cases when the Greenland Sea surface temperature was extremely high as well as cases when it was not. Although a difference as large as seen in Figure 3 is not observed, a difference pattern similar to Figure 3 can be seen even when the averages for the two periods are compared. The difference in average February air temperature between the two periods averaged over the whole region north of 30°N is about +0.5°C.
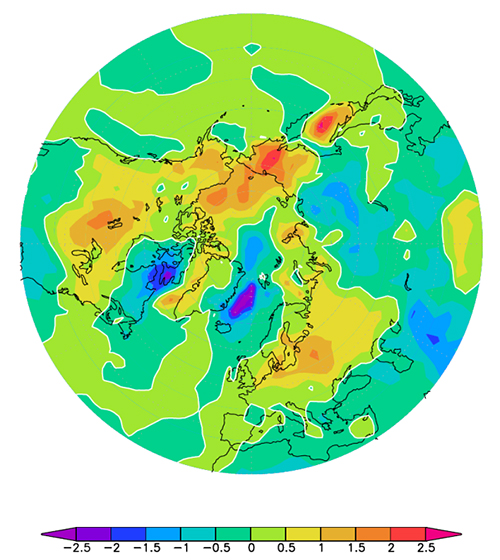
Figure 6 The standard deviation for February land and near sea surface air temperatures for 1979 to 2002 minus the standard deviation for 1957 to 1978 (°C, zero values are shown by the thick white contours). The standard deviation for each period was calculated separately based on the anomalies from the February climatological values for each period. The standard deviation for temperature is a measure of the representative variance from the average monthly value. If the standard deviation is large, it suggests that the amplitude of the standard variance both above and below the annual average value is large. For example, if the average year air temperature for February is 5°C and the standard deviation is 0.5°C, the average temperature for February from 4.5°C to 5.5°C can be considered to be in the range for a typical February. Generally, the larger the amplitude of the standard deviation of the air temperature, the more difficult it is for organisms to adapt to the temperature variations, and the more likely for human socioeconomic activity to suffer from the variations.
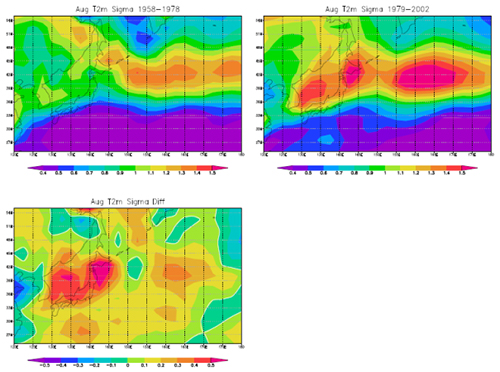
Figure 7 Standard deviation for and the near-surface air temperature for August around Japan. Top Left: Standard deviation for 1958 to 1978. Top Right: Standard deviation for 1979 to 2002. Bottom Left: Difference calculated by subtracting the standard deviation for 1958 to 1978 from the standard deviation for 1979 to 2002. Standard deviations were calculated separately for each period based on the anomalies from the August climatological values.
The standard deviation of the August average surface air temperature in the vicinity of Japan has become larger since 1979 by 0.3°C to 0.5°C over a wide area. This indicates that the frequency of cold and hot summers has risen while the severity of cold and hot summers has increased. An increase of 0.5°C in the standard deviation for the monthly average surface air temperature is not negligible. For example, August 2010 was the hottest month in recorded history and the average air temperature in August for Tokyo was just 2.2°C higher than for an average year. Thus, if the amplitude of the standard deviation were to increase from 1.0 to 1.5°C, high temperatures near that of 2010, and conversely, abnormally cold summers, would become more frequent.
Contacts:
Japan Agency for Marine-Earth Science and Technology (JAMSTEC)
- (For the study)
-
Mototaka Nakamura, Senior Scientist
Climate Variation Informatics Research Team, Climate Variation Predictability and Applicability Research Program, Research Institute for Global Change (RIGC) - (For publication)
-
Kazushige Kikuchi, Director
Planning Department Press Office
E-mail: press@jamstec.go.jp