Press Releases
December 15, 2014
JAMSTEC
Revealed Impacts of Smaller-scale Eddies
in Northwest Pacific on Ocean Circulation
~Results of New High-resolution Simulation on Earth Simulator~
1.Overview
A research team led by Dr. Hideharu Sasaki, Application Laboratory and Yoshikazu Sasai, Research and Development Center for Global Change at Japan Agency for Marine-Earth Science and Technology (JAMSTEC: Asahiko Taira, President) analyzed output from a high-resolution (1/30°in the horizontal and 100 vertical levels) hindcast simulation of the North Pacific using the Ocean General Circulation Model for the Earth Simulator (OFES*1). It aimed to validate impacts of smaller oceanic structures called submesoscales (with 1–50 km scales) on ocean circulation. Results highlighted for the first time that 1) these submesoscales are more energetic in winter and related to deepening of mixed layer*2 in a very large part of the North Pacific Ocean covering the Kuroshio Extension area; and 2) the kinetic energy (KE) cascades from submesoscales to mesoscale eddies*3 (100-300km), leading to a strong influence on the seasonality of ocean circulation.
Mesoscale eddies in the ocean play a large role in transport of properties such as heat and carbon dioxide as well as marine ecosystems on a global scale. However, the specific relationship between small-scale eddies and mesoscale eddies has not been identified.
This study results demonstrated its dynamics and significant impacts of small-scale eddies on mesoscale eddy activities. By carrying out a global simulation using high-resolution ocean model is expected to further determine how eddy dynamics and ocean circulation are impacted by rising sea surface temperature caused by global climate change. In addition, future wide-swath satellite altimeter missions scheduled to be launched in 2020 will provide an unprecedented global measurement of the high-resolution sea surface height (SSH)*4, which will capture detailed space distributions and seasonal variability of small-and mesoscale eddies in the global ocean. This observation data will also be used to validate our study results.
This research has been partially .supported by MEXT (Ministry of Education, Culture, Sports, Science and Technology) KAKENHI Grant Number 22106006 and JSPS (Japan Society for the Promotion of Science) KAKENHI Grant Number 25400473. Also, it has been carried out as part of international joint research between JAMSTEC and IFREMER (French Research Institute for Exploitation of the Sea).
This study results have been posted on Nature Communications on December 15th, 2014 (JST).
Title: Impact of oceanic scale-interactions on the seasonal modulation of ocean dynamics by the atmosphere
Authors:Hideharu Sasaki1, Patrice Klein2, Bo Qiu3, Yoshikazu Sasai4
1. Application Laboratory, JAMSTEC
2. Laboratoire de Physique des Oceans IFREMER-CNRS-UBO-IRD
3. Department of Oceanography, University of Hawaii
4. Research and Development Center for Global Change, JAMSTEC
*1. OFES (Ocean General Circulation Model for the Earth Simulator): Ocean General Circulation Model is a computer program that represents physical processes in the oceanic general circulation including current velocity, temperature and salt distributions. The OFES is the ocean model based on MOM3 (Modular Ocean Model developed by the GFDL (Geophysical Fluid Dynamics Laboratory)) and highly tuned for the JAMSTEC Earth Simulator. In this research, a high-resolution ocean model with 3-km horizontal resolution was used to simulate the Kuroshio and Oyashio currents, active menoscale eddies (100-300km), also smaller-scale eddies and filamental structures (several km to several tens of km) in the North Pacific. Since it is necessary to demonstrate variability in detail over a span of several years, it requires a large amount of memory and processing with computational grids up to 1.5 billion points. The Earth Simulator enabled to perform such a pioneering simulation.
*2. Mixed layer: It is the ocean surface layer with the almost uniform density. The mixed layer bottom is deeper in winter because of cooling over the ocean and deeper penetration of wind-driven mixing. On the other hand, the layer becomes shallower in summer when the surface temperature rises.
*3. Mesoscale eddies: Mesoscale eddies in the ocean have a scale of 100 to 300 km in diameter, and correspond dynamically to high and low pressure systems in the atmosphere. They have been observed around many of major ocean currents, and, in particular, are active around the Kuroshio, where the ocean current is strong. Mesoscale eddies transport heat, carbon dioxide and other properties. It plays an important role of ocean circulation and transport of properties.
*4 SSH (Sea Surface Height): The derivation of SSH using satellite observations is done by measuring the signal propagation time between the satellite and the ocean surface. It allows us to obtain horizontal pressure gradient and estimate sea surface velocity using equations with geostrophic assumption of balance between Coriolis force and horizontal pressure gradient. Therefore, the SSH is very useful to capture ocean circulation on a global scale. Currently, SSH is observed in narrow bands by radio waves transmitted from satellites, and the horizontal resolution is about 100km. On the other hand, earth observation satellites scheduled to be launched in the coming decade (e.g. SWOT mission by NASA & CNES: https://swot.jpl.nasa.gov/, http://smsc.cnes.fr/SWOT/) are expected to capture SSH data for global ocean with high resolution of several kilometers. The satellite will be equipped with a new type of radar called Ka-band radar interferometry at either end of a 10-meter mast, allowing it to measure the elevation of the ocean surface along a 120 - kilometer -wide swath below.
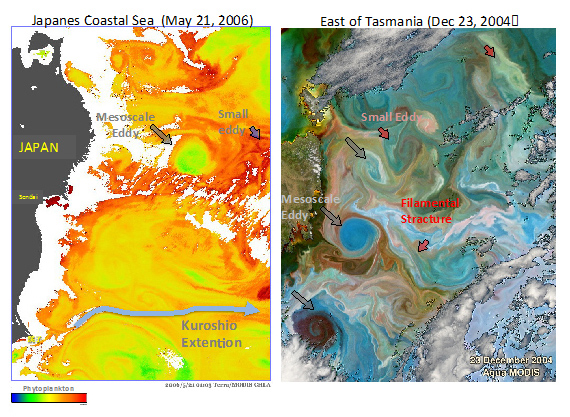
Figure 1: Distribution of phytoplankton on the sea surface off the coast of Sanriku (left provided by JAXA) and east of Tasmania (right from NASA MODIS Ocean Color Images).
Mesoscale eddies (100-300km) and filamental structures (several 10km) are observed.
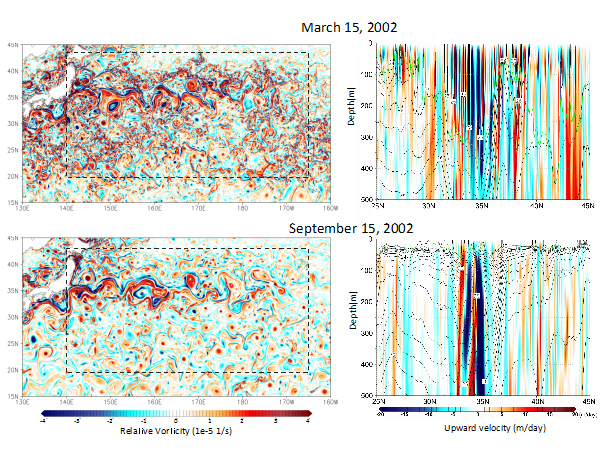
Figure 2: Left: Surface relative velocity in the Northwestern Pacific in winter (March 15, 2002) and summer (September 15, 2002) (red color indicates warm clockwise eddies, and blue indicates cold anticlockwise eddies.). Right: North-south cross sections of vertical velocity of 155˚E (color) and density (contour).
Around the Kuroshio Extension flowing eastward in the Northwestern Pacific from the South Coast of Japan, submsoscale eddies (several km-50km) and filamental structure are ubiquitous (top left), while mesoscale eddies (100km-300km) are dominant in summer (lower left). In winter, strong vertical motions with horizontal scale up to 50km are observed in the mixed layer with 200-300m thickness, where the density is about the same as at the surface (upper right), and vertical motions are weak in summer when the mixed layer depth is shallow (lower right).
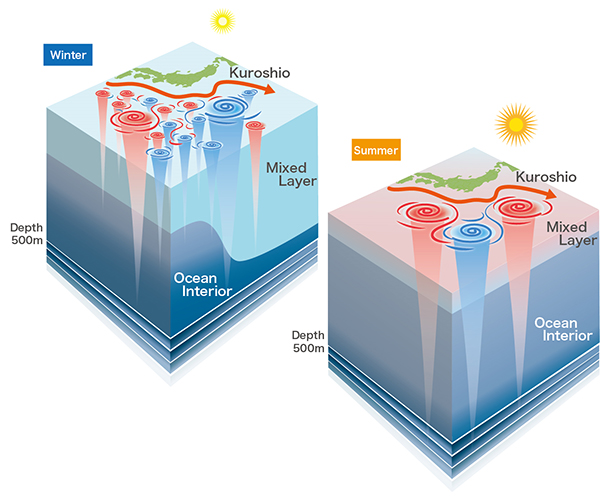
Figure 3: Seasonal changes in mixed layer depth and eddy activities
In winter, the mixed layer with consistent density at sea surface becomes thicker because of cooling of ocean surface with lower air temperature and strong surface wind due to active atmospheric cyclones (left). On the other hand the mixed layer depth is shallow in summer due to calm wind and stronger solar radiation (right). Submesoscale structures (small scale eddies and filamental structure) become active when mixed layer depth is large in winter (left), while becoming calm in summer when the mixed layer is shallow (right). As the season changes from winter to summer, a KE cascades from submesoscale to mesoscale structures, gradually growing the scale of active oceanic structures.
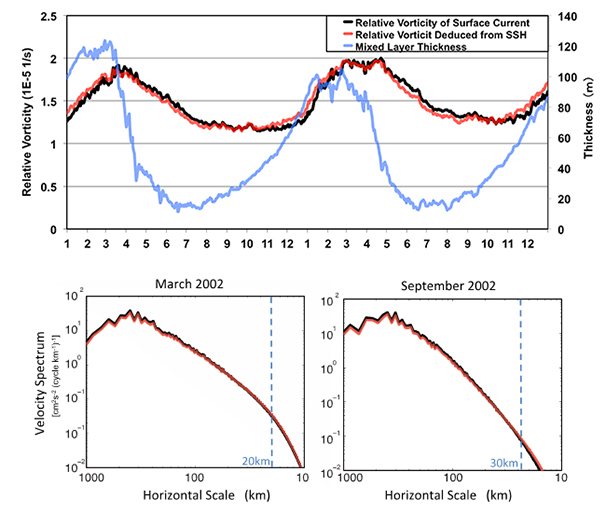
Figure 4: Upper: Time series from January 2001 to December 2002 in the Northwestern Pacific (140°E–165°W and 20°N–43°N): Relative velocity r.m.s. deduced from surface velocity (black), relative velocity of geostrophic velocity estimated from SSH (red), and the mixed layer thickness (blue). Below: Wavenumber spectra of surface velocity (black) and geostrophic velocity estimated from SSH (red).
The upper shows that in winter with thick mixed-layer, submesoscles become energetic with increased relative velocity of current velocity. As the mixed-layer becomes shallow, it also gradually becomes weak. Relative velocity estimated from SSH also indicates seasonality of the submesoscale dynamics with good accuracy. The below clearly shows that the wavenumber spectrum of geostrophic velocity estimated from SSH (red) is very close to that of surface velocity (black) in a wide scale range (from 20-30km to 1000km).
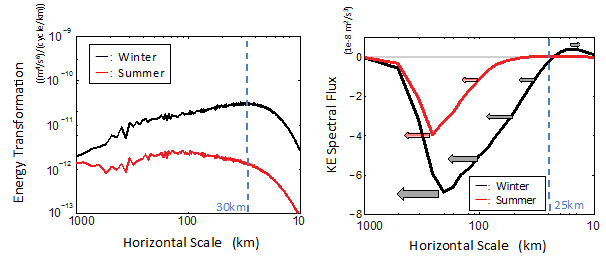
Figure 5: Wavenumber spectra and spectral fluxes. Left: Transformation from potential energy (PE) to KE averaged in mixed layer in winter (black) versus in summer (red). Right: KE spectral fluxes using geostrophic velocities in winter (black) versus in summer (red). For a given wavenumber, they represent (when positive) the KE that fluxes from smaller wavenumbers to larger ones.
The left shows large energy transformation from PE to KE in the submesoscale range around 30 km in winter. In this scale range, the submesoscales are strongly induced. The right shows that in winter, large KE is transformed from small scale into large scale in the scale range larger than 25 km, which shows significant energy transformation from submesoscales to mesoscales. On the other hand, energy dissipates into smaller scales in the scale range smaller than 25 km.
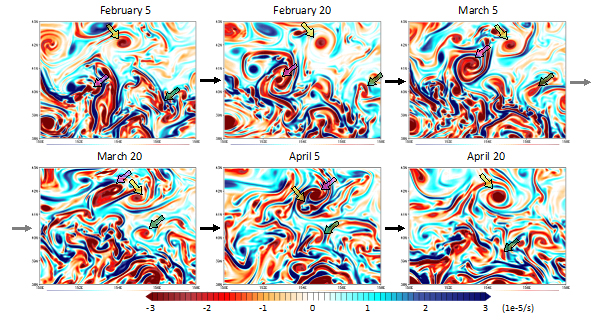
Figure 6: Enlarged distribution of surface relative velocity (the warm color shows warm clockwise eddies, and cool color shows cold anticlockwise eddies) in the south of the Kuroshio Extension.
A submesoscale eddy (shown by pink arrow) is growing to a mesoscale eddy and takes in a small eddy (shown by yellow arrow). In this process, the KE is transformed into larger scale structures between February and April in 2002. On the other hand, some submesoscale eddies (shown by green arrow) disappear in a short time even after their generations.
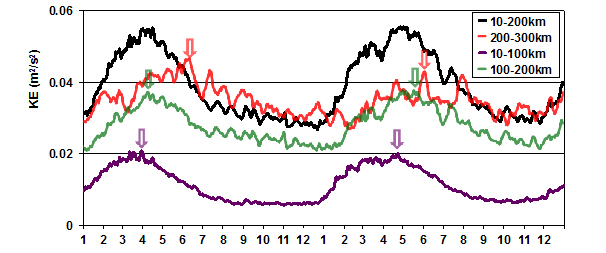
Figure 7: KE variability between January 2001 and December 2002.
The KE is larger in winter while smaller in summer. KE in the scale range including submesoscales and mesoscale eddies (black line) in winter is two times larger than in summer. In addition, maximum KE at the larger scales emerges about one month later after the smaller scales, indicating a few months duration of inverse KE cascade from small to large scale starting from late winter.
Smaller-scale Eddy Variability in Northwest Pacific Reproduced by Earth Simulator
Contacts:
- (For this study)
- Hideharu Sasaki, Senior Scientist, Climate Variability Prediction and Application Research Group, Application Laboratory
- (For press release)
- Kazushige Kikuchi, Manager, Press Division, Public Relations Department