Press Releases
March 31, 2016
JAMSTEC
Greenery Effect in Tokyo Bay Zone Analyzed
by Ultra-high-resolution Numerical Simulations
- Contribute to sustainable environmental measures
towards and beyond 2020 Tokyo Olympics and Paralympics -
Overview
The Center for Earth Information Science and Technology (CEIST) at the Japan Agency for Marine-Earth Science and Technology (JAMSTEC) carried out ultra-high-resolution numerical simulations to clarify the greenery effect around the Tokyo Bay Zone, where many venues for the 2020 Tokyo Olympic and Paralympic Games will be located. The greenery effect on wind, temperature and humidity on a hot day was quantitatively analyzed by using the JAMSTEC's supercomputer, the Earth Simulator.
The simulation results clearly show how sea breeze reaches the center of Tokyo and how existing green spaces could contribute to reducing temperature. Taking into consideration of audience in the venues and the pedestrian spaces, the wet-bulb globe temperature (WBGT)*1 was also evaluated. It also demonstrated that planting trees and taking countermeasures against surface heat such as growing green lawns around trees would be effective for further improvement of heat environment.
Under cooperation with the Ministry of the Environment and the Ministry of Education, Culture, Sports, Science and Technology, this project was carried out to provide information on sustainable heat measures for climate changes and heat islands as changes in urban infrastructure is expected towards the 2020 Tokyo Olympics and Paralympics. These results should serve as beneficial data and knowledge for formulating effective environmental measures to design sustainable urban areas in Tokyo. Further analysis of obtained large-scaled data will help examine specific and effective heat measures in a comprehensive manner in consideration of sea breeze and green spaces.
These high-resolution-simulations were performed by using the Multi-Scale Simulator for the Geoenvironment (MSSG)*2 on the new Earth Simulator, which started full-scale operation in June 2015. They presented that MSSG is a powerful tool to evaluate measures of urban thermal environment.
These study results are partially based on findings from “Research Program on Climate Change Adaptation (RECCA)” supported by the Ministry of Education, Culture, Sports, Science and Technology.
*1 Wet Bulb Globe Temperature (WBGT) is a heat stress index that takes into account of humidity, solar radiation and temperature on humans. If the WBGT index is greater than 28°C, heatstroke risk becomes higher in all daily activities (Japan Society of Biometerology, the third version of “Guidelines for prevention of heatstroke in daily lives” in 2013).
*2 Multi-Scale Simulator for the Geoenvironment (MSSG) is a multiscale atmosphere-ocean coupled numerical simulation model in which global, meso-and urban scales are incorporated. While meteorological simulation models are typically developed to perform simulations on one of those scales, MSSG is developed to operate for all of those scales, taking into account physical interactions between them. It can simulate temporal variation of a three-dimensional wind, temperature and humidity in consideration of three-dimensional radiative heat transfer and heat exchange at the external surfaces of buildings and tree crowns.
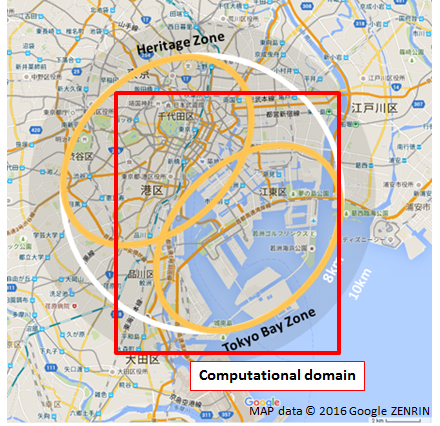
Figure 1. Tokyo Bay Zone and Game Venue
Prepared based on the initial environmental impact assessment toward the 2020 Tokyo Olympics and Paralympics by The Tokyo Organising Committee of the Olympic and Paralympic Games (February, 2013)
(Latest information on venue plan: https://tokyo2020.jp/jp/games/venue/olympic/)
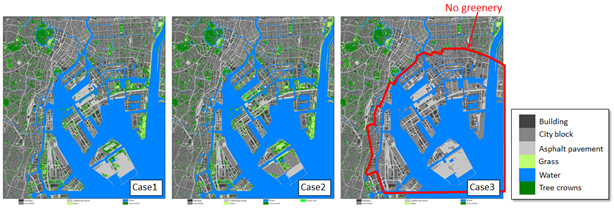
Figure 2. Use of land and distribution of tree crowns
(Case1) Current condition (GIS data in 2011); (Case2) Expected condition in 2020 (based on the venue plan as of November, 2015); (Case3) Current condition on the assumption that there are no green spaces in Tokyo Bay Zone.
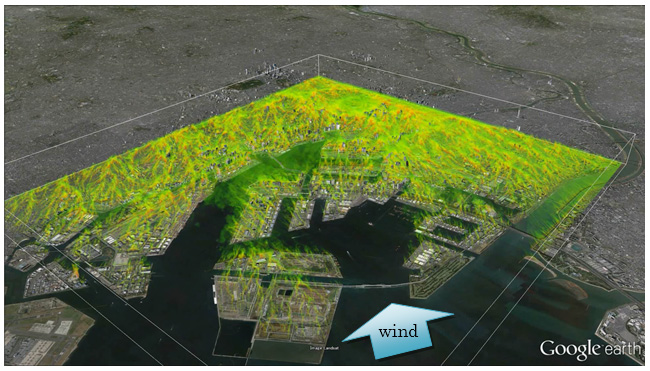
Figure 3. Three-dimensional temperature distribution
Sea breeze is flowing from southwest to northwest direction. The changes of colors from transparency to green, yellow green, and orange indicate increasing temperature.
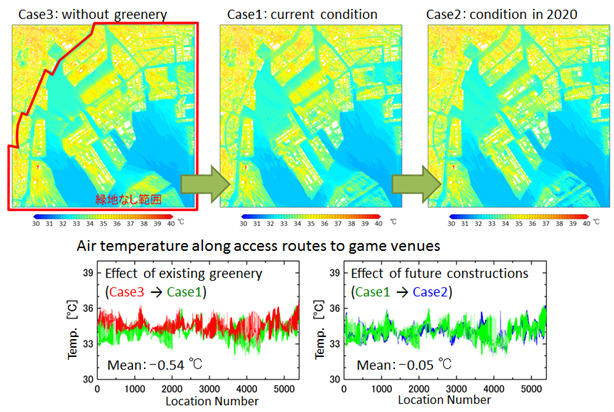
Figure 4. Comparison of air temperature near the ground
(Air temperature at 2.5m above the ground. Mean values of 10 minutes from 12:50 to 13:00.
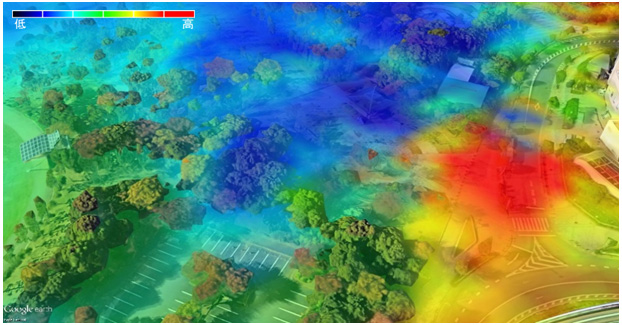
Figure 5. Green spaces and temperature distribution
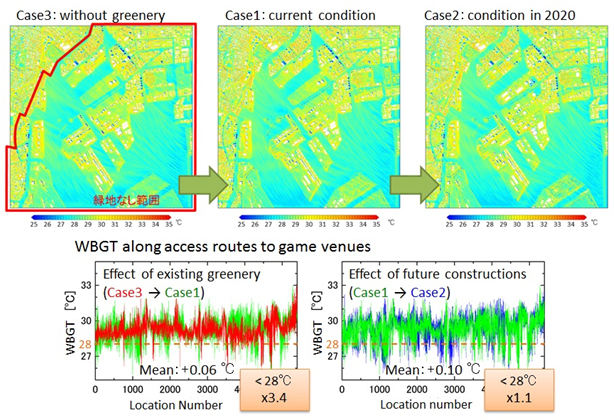
Figure 6. Comparison of WBGT
(WBGT at 1.1m above the ground. Mean values of 10 minutes from 12:50 to 13:00.)
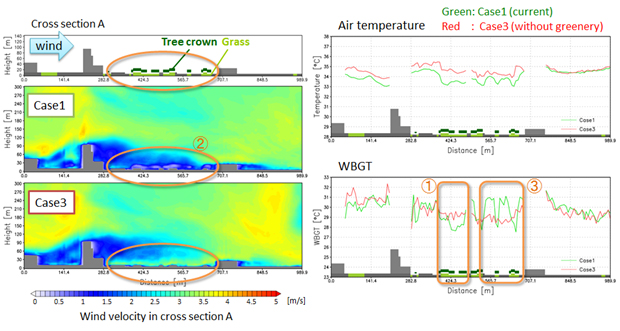
Figure 7. Distribution of wind velocity, air temperature and WBGT in vertical cross section A (cross section of direction along sea breeze in waterfront areas).
The left shows distribution of wind velocity in vertical cross section A. The blue color indicates areas with low wind velocity. The right shows comparison of distribution of air temperature near the ground (top) and WBGT (bottom). There is a significant decrease in the air temperature in the shade under tee crowns, while WBGT occasionally show increases due to windbreak by trees and decrease in sky view factors in sunny places (such as asphalt pavement) near green places. (Temperature is calculated at 2.5m above the ground and WGBT at 1.1m. Wind velocity, temperature and WGBT are mean values of 10 minutes from 12:50 to 13:00.)
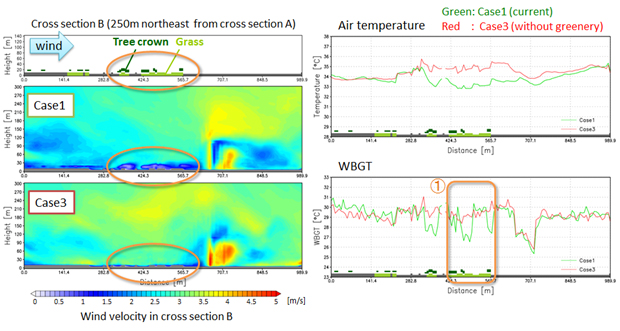
Figure 8. Distributions of wind velocity, air temperature and WBGT in vertical cross section B (cross section located 250m northeast from cross section A. Cross section of A and B are in parallel). The left shows distribution of wind velocity in vertical cross section B. The right shows comparison of distribution of temperature near the ground (top) and WBGT (bottom). WBGT does not increase largely if lawns are laid in sunny places near green areas, which means tress and grasses could create a synergy effect for improvement of heat environment. (Temperature is calculated at 2.5m from the ground and WGBT at 1.1m. Wind velocity, temperature and WGBT are mean values of 10 minutes from 12:50 to 13:00. )
Distribution of Summer Temperature in Tokyo Bay Zone
Contacts:
- (For this study)
- Keigo Matsuda, Scientist, Earth Simulation Research Group, Advanced Earth Information Research Group, Center for Earth Information Science and Technology (CEIST)
- (For press release)
- Hiroyasu Matsui, Press Division, Public Relations Department