Press Releases
JAMSTEC
Hokkaido University
Water Vapor Content Increases Markedly with Increase in Air Temperature
- Indication of the possibility of more intense precipitation -
A research team formed by Mikiko Fujita, a Research Scientist at the Department of Seamless Environmental Prediction Research at the Japan Agency for Marine-Earth Science and Technology (JAMSTEC; President Asahiko Taira) and Associate Professor Tomonori Sato of the Faculty of Environmental Earth Science, Hokkaido University analyzed the relationship between the overall atmospheric water vapor content in the whole area of Japan during the past 15 years, as estimated from GPS satellite data (“precipitable water vapor*1”), and daily mean surface air temperature (surface air temperature). It was clear that precipitable water vapor increased in response to elevated surface air temperature at a rate faster than hitherto anticipated.
In general, atmospheric water vapor content increases at a specific rate with increases in air temperature. However, in reality, the upper air temperature and vertical water vapor distribution also change as surface air temperature increases (Figure 1); therefore, it is difficult to accurately estimate the increasing rate, which includes the water vapor content of the upper air (*2), with data measured at the ground surface level. Statistical analysis is particularly difficult because there are insufficient data to investigate extremely humid conditions that potentially cause heavy rain.
Accordingly, in the present study, the increasing rate in precipitable water vapor, response to elevated air temperature, was estimated from a large amount of GPS satellite data. The results, which incorporated theoretical calculations and considered changes in the water vapor content in the upper air, showed clearly that under some circumstances, the increasing rate in precipitable water vapor, in response to a 1 °C increase in surface air temperature, is greater than the 7% previously thought; it can be as much as 11–14%. These values indicate the importance of variation in the air temperature and water vapor content of the upper air.
The water vapor content of the upper air and the amount of precipitation observed at the surface are closely related; therefore, the possibility of an increase in the amount of precipitation within a unit of time (i.e., the intensity of precipitation), due to an increase in atmospheric water vapor caused by increased surface air temperatures accompanying global warming, has been mentioned. The present results are based on observations of water vapor content; however, we consider them important for understanding future changes in the intensity of precipitation because they indicate the possibility of precipitation more intense than anticipated.
This study project was supported by the Global Environmental Research Fund (RFa11-01, 2RF-1304) of Ministry of the Environment Government of Japan, JSPS KAKENHI Grant Number 15K16316 and 15H05464, and also the Social Implementation Program on Climate Change Adaptation Technology (SI-CAT) by Ministry of Education, Culture, Sports, Science and Technology (MEXT).
The above results were posted in Scientific Reports on July 6, 2017 (JST).
Title: Observed behaviour of precipitable water vapor and precipitation intensity in response to upper air profiles estimated from surface air temperature
Authors: Mikiko Fujita1, Tomonori Sato2
1. Department of Seamless Environmental Prediction Research, JAMSTEC
2. Faculty of Environmental Earth Science, Hokkaido University
*1 Precipitable water vapor: Atmospheric water vapor content as the vertical cumulative value from the surface to the top of the atmosphere, usually expressed in the same unit (mm) as precipitation.
*2 Water vapor content of the upper air: In the present study, the value for precipitable water vapor, calculated from GPS observations after subtracting the water vapor content in the atmospheric boundary layer (assuming saturated situation), is defined as the water vapor content in the upper air.
The atmospheric boundary layer is the lower layer of the atmosphere that is strongly affected by the Earth’s surface. In the present study, it is postulated that the cumulative water vapor content within the atmospheric boundary layer is determined by the air temperature and the water vapor content at the surface.
*3 Air temperature lapse rate: The change in the temperature of a parcel of air as its altitude rises adiabatically. When the atmosphere is saturated by water vapor it is termed the “moist adiabatic lapse rate”, and the air temperature lapse rate is smaller than for a dry atmosphere due to the latent heat of condensation.
*4 Percentile value: Percentile. In this study, the relative position in the sequence of the sorted dataset when the total is 100.
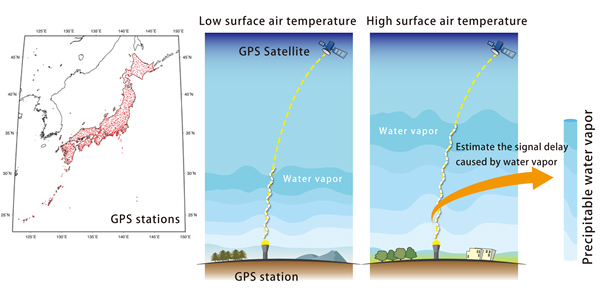
Figure 1. The distribution of the GPS observation points employed in this study, and schematic figures of GPS precipitable water vapor. The moist atmospheric layer, with much water vapor, is thicker when the air temperature is higher than when it is low.
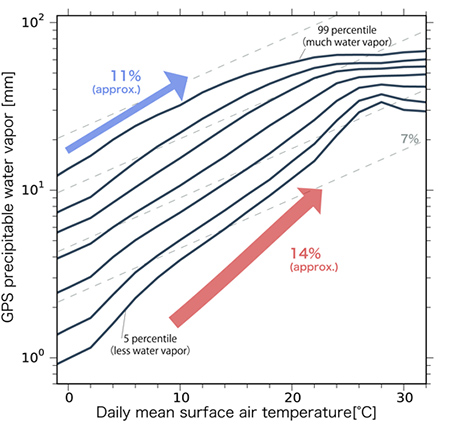
Figure 2. The relationship between daily mean surface air temperature and one-hour precipitable water vapor, calculated from GPS observations. Because of the variation in the precipitable water vapor at the same daily mean surface air temperature, the values of the 5th, 10th, 25th, 50th, 75th, 90th, and 99th percentile (*4) calculated for each 2 °C of daily mean surface air temperature are shown. The uppermost solid line shows the upper extreme for precipitable water vapor content relative to daily mean surface air temperature (the x-axis), and the bottommost solid line represents the lower extreme. When the daily mean surface air temperature is less than about 16 °C, the increasing rate in precipitable water vapor content with air temperature is greater than the 7% value previously anticipated (gray broken lines), increasing instead at around 11–14%.
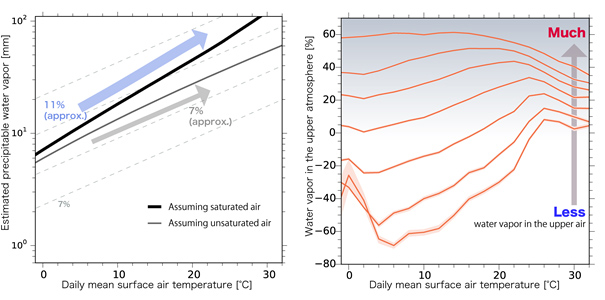
Figure 3
Left: The differences in the increasing rate of theoretical precipitable water vapor content, estimated using the air temperature lapse rate. In a dry atmosphere, the increasing rate is close to the anticipated value of 7%; however, when the atmosphere is saturated (with air temperature estimated by employing the moist adiabatic lapse rate), the increasing rate in precipitable water vapor content in response to surface air temperature varies more strongly, by about 11%. This variation corresponds roughly to the upper value in Figure 2 (upper extreme for precipitable water vapor).
Right: Upper air water vapor content as a percentage, relative to precipitable water vapor according to the GPS satellite. The solid lines correspond, from top to bottom, to the percentiles in Figure 2. The relative percentage of upper air water vapor content increases as surface air temperature increases because of the dynamic transport of water vapor into the upper air.
Contacts:
- (For this study)
- Mikiko Fujita, Research Scientist, Department of Seamless Environmental Prediction Research, JAMSTEC
- Mikiko Fujita, Research Scientist, Department of Seamless Environmental Prediction Research, JAMSTEC
- (For press release)
- Tsuyoshi Noguchi, Press Division, Public Relations Department, JAMSTEC
- Takanao Kitano, Public Relations Divion, Hokkaido University