Press Releases
JAMSTEC
The University of Tokyo
Impacts of Global Warming on Tropical Cyclone
- Radius of gale force wind likely to expand-
Under warmer climate conditions, tangential wind speed increases in the outside region of the eyewall of tropical cyclones at the same intensity categories—a total set of 60-year simulations for investigating tropical cyclone (TC) activity and structure performed with a Nonhydrostatic Icosahedral Atmospheric Model (NICAM) revealed. Such changes in radial distribution of wind speed are related to the elevation of the tropopause due to global warming, which induces an upward extension of the TC eyewall. The increase in tangential wind outside of the eyewall suggests expansion of radius of gale force wind under warmer climate conditions. In addition, the model has projected that the annual number of TCs would decrease on a global scale, while the ratio of intense TCs and the rainfall within 100 km of the center of TC would increase. These changes are consistent with results that have been demonstrated in previous studies using hydrostatic global model with cumulus parameterization.
The above study was carried out by Yohei Yamada and Chihiro Kodama at the Japan Agency for Marine-Earth Science and Technology (JAMSTEC) in collaboration with Masaki Satoh at Atmosphere and Ocean Research Institute, the University of Tokyo.
This work was partly supported by the innovative High Performance Computing Infrastructure (HPCI) Strategic Programs for Innovative Research “Field 3”, Program for Generation of Climate Change Risk Information, and, the FLAGSHIP2020 project of the Japanese Ministry of Education, Culture, Sports, Science and Technology (MEXT) using computational resources of the K computer provided by the RIKEN Advanced Institute for Computational Science through the HPCI System Research project (Project ID: hp120279, 582 hp130010, hp140219, hp150213, hp150287, and hp160230).
These results were published in Journal of Climate issued by the American Meteorological Society on September 14, 2017 (JST).
Title: Response of tropical cyclone activity and structure to global warming in a high-resolution global nonhydrostatic model
Authors: Yohei Yamada1, Masaki Satoh2,1, Masato Sugi3, Chihiro Kodama1, Akira T. Noda1, Masuo Nakano1, Tomoe Nasuno1
1. JAMSTEC 2. Atmosphere and Ocean Research Institute, The University of Tokyo 3. Meteorological Research Institute
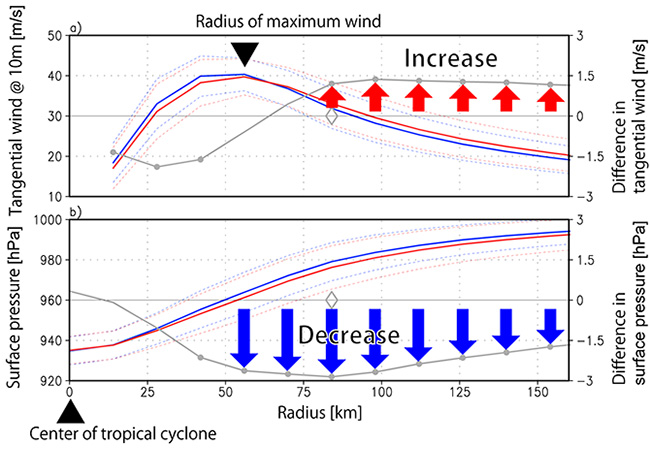
Figure 1. Composite radial profiles of (a) azimuthal mean tangential wind at 10-m, and (b) surface pressure of tropical cyclones (920 hPa < central surface pressure ≦ 945 hPa). Blue and red solid lines denote results of the present-day and future climate simulations, respectively, and these are scaled by the left y axis. Dotted lines indicate the standard deviations. Gray lines are the differences in each variable scaled by the right y axis. Circles on the gray lines indicate a significant change at the 95% confidence level (two-sided Welch’s t test). Diamonds indicate the radius of the maximum decrease in surface pressure.
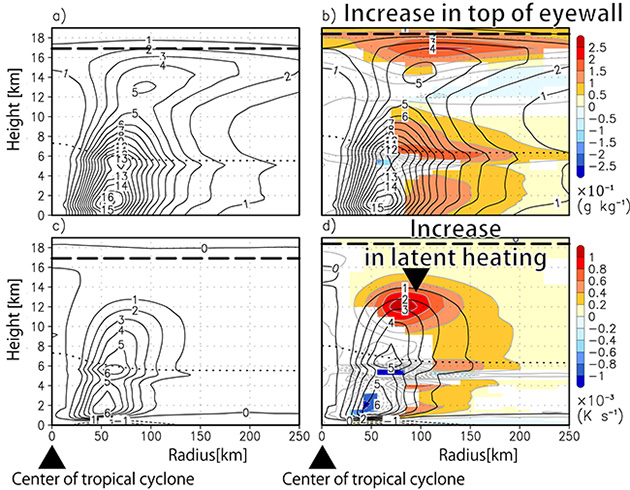
Figure 2. Composite of radius–height cross sections for TCs (920 hPa < central surface pressure ≦ 945 hPa). Thin black lines are (a), (b), specific humidity of water contents (contour interval: 1.0×10⁻¹ g kg-1), and (c),(d) latent heating (contour interval: 1.0×10⁻³ K s-1), for the (left) present-day climate and (right) future climate simulations. Gray lines in (b) and (d) indicate differences between the present-day and future climate simulations; the solid and dashed lines mean an increase and a decrease in the future climate simulation, respectively. These contour intervals are 0.5×10⁻¹ g kg-1 in (b), and 0.2×10⁻³ K s-1 in (d) [shaded areas show where the differences are statistically significant at the 95% confidence level (two-sided Welch’s t test)]. The thick dashed line indicates the tropopause height, and the thick dotted line represents the melting level. The tropopause height is defined based on definition of the World Meteorological Organization (WMO) by using the vertical profile of the average temperature within the 1,500-km radius from the center of the TC.
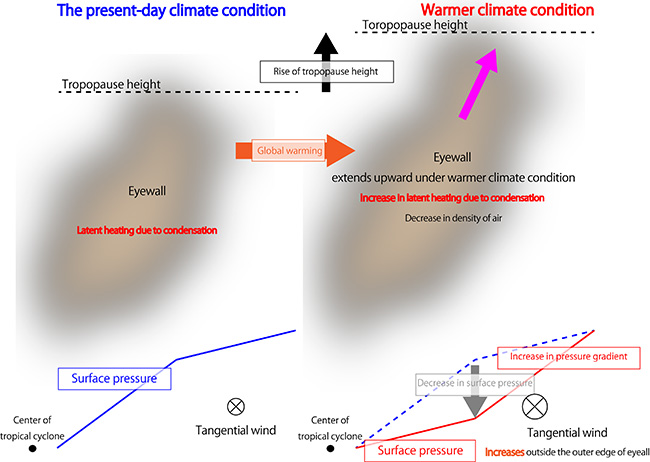
Figure 3. Diagram showing mechanism of changes in distribution of wind velocity around TC with eyewall changes.
Global warming causes an upward extension of TC eyewall, which increases heat released during cloud formation. The atmosphere is heated more than that in the present-day climate while the density is reduced. Even if the atmospheric pressure of the land surface is the same in the TC center, the atmospheric pressure decreases under the eyewall in the future projection than the present-day climate. It increases wind velocity around the outer edge of the wall.
Contacts:
- (For this study)
- Yohei Yamada, Postdoctoral Researcher, Project Team for HPC Advanced Predictions utilizing Big Data Research Unit for Predictability of Global Weather Extremes, JAMSTEC
- Masaki Satoh, Professor, Atmosphere and Ocean Research Institute, The University of Tokyo
- (For press release)
- Tsuyoshi Noguchi, Manager, Press Division, Public Relations Department, JAMSTEC
- Yoko Ogawa, Public Relations, Atmosphere and Ocean Research Institute, The University of Tokyo