February 10, 2011
Japan Agency for Marine Earth Science and Technology
Atmospheric variability over the Barents and Kara Sea and Eurasian continent which brings severe cold air outbreak in Japan and East Asia
Introduction
Scientists at the Japan Agency for Marine-Earth Science and Technology (JAMSTEC), Research Institute for Global Change (RIGC), Northern Hemisphere Cryosphere Program investigated the cold air outbreak that frequently arrived during the 2009-2010 winter and discovered that the process is governed by a 2-step mechanism where (1) a strong cold air build up occurs over the Eurasian continent when there is a positive anomaly in the pressure over the Barents/Kara Sea, and (2) following this pressure anomaly, meandering of the jet stream develops and brings the cold air buildup towards Japan and the East Asia region.
The mechanism presented in this study can also be seen during the 2010-2011 winter where a persisting cold weather occurred over Europe in late 2010 and a strong cold air outbreak occurred in Western Japan a week later.
Previously, the negative phase of the Arctic Oscillation(AO)(*1) was blamed for the dominance of cold air in the mid-latitudes. However, the Arctic Oscillation alone is insufficient in explaining why and when such cold air outbreak occurs locally in Japan. This study shows the strong ties of the Arctic and the mid-latitudes temperature variability which governs the local temperature over Japan. Also, the oscillatory manner in which the temperature rises and falls due to this process can be related to a traditionally known weather phenomenon, the San-Kan-Shi-On (3 days of cold followed by 4 days of warm weather), which prevails from winter through spring.
It is expected that by utilizing the results of this study, it is possible to make a forecast of cold air outbreak 7-10 days prior to reaching Japan. It is also expected that the study will be an important step in determining how global warming will affect the winter climate in the region. The study was published in the Scientific Online Letter of the Atmosphere (SOLA) on February 10.
Title: Recurrence of Intraseasonal Cold Air Outbreak During the 2009/2010 Winter in Japan and its ties to the Atmospheric Condition over the Barents-Kara Sea Authors? Masatake E. Hori, Jun Inoue, Takashi Kikuchi, Meiji Honda, Yohshihiro Tachibana Publication URL?http://www.jstage.jst.go.jp/browse/sola
Background
In the winter of 2009 and 2010, Japan and the East Asian region experienced a frequent occurrence of cold air outbreaks. Although the winter average temperature in the Japan main islands was slightly positive (+0.81°C for December to February (DJF) average and +0.71°C for November to Marth (NDJFM ) average), repeated decline in temperature was notable throughout the season (Fig.1a). From October 2009 to March. 2010, there were 10 cases of cold air outbreaks reaching Japan. Except for the case in mid-January, the negative peak is preceded by a positive temperature anomaly that drops rapidly within 6-10 days.
In the seasonal scale, this negative AO is a good explanation for the observed negative temperature anomaly over the Eurasian continent, East Asia, and over North America. However, while extremely negative AO certainly played a role in developing the cold air that frequented Japan, it is not sufficient in explaining how and why the cold air outbreak was dominant locally in the region nor does it explains the strong periodicity of the temperature anomaly.
For example, the daily AO index shown in the lower panel of Figure 1 was indeed negative during December through March, but during October and November it was mostly neutral. There were three cases of cold air outbreak in this time period which shows that negative AO do not necessarily bring cold air to the Japan region. Similarly, although the AO index was dominantly negative during December through March, the timing of cold air outbreak reaching Japan is periodic in nature and AO alone is insufficient in explaining the timing of which the cold air arrives.
With these lines of argument in mind, the source of cold air during the 2009-2010 winter and the accompanying atmospheric circulation is investigated through a case study and lag-regression analysis with the emphasis on the intraseasonal timescale.
Results
Among these cases, December 18th is marked to be the most intense, where the negative anomaly reached -3.47°C, the lowest in DJF average, and the difference of temperature from 6 days ago (Dec.12) was 8.41°C. Focusing on the 500hPa geopotential height field which represents the location of the high/low pressure system, it was found that 10 days prior to the arrival of cold air strong high pressure ridge was present over the Barents and Kara Sea (*2) which created a cold air build up in the Western Siberian region (Fig. 2a).
High pressure ridge over the Barents Sea gradually moves westward to form a persisting blocking high (*3). On the other hand, the cold air build up in western Siberia is elongated along the low-pressure trough (Fig. 2b). Finally, a wave pattern on the eastern side of the blocking high corresponding to the meandering of the jet stream brings the cold air eastward towards Japan (Fig. 2c).
It can be seen that the December 18 case proceeded in 2 steps; 1) a strong cold air buildup corresponding to the high pressure system over the Barents Sea becomes apparent in Western Siberia, and 2) meandering of the jet stream in the downstream of the blocking high advects the cold air buildup towards Japan. This process can be seen in at least 5 out of the 10 cases of cold air outbreak that occurred during 2009 and 2010 (Fig. 3).
To show that this process was dominant during the 2009-2010 season, a lag regression analysis of temperature and gepotential height field against the temperature anomaly timeseries over Japan from October 1 through March 30 is shown in Figure 4. This corresponds to the relative change in pressure and temperature when Japan experiences a 1°C change in surface temperature in the following days. Here again, 10 days prior to the arrival of cold air, a positive pressure can be seen over the Barents Sea which creates a cold air anomaly over the Western Siberian region (Fig. 4a). In the following days, a wave pattern induced by the blocking high over the Atlantic Sea brings the cold air anomaly eastward (Fig. 4b and c).
Another notable feature is that following this cold air anomaly a strong warm anomaly can already be seen which creates the oscillatory nature surface temperature which was notable in Figure 1. This oscillatory feature in surface temperature is traditionally known as the San-Kan-Shi-On (3 cold days followed by 4 warm days) in Japan, which can be explained by this wave pattern.
From this result, it can be seen that the cold air outbreak which frequently arrives in Japan can trace its root to the atmospheric variability over the Barents Sea and its associating cold air build up in the region. This process was also evident in the 2010-2011 winter. The most notable example was the case during late December 2010 where a strong cold air build up in Europe was followed by a strong cold air outbreak in western Japan around the early January of 2011.
Future studies and application
At this point, the mechanism of how the high pressure system over the Barents Sea becomes intensified is unknown. It is hypothesized that the interannual variability of the sea-ice and heat flux from the ocean may play a significant role, therefore, an observational study of the region is crucial. As of 2009, JAMSTEC is conducting a marine and atmospheric survey in collaboration with the Norwegian Institute of Marine Research. In January 13-29, 2011, two main authors in this research, Masatake E. Hori and Jun Inoue, conducted a pioneering atmospheric-ocean observation survey of the Barents Sea during the winter season onboard the research vessel Johan Hjørt of the Norway Institute of Marine Research.
Due to the warming trend of the Arctic and the decreasing trend in sea ice distribution, such air-sea interaction will continue to be important in the coming years. It is crucial to continue the observational study as well as projecting the future prospect of the region by utilizing climate models.
This study contributes to the enhancement of cold air outbreak forecasts in East Asia and Japan. Especially, by creating a forecast index for the pressure anomaly over the Barents and Kara Sea, it is expected that a near real-time forecast of the cold air outbreak may be possible.
Also, this study gives new insight into the traditional weather regimes in Japan known as the San-Kan-Shi-On and valuable from the standpoint of enhacing the scientific knowledge of our nation.
*1. Arctic Oscillation
An atmospheric variability where the pressure anomaly between the Arctic region (north of 60°N) and mid-latitudes (30°-60°N) oscillates in a reverse manner over the whole northern hemisphere. It is a relatively "large scale" phenomenon which is representative of the whole northern hemisphere or the state of the climate in the monthly to seasonal average. The negative AO is a state where the pressure over the Arctic is relatively higher and the mid-latitudes is relatively lower. The air mass flows from the Arctic towards the mid-latitudes which in case of winter it induces a severe winter over Europe, North America and Japan regions.
*2. Barents and Kara Sea
The region of relatively shallow sea in the Arctic off the coast of Norway and Russia. It stands as a crossroad of bringing heat, water vapor and salinity towards the central Arctic region. It is known that more than 70% of heat transferred from the ocean to the atmosphere takes place in this region and is a focus of attention from a climatological standpoint.
*3. Blocking
A large meandering of the jet stream which results in high pressure or low pressure system being cut off to persist for a long time period. It is called a blocking because it "blocks" the high and low pressure systems which otherwise would by migratory. Blocking causes the weather pattern to last for a long time resulting in abnormal weather.
Appendix
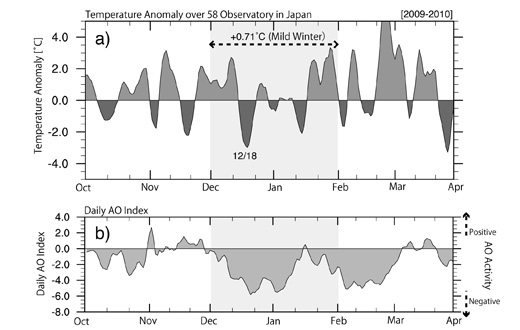
Fig. 1. Time series of (a) surface temperature anomaly averaged over 58 JMA* observatory in the Japan main islands, and (b) the daily AO Index. 5-day running mean is used to suppress the transient fluctuations. Capital letters in the horizontal axis denotes the start of a particular month.
(*JMA:Japan Meteorological Agency)
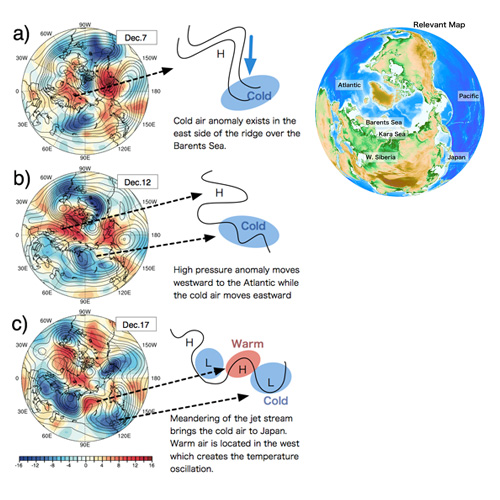
Fig. 2. 500hPa geopotential height field (contour) and 850hPa air temperature anomaly (shades) 10, 5, and 1 day prior to the arrival of the cold air in Japan for the case of December 18, 2009.
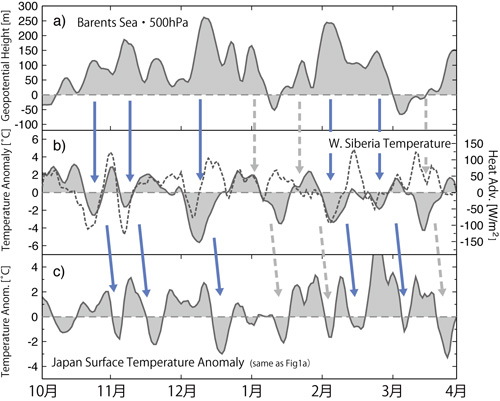
Fig. 3. Time series of (a) 500hPa geopotential height anomaly averaged the Arctic ocean covering the Barents-Kara Sea (0-100°E, 70-90°N), (b) 850hPa temperature anomaly and heat advection (dashed line) averaged over western Siberia (40-100°E, 45-65°N), and (c) the surface temperature anomaly based on 58 JMA observatory in the Japan main islands. Capital letters in the horizontal axis denotes the start of a particular month.
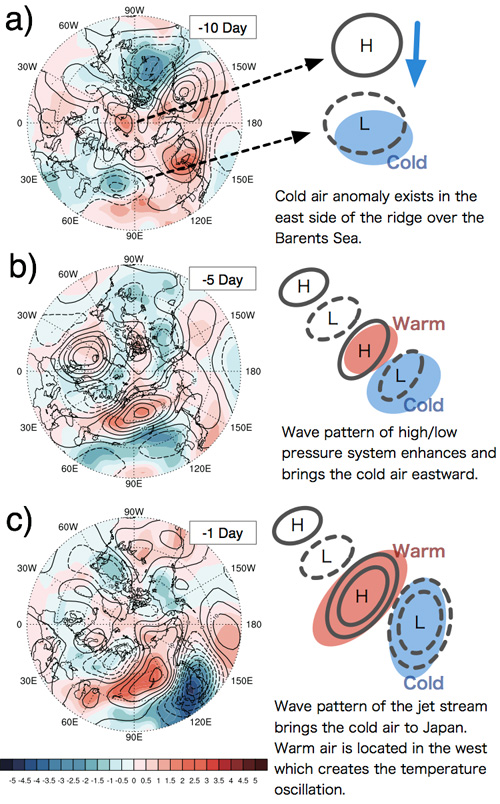
Fig. 4. Lag regression of 500hPa geopotential height field (contour) and 850hPa air temperature anomaly (shades) against the surface temperature anomaly over Japan corresponding to (a) 10 days, (b) 5 days, and (c) 1 day prior to the arrival of the cold air.
Contacts:
- Japan Agency for Marine-Earth Science and Technology
(For the study) - Masatake Hori, Research Scientist
Northern Hemisphere Cryosphere Program
Research Institute for Global Change (RIGC) - (For publication)
- Toru Nakamura, e-mail: press@jamstec.go.jp
Manager, Planning Department Press Office