
 On the cold snap over North America in early Jan 2014
North America has been experiencing a colder-than-normal winter since December 2013 and was hit by a particularly strong cold snap during the first week of January 2014. An unusual event of snow in Egypt and a very cold North American winter have brought some concern that the northern hemispheric climate may be cooling down. However, these extreme events, which are transient in nature, are unlikely to be related to mid- and long-term climate variations or change unless they begin occurring on a regular basis. North America experienced extremely cold snaps during the 1970's when the northern hemispheric climate was cooling and also during the 1990's when the northern hemispheric climate was warming. These events are generally products of dynamic and thermodynamic factors in the atmosphere and have nothing to do with mid- and long-term temperature trends in the northern hemisphere.
The figures below (Fig 1 - 14) show that the cold snap was associated with very large north-south meanders of the tropospheric westerly jet and may be viewed as a wave-like large disturbance on the so-called polar vortex. It thus is one side of the coin that has the cold snap over North America and a relatively mild condition over the North Atlantic Ocean and Eurasia, and implies that the surface temperature averaged over a large area affected by the disturbance on the polar vortex is not likely to be particularly anomalous.
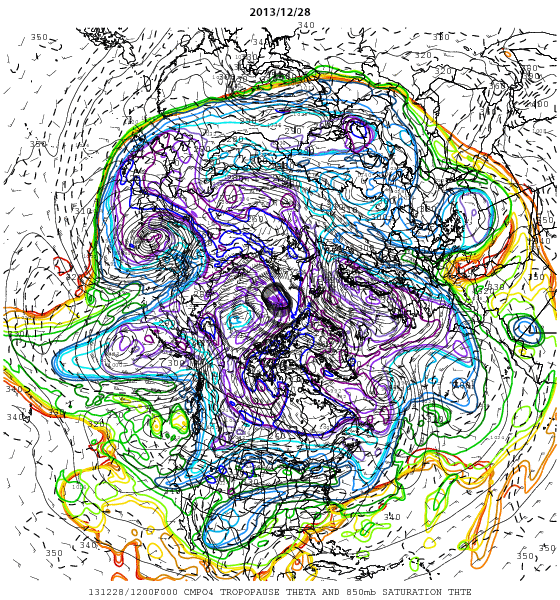
Fig 1. Potential temperature at the top of the troposphere (tropopause defined by potential vorticity=2PVU) on Dec 28 2013 shown by color contours. The contour interval is 5 degrees Kelvin. Warmer colors such as red and orange indicate higher temperatures, while cooler colors such as blue and purple indicate lower temperatures. The edge of the polar vortex, where the upper tropospheric jet is particularly strong, is approximately indicated by the blue contours. Densely-packed contours of multiple colors suggest the presence of strong wind. North Pole is situated at the center of the figure. North America may be seen in the lower half of the figure with the Florida Peninsula shown slightly above the bottom. Wave-like or vortex-like structures that have a spatial scale of thousands of kilometers visible on the blue contour reflect the presence of migratory transient disturbances. These disturbances are basically high- and low-pressure systems that move from west to east, and are associated with disturbances in the wind, temperature, etc, throughout the troposphere and in the lower layers of the stratosphere. These figures have been provided to us by the Massachusetts Institute of Technology Synoptic Laboratory.
(Click to enlarge Fig 1 - 14 below)
Fig 1.
Same as above, for Dec 28 2013
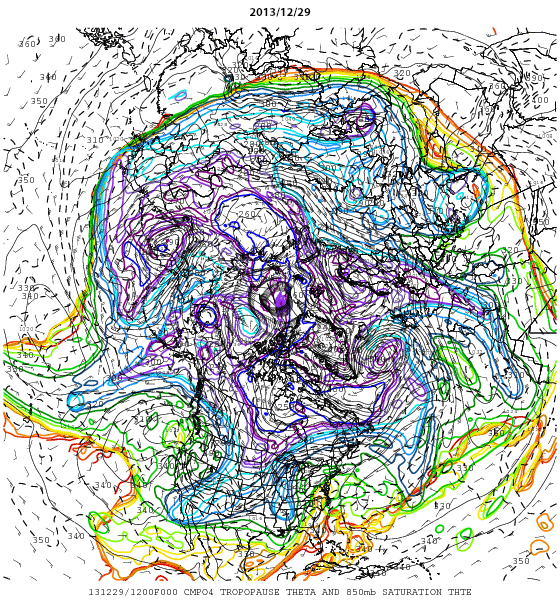
Fig 2.
As in Fig 1, but for Dec 29 2013.
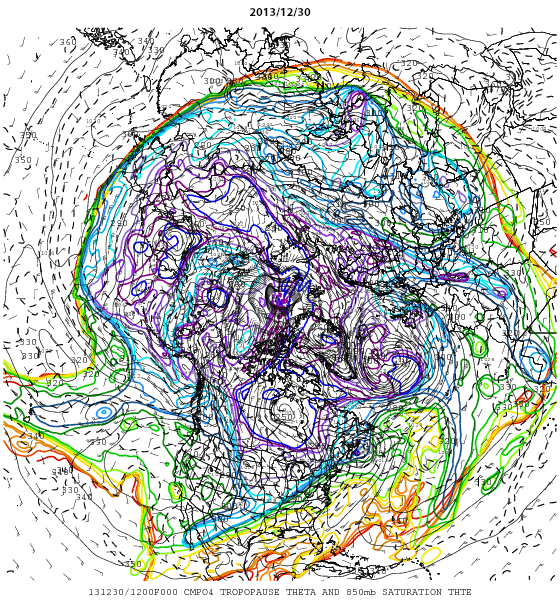
Fig 3.
As in Fig 1, but for Dec 30 2013.
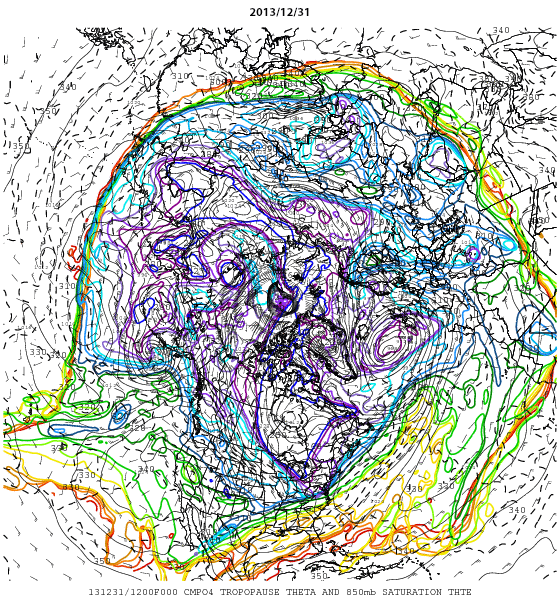
Fig 4.
As in Fig 1, but for Dec 31 2013.
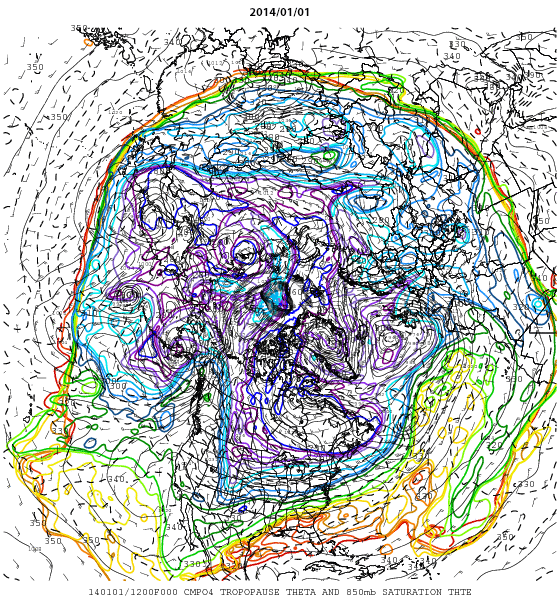
Fig 5.
As in Fig 1, but for Jan 1 2014.
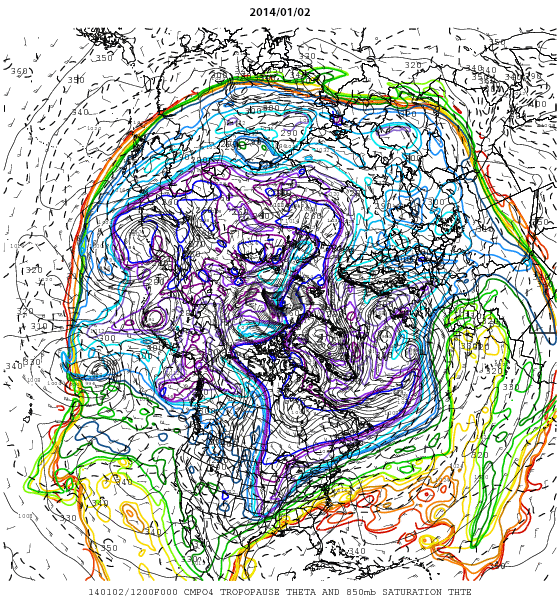
Fig 6.
As in Fig 1, but for Jan 2 2014.
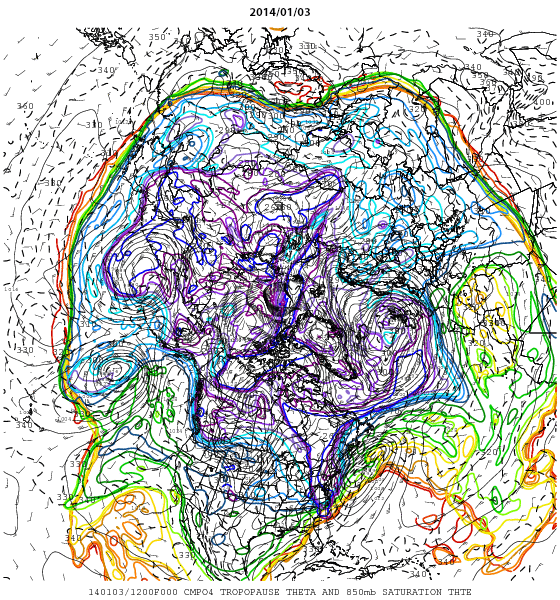
Fig 7.
As in Fig 1, but for Jan 3 2014.
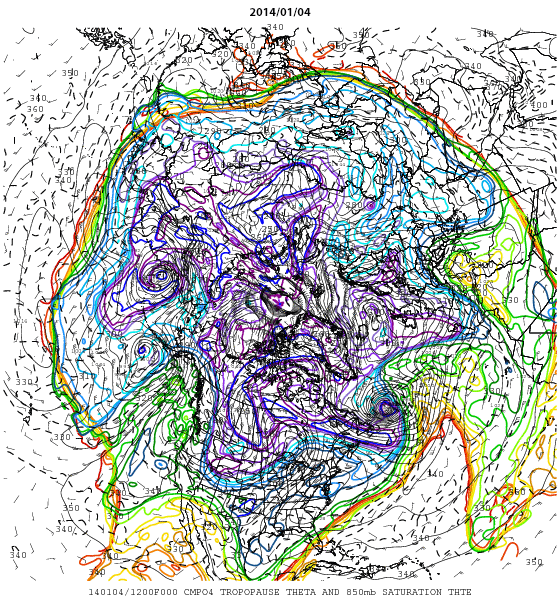
Fig 8.
As in Fig 1, but for Jan 4 2014.
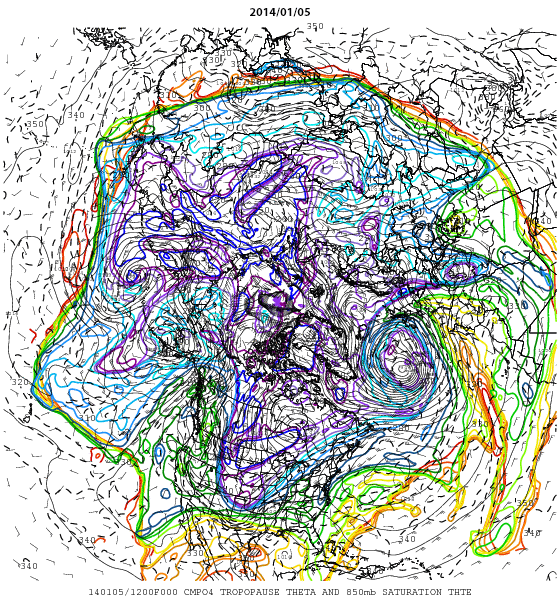
Fig 9.
As in Fig 1, but for Jan 5 2014.
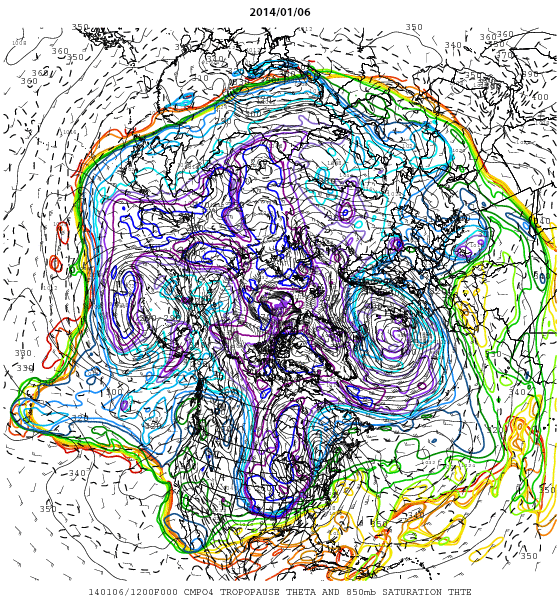
Fig 10.
As in Fig 1, but for Jan 6 2014.

Fig 11.
As in Fig 1, but for Jan 7 2014.
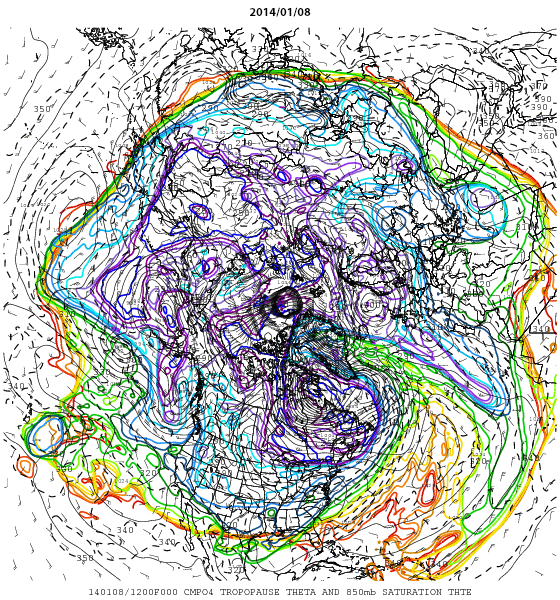
Fig 12.
As in Fig 1, but for Jan 8 2014.
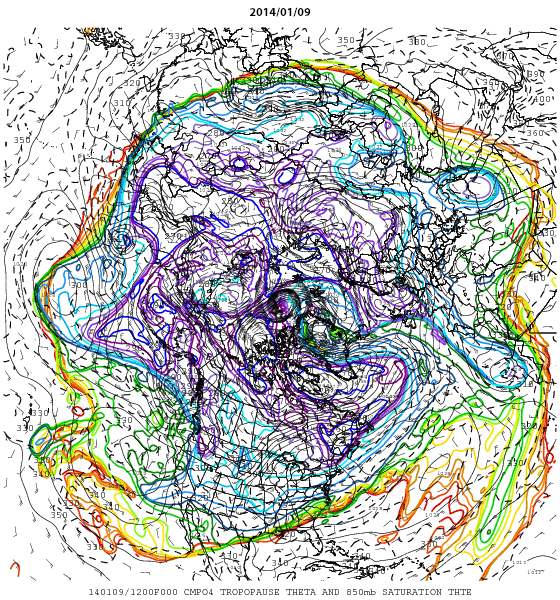
Fig 13.
As in Fig 1, but for Jan 9 2014.
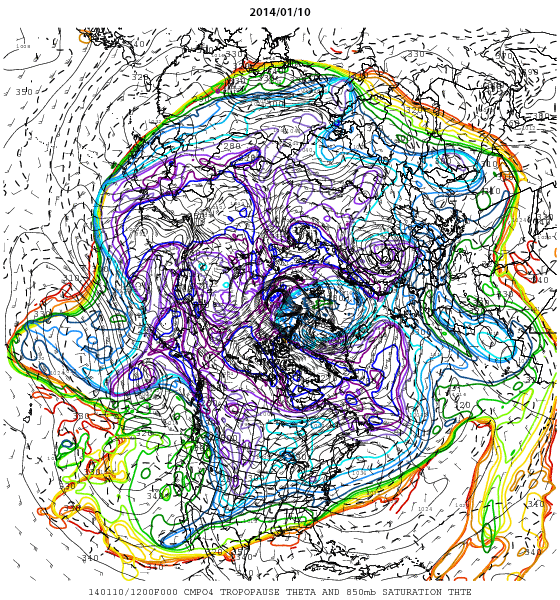
Fig 14.
As in Fig 1, but for Jan 10 2014.

Fig 15. Animated image of Fig 1 - 14
The cause of the large meanders cannot be attributed to a single factor and is likely to be a combination of several factors. Roughly speaking, there are six factors that can cause meanders in the westerly jet: (1) temperature contrast between a large land mass and ocean, (2) large-scale topography, such as the Himalayas and Rocky Mountains, (3) heat release from warm waters carried by the Gulf Stream and Kuroshio Current, (4) spatially-inhomogeneous distribution of migratory transient disturbances and their interactions with planetary-scale wave-like atmospheric flow field, (5) horizontal gradient of the sea surface temperature in the middle latitudes, and (6) spatially-inhomogeneous large-scale heat release from the ocean in the tropics. Since there are no major anomalies found in the tropics at the moment, factors 1 – 5 are likely to be playing important roles in the cold snap over North America this time.
The westerly flow tends to have a northward component over the North Atlantic Ocean due to the presence of the warm water carried northward by the Gulf Stream and its downstream branches. It also tends to aid the westerly to develop southward component over the eastern North America. The Rockies help this tendency as well. These two factors often contribute to the southward migration of cold air mass over North America. In reality, however, migratory transient disturbances propagating eastward from the North Pacific Ocean do not disappear when they reach North America and contribute to heightened complexity of the dynamical processes around the North Atlantic basin.
It is nonsense to attribute this particular cold snap or similar cold snaps in the 1990's to the global or hemispheric warming of the surface temperature. There is no evidence of enhanced frequency of the occurrence of severe cold snaps over North America during the 1990's and 2000's compared to the cold period in the 1960's and 1970's. Although the argument for a weakened winter upper tropospheric westerly jet and polar vortex in response to the reduced north-south surface temperature differences between the middle latitudes and polar region has some theoretical ground, the argument misses the weakening effect of the reduced north-south surface temperature difference on the migratory transient disturbances that contribute to generating meanders of the jet along the edge of the polar vortex. The reduction in the north-south temperature difference between the middle latitudes and polar region itself, thus, would not necessarily have a significant impact on the southward migration of the cold polar air mass even if the polar vortex had been actually weakened. Furthermore, the strength of the upper tropospheric jet at the edge of the polar vortex depends on the north-south temperature difference integrated throughout the troposphere, rather than the difference at the surface only. Therefore, arguing for a weakened upper tropospheric jet based only on a reduction in the north-south temperature difference at the surface is somewhat simple-minded. In fact, there is no evidence of weakened polar vortex or westerly jet accompanying the surface warming in the northern hemisphere since the 1980's. Ironically, the Time Magazine published in 1974 an article that attributed severely cold winters of the early 1970's to the global cooling, and published in 2014 another article that attributed the present severe winter to the global warming.
Incidentally, the surface temperature of the Greenland Sea that possibly plays an important role in multi-decadal climate variations in the northern hemisphere suddenly dropped between October 2013 and November 2013, exhibiting the lowest anomalies since the winter of 1989.
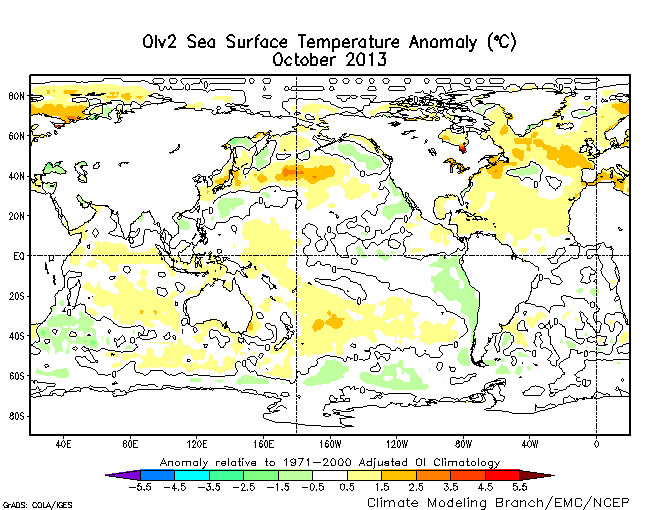
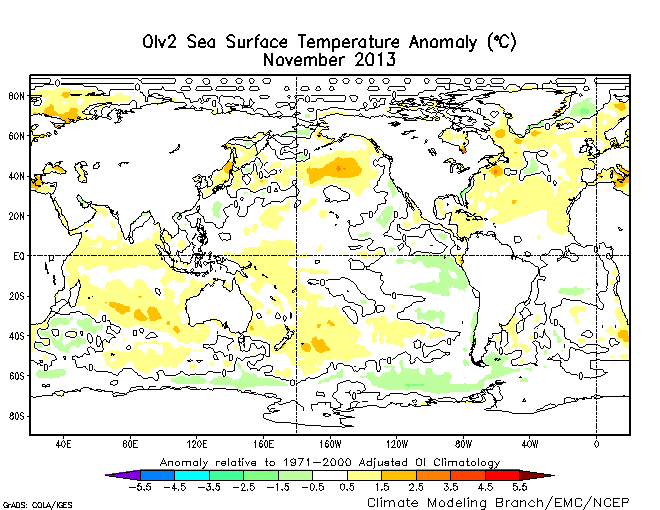
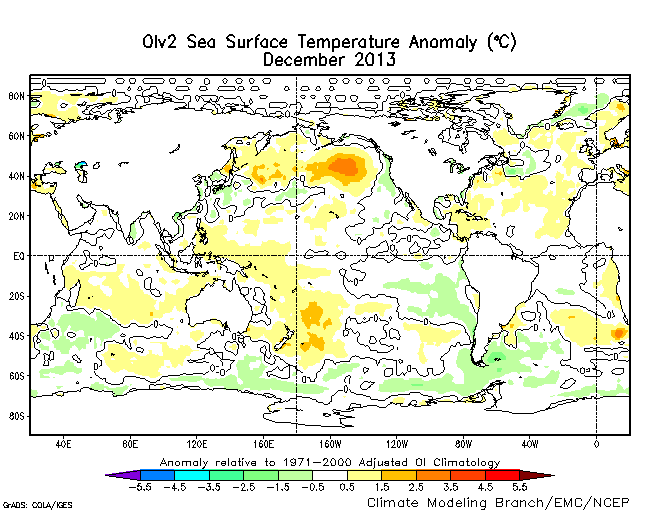
Monthly Sea Surface Temperature Anomaly in Oct, Nov, and Dec 2013 (Click to enlarge)
Courtesy US National Oceanic and Atmospheric Administration.
The Greenland Sea surface temperature dropped by over 2°C in some part, making the temperature colder than normal November by roughly 2°C. The anomalously cold condition in the Greenland Sea continued in December 2013 as well. If this anomalously cold condition persists for a few years, the northern hemispheric climate will probably enter a cold period that lasts roughly 30 years.
June 29, 2013 Press Release
Elucidating Climate Changes and Variations in the Northern Hemisphere
–Sudden Change in the Greenland Sea Surface Temperature and Accompanying Changes in the Northern Hemispheric Climate–
One should note, however, that the drop in the Greenland Sea surface temperature probably has nothing to do with the cold snap that hit North America recently. If this drop in the Greenland Sea surface temperature is to cause the northern hemisphere to cool for an extended period, it will begin with a reduction in the northward and northeastward transport of heat by the atmosphere and ocean, followed by further cooling due the ice-albedo positive feedback (cold condition => increased ice/snow => increased refection of sun light back to space => even colder condition) triggered by the initial cooling caused by the dynamical heat transport reduction.
Mototaka Nakamura
Research Institute for Global Change (RIGC)