Theme A: Prediction and diagnosis of imminent global climate change


| Representative: Masahide Kimoto Vice Director/Professor, AORI, the University of Tokyo |
To take measures against global warming which is progressing due to human carelessness, we need reliable prediction information on the types and probability of climate events that are expected to take place in the future. Under this theme, we are developing a system that can predict climate changes on various timescales, from El Niño over a half year to global warming over 10 years or 100 years, by making more sophisticated climate models which are tools to obtain prediction information and by incorporating atmosphere and ocean observation data into the models. Moreover, we are trying to understand the ongoing climate changes by conducting numerical experiments using this system.
 Is this year's heat wave caused by global warming?
 It is often said that disasters occur when least expected. Even though the frequency may be low, summers with heat waves and winters with heavy snow come inevitably as an indication of the natural climate changes of the earth, and we cannot attribute individual climate events to global warming alone. However, global warming is slowly progressing and changing the frequency of several abnormal or extreme weather phenomena, although it is a slight change. By conducting a large number of elaborate simulations, we can understand the mechanism of climate events and calculate the contribution of global warming.
In Theme A, such research is called" event attribution." By promoting this research, we can widely convey to society the message:" The probability of a heat wave such as that, in 2013, it would have been much lower without global warming. In other words, global warming is increasing the risk of heat waves by x%." At the same time, the research can promote an understanding of the relationship between natural changes and global warming risk.
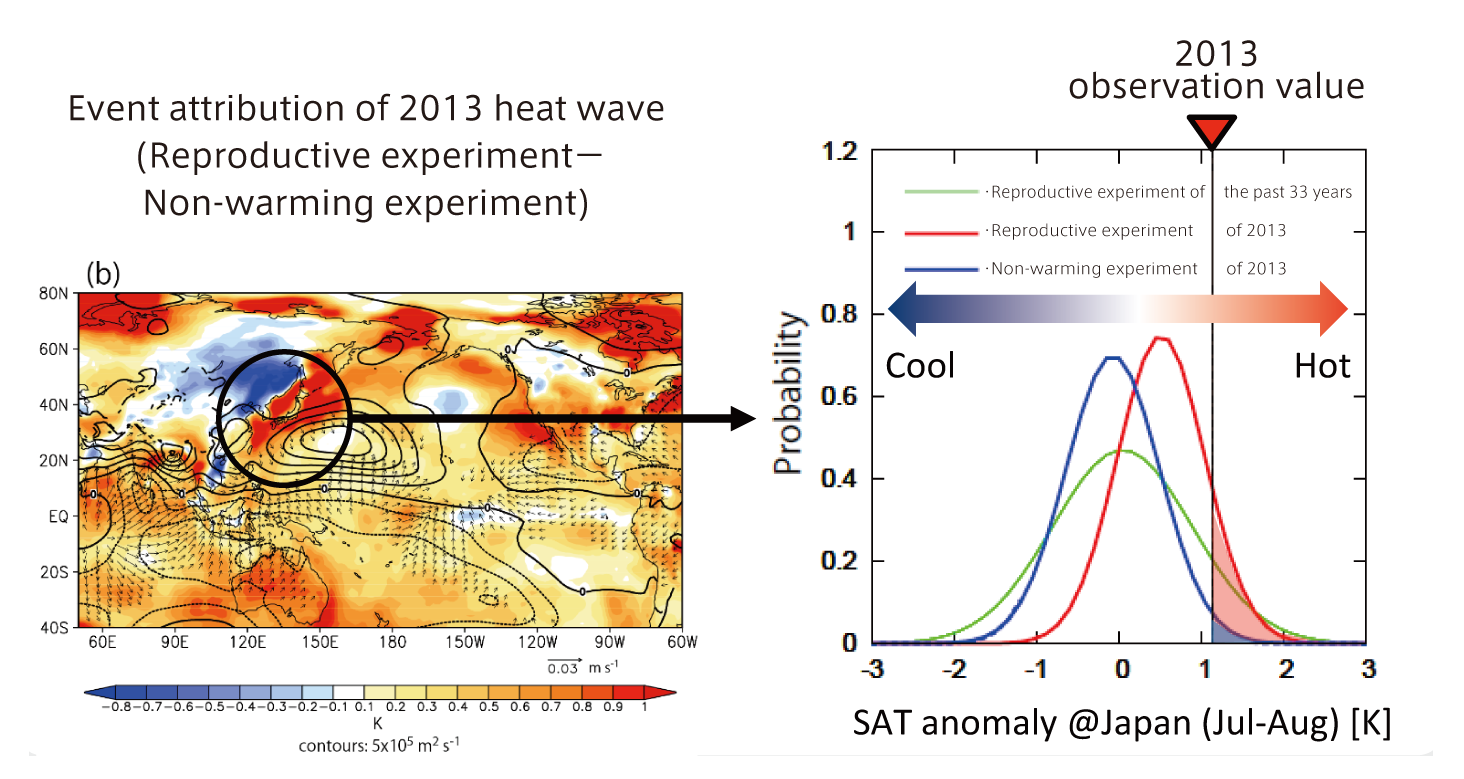
We conducted a reproductive experiment of 100 members with different initial values, giving boundary values (sea surface temperature and sea ice) observed in a global atmosphere model, and an experiment in which warming elements were excluded from the boundary values. We assessed the contribution of warming to the occurrence probability of less frequent abnormal weather, etc., by comparing the probability density distribution (PDF) of meteorological elements obtained from these experiments. The figure on the left shows the differences in the surface air temperature (color), 850 hPa stream function (isogram), and 200 hPa divergent flow (arrow mark) obtained in the reproductive experiment on the heat wave in Japan in 2013 and the non-warming experiment. The figure on the right compares the surface air temperature PDF near Japan obtained in the reproductive experiment (red) and nonwarming experiment (blue). Green shows a climatological PDF of the same variables obtained in a longer term reproductive experiment. The probability of a hot summer compared to that observed in 2013 (shown in the top part of the figure) is only 1.7% in the overall non-warming case. In the actual (warmed) conditions, however, the probability is estimated to be 12.4%, indicating that warming is increasing the risk of heat waves (Imada et al. 2014, Bulletin of the American Meteorological Society).
Has global warming stopped? Not only individual climate events but also the relationship between global warming and climate trends in recent years observed in observation data often attracts the attention of society. The plateau in the elevation of the world's average temperature over 15 years after the recordsetting El Niño in 1998 is known as the global warming "hiatus." It has become a major topic of social and scientific interest. In addition, frequent cold winters in recent years, despite global warming, are often reported by the media. Is global warming actually progressing?
The research on Theme A also tries to provide a scientific answer to this question. With regard to the hiatus, we found that the ocean interior temperature is rising steadily although the surface air temperature stays at the same level. It is believed that the temperature rise has temporarily halted primarily in the sea surface as a result of natural fluctuations of heat transportation inside the ocean. We also found that the impacts of global warming are increasing, rather than decreasing, as a result of an analysis during recent decades. Regarding cold winters, the research demonstrated that a decrease in sea ice in the Arctic Ocean due to global warming is causing a change in a pressure pattern that increases the intensity of the Siberian anticyclone. The research also indicated that it cannot be said that the Northern Hemisphere will experience more cold winters if global warming progresses because the Arctic oscillation, which is another natural fluctuation, makes a larger contribution after the progress of global warming.
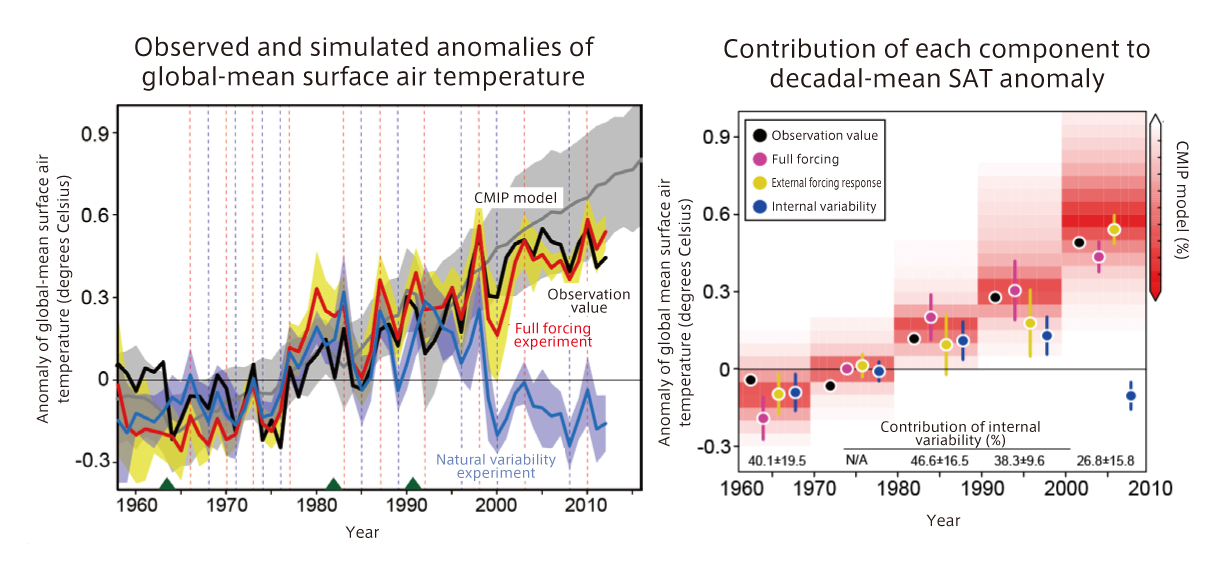
We successfully reproduced the hiatus in global temperature rise since 2000 in a simulation using a global climate model (left). Moreover, we found that natural climate fluctuations contribute to global temperature changes (right) to a non-negligible degree at 47%, 38%, and 27% in each decade from 1980 to 2010, respectively. Such contribution is decreasing as anthropogenic warming becomes prominent. It is suggested that contribution rates will further decrease if global warming progresses in the future (Watanabe et al. 2014, Nature Climate Change; Press release on September 1, 2014).
The new prediction system expands not only future information but also past information.With regard to climate models, we are steadily preparing a new model to be used in the next phase of the Coupled Model Intercomparison Project. We decided to introduce a new method known as the Ensemble Kalman Filter (EnKF) to "data assimilation" to incorporate observation data. This method involves a larger amount of calculation than conventional methods, but it can incorporate atmospheric and oceanographic data simultaneously and makes it possible to handle variables which are technically difficult to incorporate, such as sea ice. In addition, the method increases the accuracy of variables which are different from the incorporated variables. By using this property, it is expected that pre-1950's climate conditions, for which upper-air observation data and ocean interior observation data are very scarce, can be reconstructed, using relatively abundant surface observation data. If" 150 Year Climate Reanalysis" can be realized, abnormal weather samples and extreme climate samples will increase, and the understanding of multidecadal climate changes will improve. Furthermore, attribution and risk assessment of Muroto Typhoon (1934)-class climate events will become possible if combined with a downscale approach, etc. The coverage of a wider range of past phenomena directly leads to the improvement of the reliability of future predictions.

A large ensemble simulation using an atmospheric model revealed that the cold winter probability in mid-latitude regions of the Eurasian continent has more than doubled due to the rapid decrease of sea ice in the Arctic Ocean in recent years. The analytical results of future prediction simulations using climate models around the world suggest that the increase in cold winters in recent years is a transitional phenomenon that temporarily occurs in the warming process. The figure shows space patterns obtained from a principal component analysis of observed surface air temperature anomaly in winter (left: surface air temperature anomaly (color), associated surface atmospheric pressure anomaly (isogram: 1 hPa interval), and surface wind (arrow mark) anomaly) and their time coefficients (right). The first principal component (panel a) represents the Arctic Oscillation and the second principal component (panel b) indicates a pattern linked to interannual changes in sea ice anomaly (time series in green), which is the average of the Barents Sea and the Kara Sea (Fig. (c)) (Mori et al. 2014, Nature Geoscience; Press release on October 27, 2014).
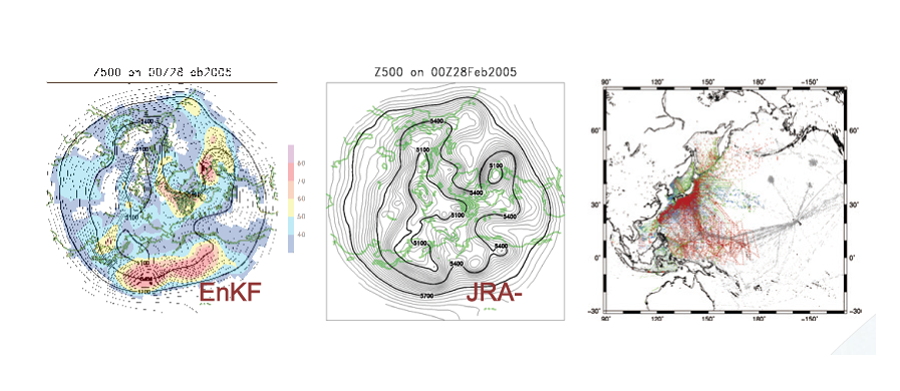
The figure shows a comparison between a 500 hPa (approx. 5 km) height field in the air reproduced only from surface atmospheric pressure data using a new data assimilation method (EnKF) (left) and the analytical value provided by the Japan Meteorological Agency (center). The shade in the left figure indicates a yardstick of errors based on the ensemble method. The figure on the right shows the distribution of upper ocean temperature data before World War II. The colored part shows data provided by Japanese institutions. We are also working to digitize climate observation data collected by the former Imperial Japanese Navy.
