Theme C: Development of basic technology for risk information on climate change


| Representative: Izuru Takayabu Director, Atmospheric Environment and Meteorology Research Department, Meteorological Research Institute (MRI) |
The aim of this research theme is to describe "possible future scenarios" which include probability information on climate change and weather phenomena in areas surrounding Japan by
developing methods for statistical analysis and assessment. There are two types of basic information to be used for considering risks associated with global warming: one is probability information for the likely scenarios, while the other is scenarios of the strongest possible class of weather phenomena. The former is necessary for disaster prevention, the latter for disaster mitigation.
 How warm will Tokyo be at the end of the 21st century?
 In this research, we developed a method to estimate climate change probability information and applied the method to the monthly mean temperature of Tokyo. Figure 1 shows how warm Tokyo will be at the end of this century. We used 21 model simulations based on the SRES A1B* greenhouse gas emission scenario. The figure indicates an
increasing trend in the temperature and its uncertainty.
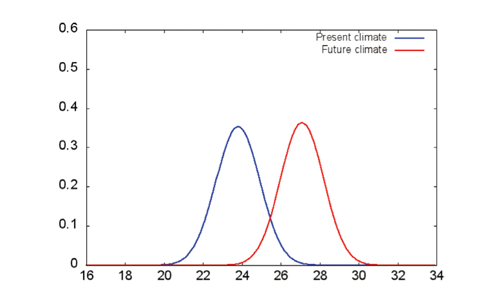
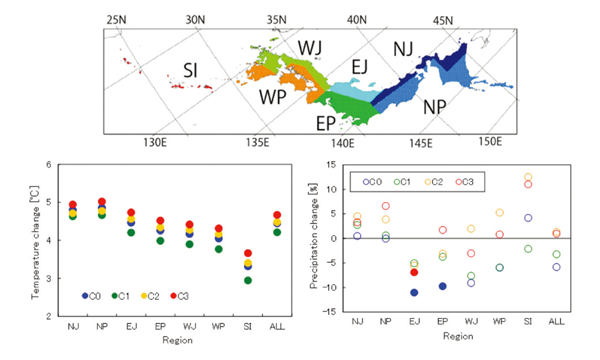
Figure 2 shows the results obtained from a high-resolution model applied in this program. We extracted four representative patterns in sea surface temperature rise predicted by 28 global models based on the RCP8.5 scenario** and performed dynamical downscaling simulation by using each extracted pattern. The dynamical downscaling was accomplished by driving a 5-km grid regional climate model using the boundary
coming from a 20-km equivalent grid global atmospheric model. The variations in temperature and precipitation are shown in each area, and the temperature rise is larger in northern Japan. It is considered that the temperature rise reflects a reduction of the drift ice area in the Okhotsk Sea set as a boundary condition. The uncertainty of the precipitation changes is very large, thus the trends are not significant.
* A scenario of future greenhouse gas emissions assuming significant technological innovation for oil, natural gas, and new energy.
** One of the future climate change scenarios that predict changes in greenhouse gas concentrations. Among the four patterns of the RCP8.5, 6.0, 4.5, and 2.6 scenarios, the RCP8.5 scenario shows the most remarkable progress of global warming.
 Does global warming induce extreme weather events?
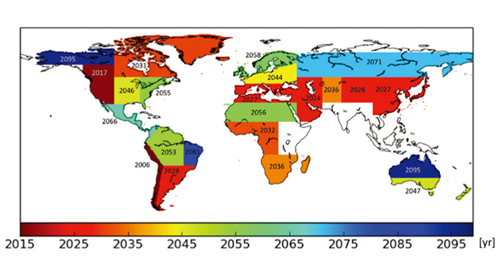
It is pointed out that extreme weather events increase with global warming. Figure 3 shows the result that comes from simulations in the water-resource management model following the atmospheric state until 2100 (projected by five global climate models based on RCP8.5). It shows the years in which the number of drought days assessed by the model is expected to increase to an unprecedented level and never decrease to the previous level. According to the analysis, such years are approaching in Chile and the western part of North America. These results were obtained in collaboration with Theme D.
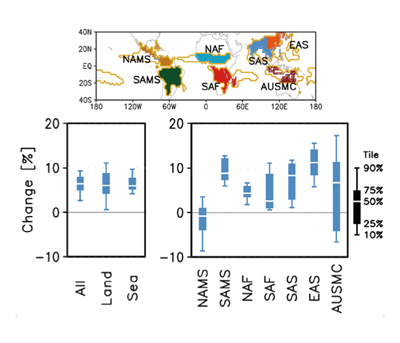
Next, how will the precipitation in monsoon regions change with global warming? Figure 4 shows projected future precipitation in each monsoon region evaluated in 24 ensemble experiments (SRES A1B scenario) using a global atmospheric model with 60-km equivalent resolution. Precipitation tends to increase on the whole. In East Asia including Japan inparticular, an increase in rainy season precipitation is indicated at a high probability.
 Predicting strong typhoons and leading for disaster prevention and disaster mitigation
 We need a probability typhoon approach to develop
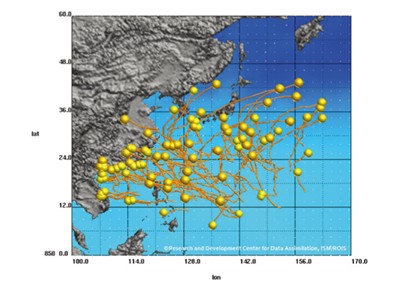
policies to mitigate the risks of disasters caused by typhoons because only two or three typhoons make landfall in Japan every year. Figure 5 shows typhoon paths simulated from
observation data as part of the development of a typhoon model. This enables us to simulate a sufficient number of pseudo-events involving typhoons for analysis.
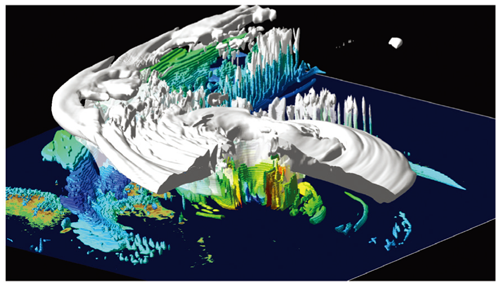
On the other hand, calculations based on a precise model are needed in order to develop the strongest-class typhoon scenario for disaster mitigation. Figure 6 shows the
cloud and precipitation distribution of the Isewan Typhoon (Typhoon Vera), which is the strongest typhoon that hit Japan in the past. The figure was reproduced by typhoon model CReSS with 2-km horizontal resolution. Highaccuracy calculations using such a highresolutionmodel are required to reproduce and analyze the structure and extent of a super typhoon.
 Developing an outlook for the uncertain future
 An extreme weather event occurs only rarely, about "once in 20 to 50 years." However, when it does occur, many people's lives are endangered, and significant social and economic damage and confusion ensue. In addition, we cannot devise measures against global warming and other climate changes without knowing the "probability of occurrence and state." Our research results will be useful when devising countermeasures against future global warming, disasters, etc., for the government and municipalities.