In the scientific drilling that is carried out on the CHIKYU, core samples are retrieved and valuable data are obtained through Logging While Drilling (LWD). This LWD is a technology where a variety of physical properties data is measured near the drill bit at the bottom of the drill string and transmitted the data to the surface in real time. How is this information collected deep inside the earth and sent to the ship, which is a long distance away?
| Interviewee: Yoshinori Sanada Logging Staff Scientists, CDEX |
Simultaneous drilling and measuring at the tip of the drill
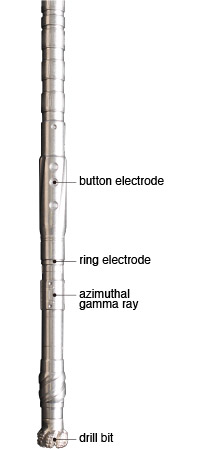
We probably have all seen for ourselves geological strata that stretch away horizontally, creating various patterns, at for instance cliffs or construction sites. Logging While Drilling (LWD) is a technique where the physical properties related to these strata are continuingly measured at the same time that drilling takes place. Logging Staff Scientist Yoshinori Sanada of the Center for Deep Earth Exploration (CDEX), explains the features of LWD by likening it to a medical examination. “The technique to directly retrieve samples such as geological strata sample cores can be compared to surgical techniques. Geophysical prospecting methods like LWD on the other hand use an indirect approach, like for instance CT scans or endoscopes.” So what kind of device is this? For the LWD performed at the CHIKYU a measuring tool of about 3-30m long is fitted to the top of the drill bit that sits at the end of the drill pipe. The measuring tool consists of various sensors,processor, memory, a battery, generator, etc. It is through these sensors that a variety of physical property data is continuingly obtained. The main data that are measured include borehole images, natural gamma rays, electrical resistivity, photoelectric factor (PEF), porosity, density, acoustic wave velocity. During IODP Expedition 348, crew members succeeded in collecting data over 2,199 m, from 860 m below the seafloor to a world record depth of 3,058.5 m.
Continuous data accumulation for every 1 cm over 2,199 m
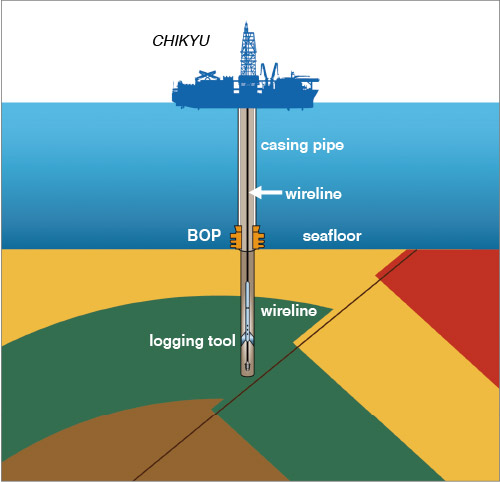
Measuring instruments are lowered into the borehole to continuingly measure physical quantities at great depths.
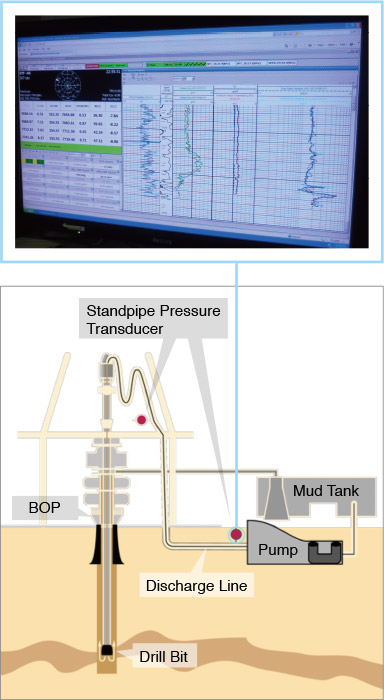
Mud Pulse Telemetry
Borehole images for instance visualize the geological strata that are manifest in the wall of the hole that has been drilled. Changes in electrical resistivity are measured by rotating electrode sensors over 360 degrees and data are continuingly acquired in a spiral form. To make it easier to understand, think of it as a mechanism that is virtually the same as an image scan on a PC.
Rendering this as a color image results in images like photograph . Be amazed at the expressive image of the borehole wall, just as the strata you see in cliff faces. Through analyzing these images the stratum structure such as inclination, faults and fissures can be detected, and by matching them to other measuring data the lithological clasification and the nature of the facies and particle composition can be estimated, as well as physical properties such as the compaction, cementation and flow characteristics.
In this expedition the resolution of the borehole images about 3 times higher compared to before was used, and visualization was achieved in units of approx. 1 cm. As these data were continuingly accumulated over 2,199 m, it truly brings home the sheer power of LWD.
“The greatest strength of LWD is that live data can be obtained in this way, in real time, during drilling. Sample cores on the other hand have the advantage of enabling direct, high-precision analysis in laboratory. By putting together recovered core samples, data from physical logging including LWD as well as information from geophysical prospecting using methods such as the reflection method, a higher level of exploration becomes possible." (Sanada)
- |1|
- 2|
