| Application Laboratory JAMSTEC 2019.09.02 |
Distribution of JCOPE2M reanalysis data
By assimilating available observation data into the JCOPE2M ocean nowcast/forecast system, Application Laboratory has created the reanalysis data (JCOPE2M) with horizontal high resolution of 1/12 deg. to describe the oceanic variability associated with the Kuroshio-Kuroshio Extension, the Oyashio, and the mesoscale eddies from January 1993 to present time (Miyazawa et al., 2017; 2019). JCOPE2M reanalysis data are available from the authors by request.
JCOPE2M is an updated version of JCOPE2 reanalysis. The high-resolution sea surface temperature data were assimilated into the model by using the multi-scale three dimensional variational method. Salinity representation at the surface was improved by including river discharge, precipitation, and evaporation effects.
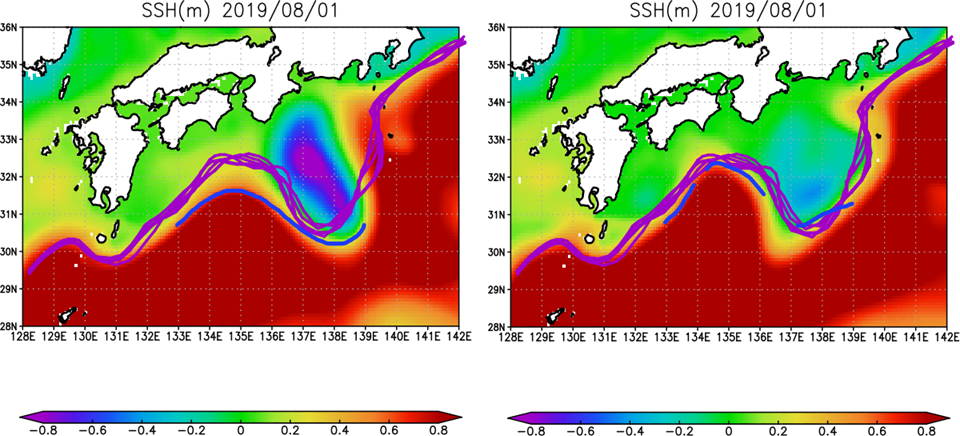
Sea surface height distribution south of Japan 2019/8/1. Blue curves denote the modeled Kuroshio axis, and purple curves denote the weekly mean Kuroshio axis estimates including the target day reported by Japan Coastal Guard. Left:JCOPE2, Right:JCOPE2M
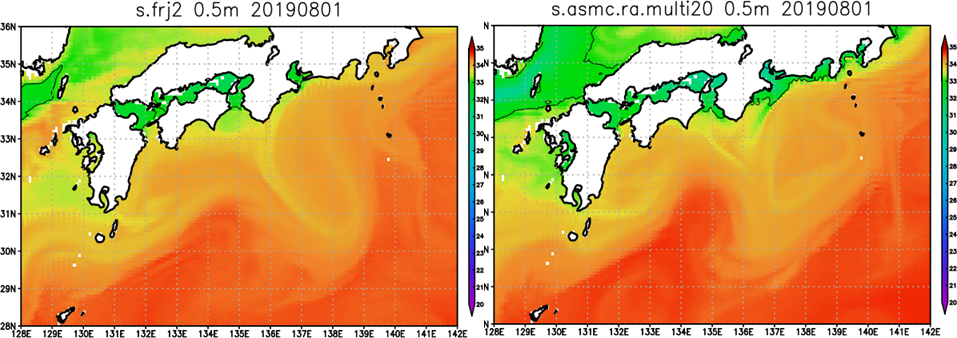
Sea surface salinity distribution south of Japan 2019/8/1. Left:JCOPE2, Right:JCOPE2M
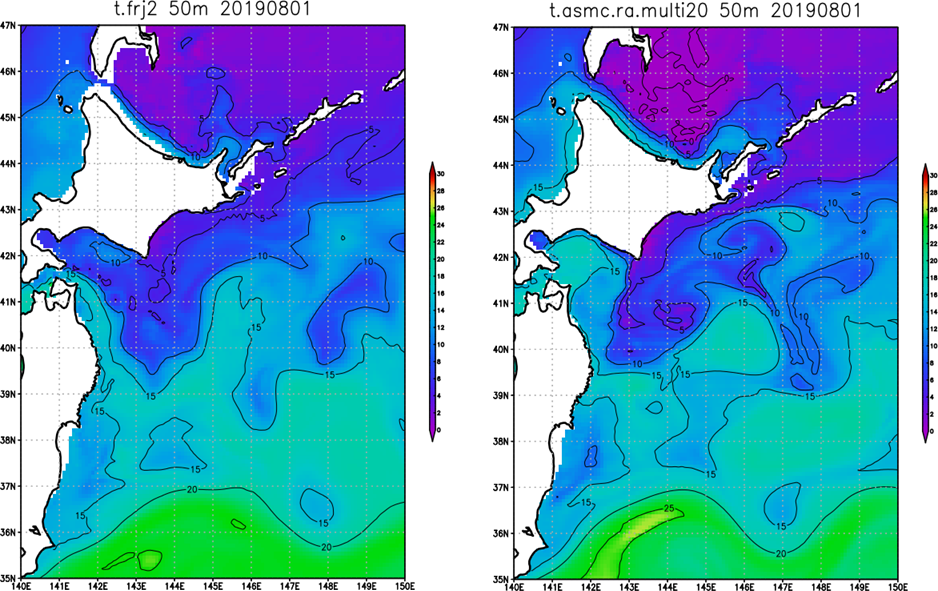
Subsurface temperature distribution at 50m depth 2019/8/1. Left:JCOPE2, Right:JCOPE2M
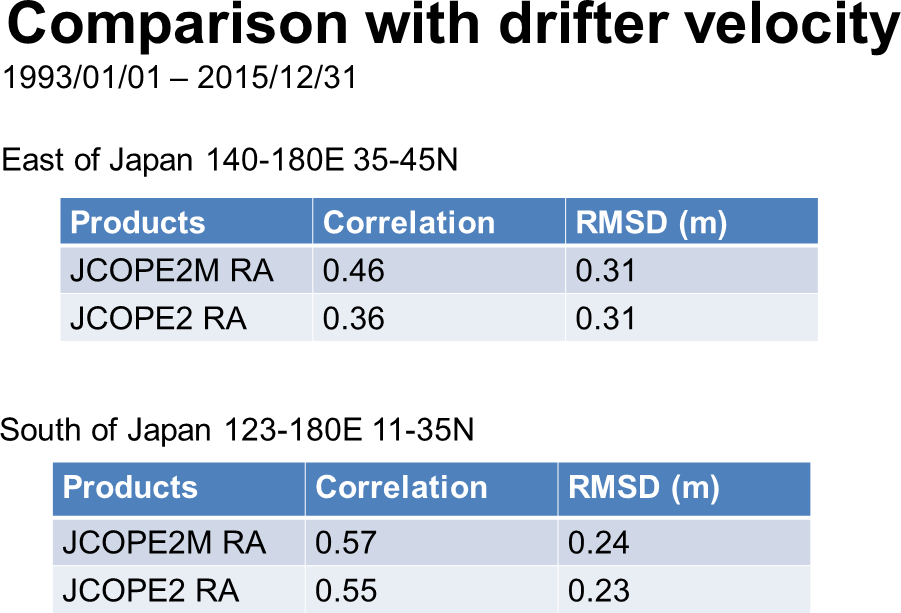
Comparison with drifter velocity data
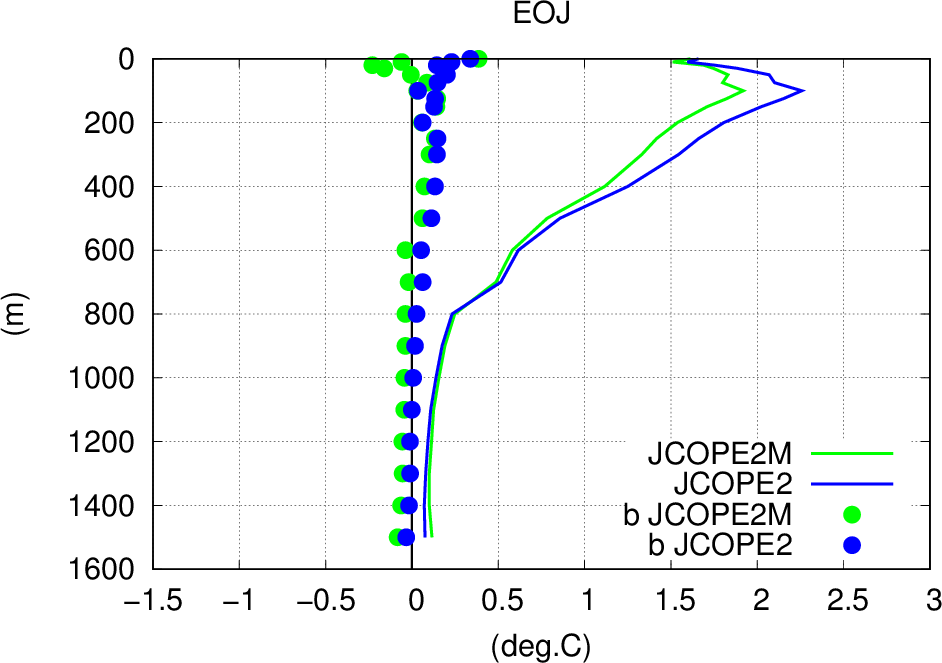
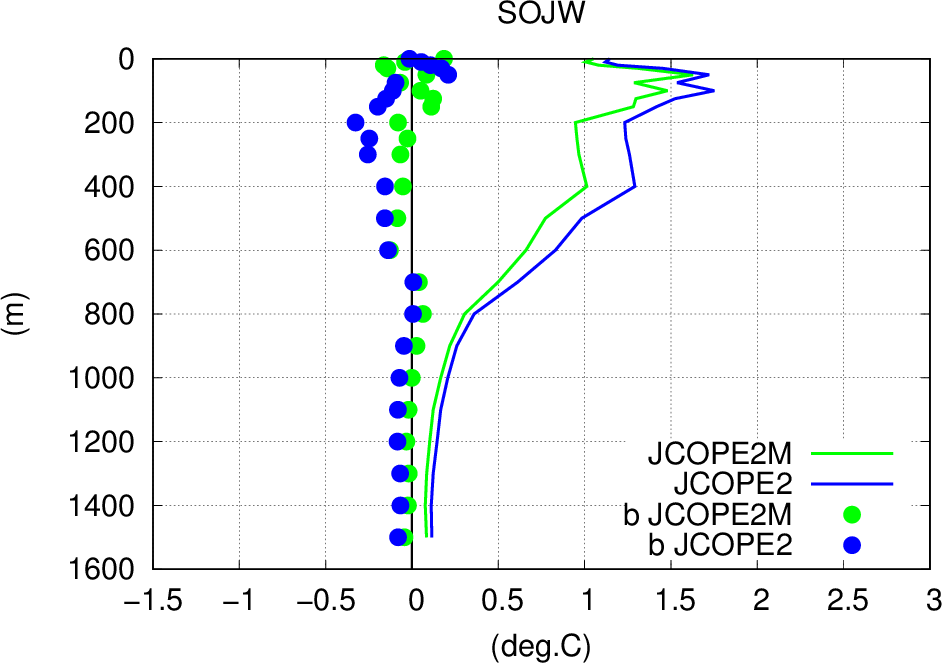
Comparison with in-situ temperature data used for data assimilation. Thick curves (dots) denote root mean square difference (mean difference). Left: 20N-35N, 125E-180E. Right: 35N-43N, 140E-180E.
How to download JCOPE2M reanalysis data
Application Laboratory freely distributes JCOPE2M reanalysis data to any interested persons. If you accept following conditions of data use, please send us an E-mail describing your order: time range (maximum period: 1993.01.01-present; 2TB+), spatial range (maximum range:10.5-62N, 108-180E), variables (sea surface height, north-south velocity, east-west velocity, potential temperature, salinity, heat flux at sea surface). We provide URL of your https site for downloading your data (Fortran binary or NetCDF ) with a README document.
Contact:jcope at_mark jamstec.go.jp
Principal conditions of data use
- The user is permitted to use the data for the purpose of scientific research.
- The user is not allowed to copy or reproduce the data in any form for the purposes of distribution, (whether for remuneration or otherwise), sale, hire, lease or license or otherwise commercialise the data.
- The user is recommended to include our paper (Miyazawa et al., 2009) in the reference of any documents describing results obtained from analyses/visualizations of the data.
Miyazawa, Y., A. Kuwano-Yoshida, T. Doi, H. Nishikawa, T. Narazaki, T. Fukuoka, and K. Sato, 2019: Temperature profiling measurements by sea turtles improve ocean state estimation in the Kuroshio-Oyashio Confluence region, Ocean Dynamics, 69, 267-282. html
Miyazawa, Y., S. M. Varlamov, T. Miyama, X. Guo, T. Hihara, K. Kiyomatsu, M. Kachi, Y. Kurihara, and H. Murakami, 2017: Assimilation of high-resolution sea surface temperature data into an operational nowcast/forecast system around Japan using a multi-scale three dimensional variational scheme, Ocean Dynamics, 67, 713-728. html
Disclaimer
Although every effort has been made to ensure the correctness and accuracy of the information the data, Application Laboratory makes no representations, either express or implied, as to the accuracy, currency, completeness or suitability for any particular purpose of the information and accepts no liability for any use of the data or any responsibility for any reliance placed on that information. Application Laboratory acknowledges that the data cannot be guaranteed error free and that use of the data is at the user's sole risk and that the information contained in the data may be subject to change without notice. Personal information collected for the purpose of distributing the data will not be used for any purpose other than the distribution of the data.