| Sun | Mon | Tue | Wed | Thu | Fri | Sat |
|---|---|---|---|---|---|---|
| 1 | 2 | 3 | 4 | 5 | 6 | |
| 7 | 8 | 9 | 10 | 11 | 12 | 13 |
| 14 | 15 | 16 | 17 | 18 | 19 | 20 |
| 21 | 22 | 23 | 24 | 25 | 26 | 27 |
| 28 | 29 | 30 | 31 |
| Sun | Mon | Tue | Wed | Thu | Fri | Sat |
|---|---|---|---|---|---|---|
| 1 | 2 | 3 | 4 | 5 | ||
| 6 | 7 | 8 | 9 | 10 | 11 | 12 |
| 13 | 14 | 15 | 16 | 17 | 18 | 19 |
| 20 | 21 | 22 | 23 | 24 | 25 | 26 |
| 27 | 28 | 29 | 30 |
| Sun | Mon | Tue | Wed | Thu | Fri | Sat |
|---|---|---|---|---|---|---|
| 1 | 2 | 3 | ||||
| 4 | 5 | 6 | 7 | 8 | 9 | 10 |
| 11 | 12 | 13 | 14 | 15 | 16 | 17 |
| 18 | 19 | 20 | 21 | 22 | 23 | 24 |
| 25 | 26 | 27 | 28 | 29 | 30 | 31 |
| Sun | Mon | Tue | Wed | Thu | Fri | Sat |
|---|---|---|---|---|---|---|
| 1 | 2 | 3 | 4 | 5 | 6 | 7 |
| 8 | 9 | 10 | 11 | 12 | 13 | 14 |
| 15 | 16 | 17 | 18 | 19 | 20 | 21 |
| 22 | 23 | 24 | 25 | 26 | 27 | 28 |
| 29 | 30 | 31 |
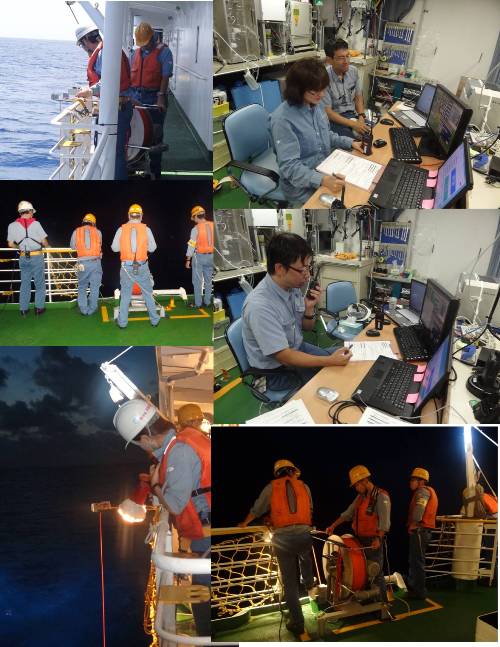
20 Oct. 2011: Mirai
Intensive cast of microstructure profiler
Southeasterly still prevailed, but its speed decreased to 5m/s. Wave height became less than 2m, so it is now relatively calm condition comparing to the past weeks. While dry condition continued, total precipitable water vapor gradually increased to 40mm.
Today, we've been conducting intensive observation of ocean surface structure using a profiler called TurboMAP (which measures current shear with 512 Hz). Usually, our 3-hourly routine observation consists of radiosonde launch, CTD with LADCP (and water sampling for 6-hourly) down to 500m, microstructure profiler down to 300m (2 times/each), and steaming upwind to obtain precise atmospheric turbulent data (about 1 hour). Today, however, we cancel to steam against wind. Instead, we conduct microstructure profiler cast 6-7 times every 3 hours.