Honda MC, Sasai Y, Siswanto E, Kuwano-Yoshida A, Cronin MF (2017) Study of missing nutrients source in the oligotrophic ocean based on time-series biogeochemical/physical/meteorological observation at station KEO. ESSAS2017 meeting poster presentation.
https://www.jamstec.go.jp/res/ress/hondam/pdf/ESSAS2017.pdf
KEO biogeochemical project
1. Background
The KEO project is cooperative research between JAMSTEC and National Oceanic and Atmospheric Administration (NOAA). Before 2013, “JKEO project” was conducted and this project had deployed surface buoy in the north Pacific and provided atmospheric and oceanic data to OceanSITES (http://www.jamstec.go.jp/iorgc/ocorp/ktsfg/data/jkeo/index.html) . After 2014, the JAMSTEC biogeochemical study started at NOAA KEO buoy station and time-series sediment trap experiment has been conducted in order to study the missing nutrients source to the oligotrophic subtropical region.
2. Objectives
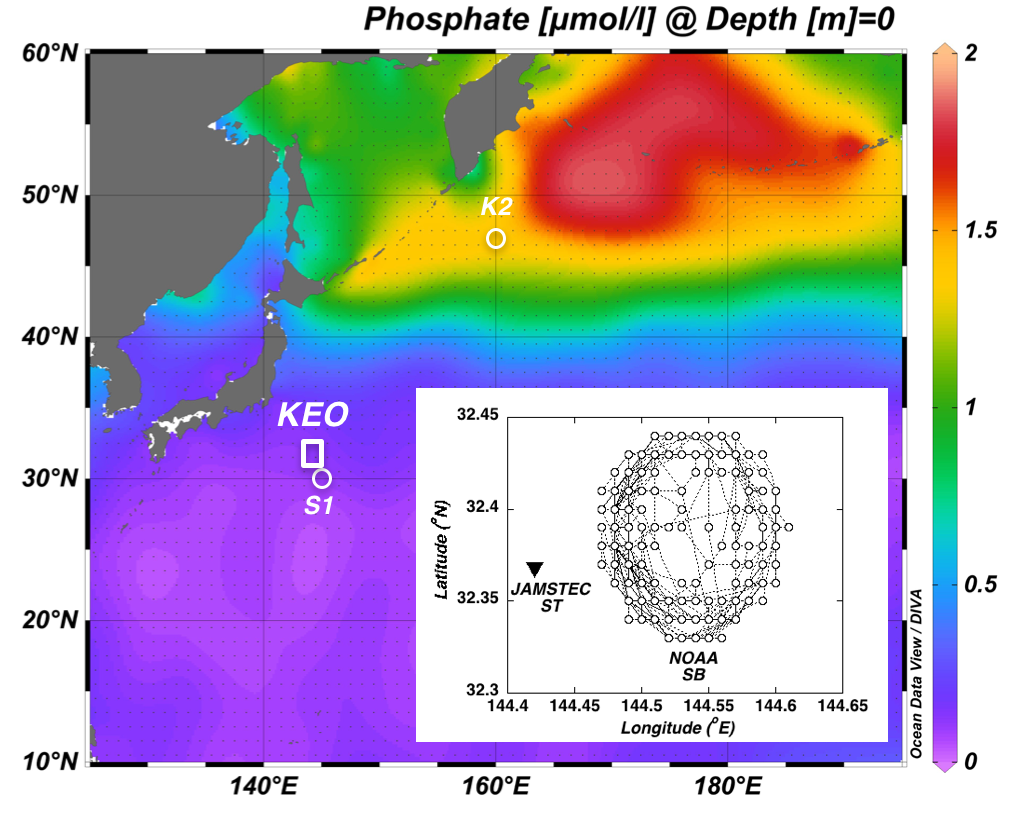
To collect essential baseline data about the ecosystem and its role in the biological pump, and to facilitate predictions of how these material cycles via biological activity may change, a comparative study of the ecosystem and its biogeochemistry was conducted at time-series stations set in the western Pacific eutrophic subarctic gyre (station K2: Fig. 1) and oligotrophic subtropics (station S1: Fig. 1) during 2010 - 2014. One of the scientific highlights of the K2 and S1 time-series study (K2S1 project: see Special issue of Journal of Oceanography vol. 72, no. 3, 2016; Honda et al. 2017, Journal of Oceanography, database URL: https://www.jamstec.go.jp/k2s1/en/) was that annual mean of phytoplankton biomass and primary productivity at the oligotrophic station S1 were comparable to that at the eutrophic station K2. Based on chemical/physical observations and numerical simulations, several likely “missing nutrient sources” at the oligotrophic station were suggested, including regeneration, meso-scale eddy driven upwelling, meteorological events, and eolian inputs in addition to winter cooling mixing.
In order to study nutrient supply mechanisms that support ocean productivity in the western North Pacific subtropical oligotrophic region, since July 2014, a deep-sea (~5000 m) sediment trap mooring has been maintained at station KEO, adjacent to the National Oceanic and Atmospheric Administration (NOAA) surface mooring. The KEO surface mooring has made meteorological and physical oceanographic observations since 2004 and surface carbon measurements since 2008.
3. Methods
3.1 Station KEO
The KEO time-series station in the western Pacific subtropical gyre was established in 2004 by Pacific Marine Environmental Laboratory (PMEL) of NOAA with the deployment of a surface mooring. The primary purpose of the surface mooring is to measure air-sea heat fluxes. Due to the cold, dry air of continental origin blowing over the warm Kuroshio Extension current, surface heat fluxes out of the ocean in this region are some of the largest found in the basin, a feature that is typical of western boundary current extension (WBCE) regions. As is also characteristic of WBCE regions, mesoscale eddies are very energetic near KEO. During the warm season, tropical cyclones routinely pass near KEO as they transition to extra-tropical storms. In addition, the inter-annual variability in meander of the Kuroshio extension, recirculation gyre and Subtropical Mode Water ventilation can affect physical and biogeochemical oceanography of station KEO.
Based on climatological data from National Institute for Environmental Study (NIES)-SOOP database (http://soop.jp), World Ocean Atlas (http://www.nodc.noaa.gov/OC5/WOA09/pr_woa09.html) and observed data (Japan Agency for Marine-Earth Science and Technology (JAMSTEC) K2S1 database (https://www.jamstec.go.jp/k2s1/en/), concentration of nutrients are quite low in the KEO region compared to the subarctic (Fig.1) and thus this area can be categorized as oligotrophic. Moreover, this area has been recently paid more attention to as “carbon hot spot” (e.g. https://usclivar.org/meetings/ocean-carbon-hot-spots-workshop).
3.2 KEO buoy data
The KEO NOAA surface mooring (sinker position for 2014-2016: 32°23’N/144°32’E Fig.1), has been equipped with various physical and meteorology sensors since 2004 and a suite of carbon sensors since 2007. On the upper 550 m of the mooring line, multiple CTD and several current meters are installed. Data and details of the NOAA surface buoy mooring are available at http://www.pmel.noaa.gov/ocs/data/display-delivery/disdel/index.html. Although drifting buoy, Argo float, and satellite have been used for time-series analyses, drifter and float data are not Eulerian observations and satellite can observe only sea surface condition. In contrast, this NOAA moored surface buoy provides not only high-resolution time-series of surface ocean data, but also underwater physical oceanographic data such as upper ocean vertical profile time-series of temperature and density.
3.3 JAMSTEC Sediment trap experiment and sample chemical analysis
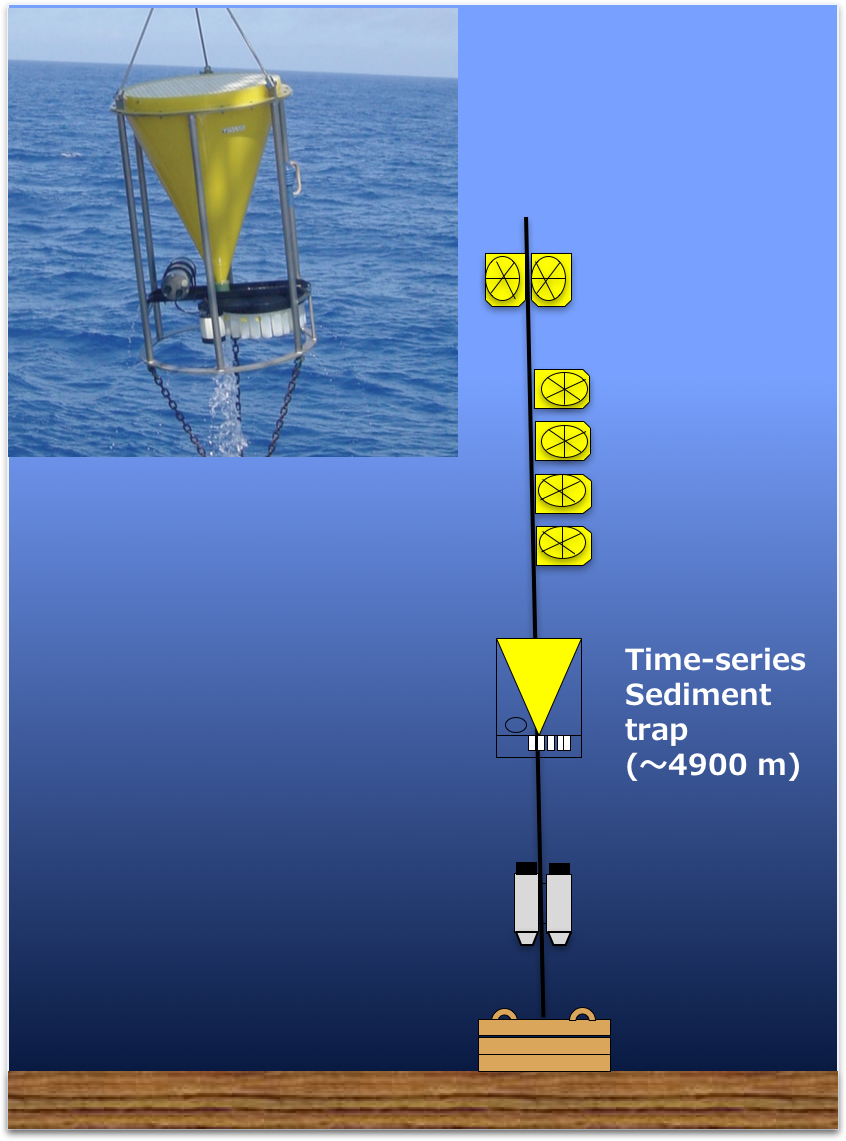
The sediment trap experiment at KEO was initiated in July 2014 adjacent to the NOAA surface buoy in order to utilize meteorological and physical oceanographic information to interpret seasonal variability in sediment trap data. Time-series sediment trap (McLane Mark VII-21: Fig. 2) with 21 collecting cups has been deployed at about 5000 m (800 m above seafloor) about 10 km westward (6 nautical mile) from the NOAA-PMEL KEO buoy (32°22’N / 144°25’E). Sampling interval (sampling period per one collecting cup) is essentially 18 days. Before deployment, collecting cups are filled with seawater-based buffered 10 % formalin solution. After recovery of the sediment traps, samples are stored in a refrigerator (4°C) until chemical and biological analysis at a shore-based laboratory.
After pre-treatment (swimmer elimination, splitting, filtration, drying, weighing for total mass flux, and pulverization) at a shore-based laboratory, the major components of the sinking particles are measured. Concentrations of organic carbon, inorganic carbon and nitrogen are measured with an elemental analyzer (Perkin-Elmer 2400 CHN/O, USA). Concentrations of Al, Si, Ca and other trace elements such as Fe and Ti are measured with an inductively coupled plasma emission spectrometer (Perkin-Elmer Optima 3300DV, USA). Concentrations of biogenic opal (Opal: SiO2・0.4H2O) and CaCO3 are estimated with following equations:
Opal (%) = (Si – 3.42Al) × 67.2 / 28 (1)
CaCO3 (%) = (Ca – 0.5Al) × 100 / 40 (2)
where coefficients are based on crustal ratio.
Reference
Ikenoue, T., R. Nakajima, S. Osafune, E. Siswanto, and M. C. Honda (2024) Vertical flux of microplastics in the deep subtropical Pacific ocean: moored sediment trap observations within the Kuroshio extension recirculation gyre. Environmental Science and Technology. https://doi.org/10.1021/acs.est.4c02212
4. KEO time-series sediment trap data
This is JAMSTEC KEO Sediment Trap data (32°22’N / 144°25’E, water depth: ~ 5900 m). Data are served as “.xlsx” format and netCDF format (“.nc”) following OceanSITES protocol.
Data files
Contact

Earth Surface System Research Center
Environmental Geochemical Cycle Research Group
Principal Research Scientist
Address
Japan Agency for Marine-Earth Science and Technology (JAMSTEC)
Research and Development Center for Global Change
2-15 Natsushima, Yokosuka, 237-0061, Japan
TEL:+81-46-867-9502
FAX:+81-46-867-9455