Monitoring atmospheric properties after the Hunga Tonga–Hunga Haʻapai eruption in multiple reanalysis datasets
Air temperature
[latex] \overline{T}[/latex]
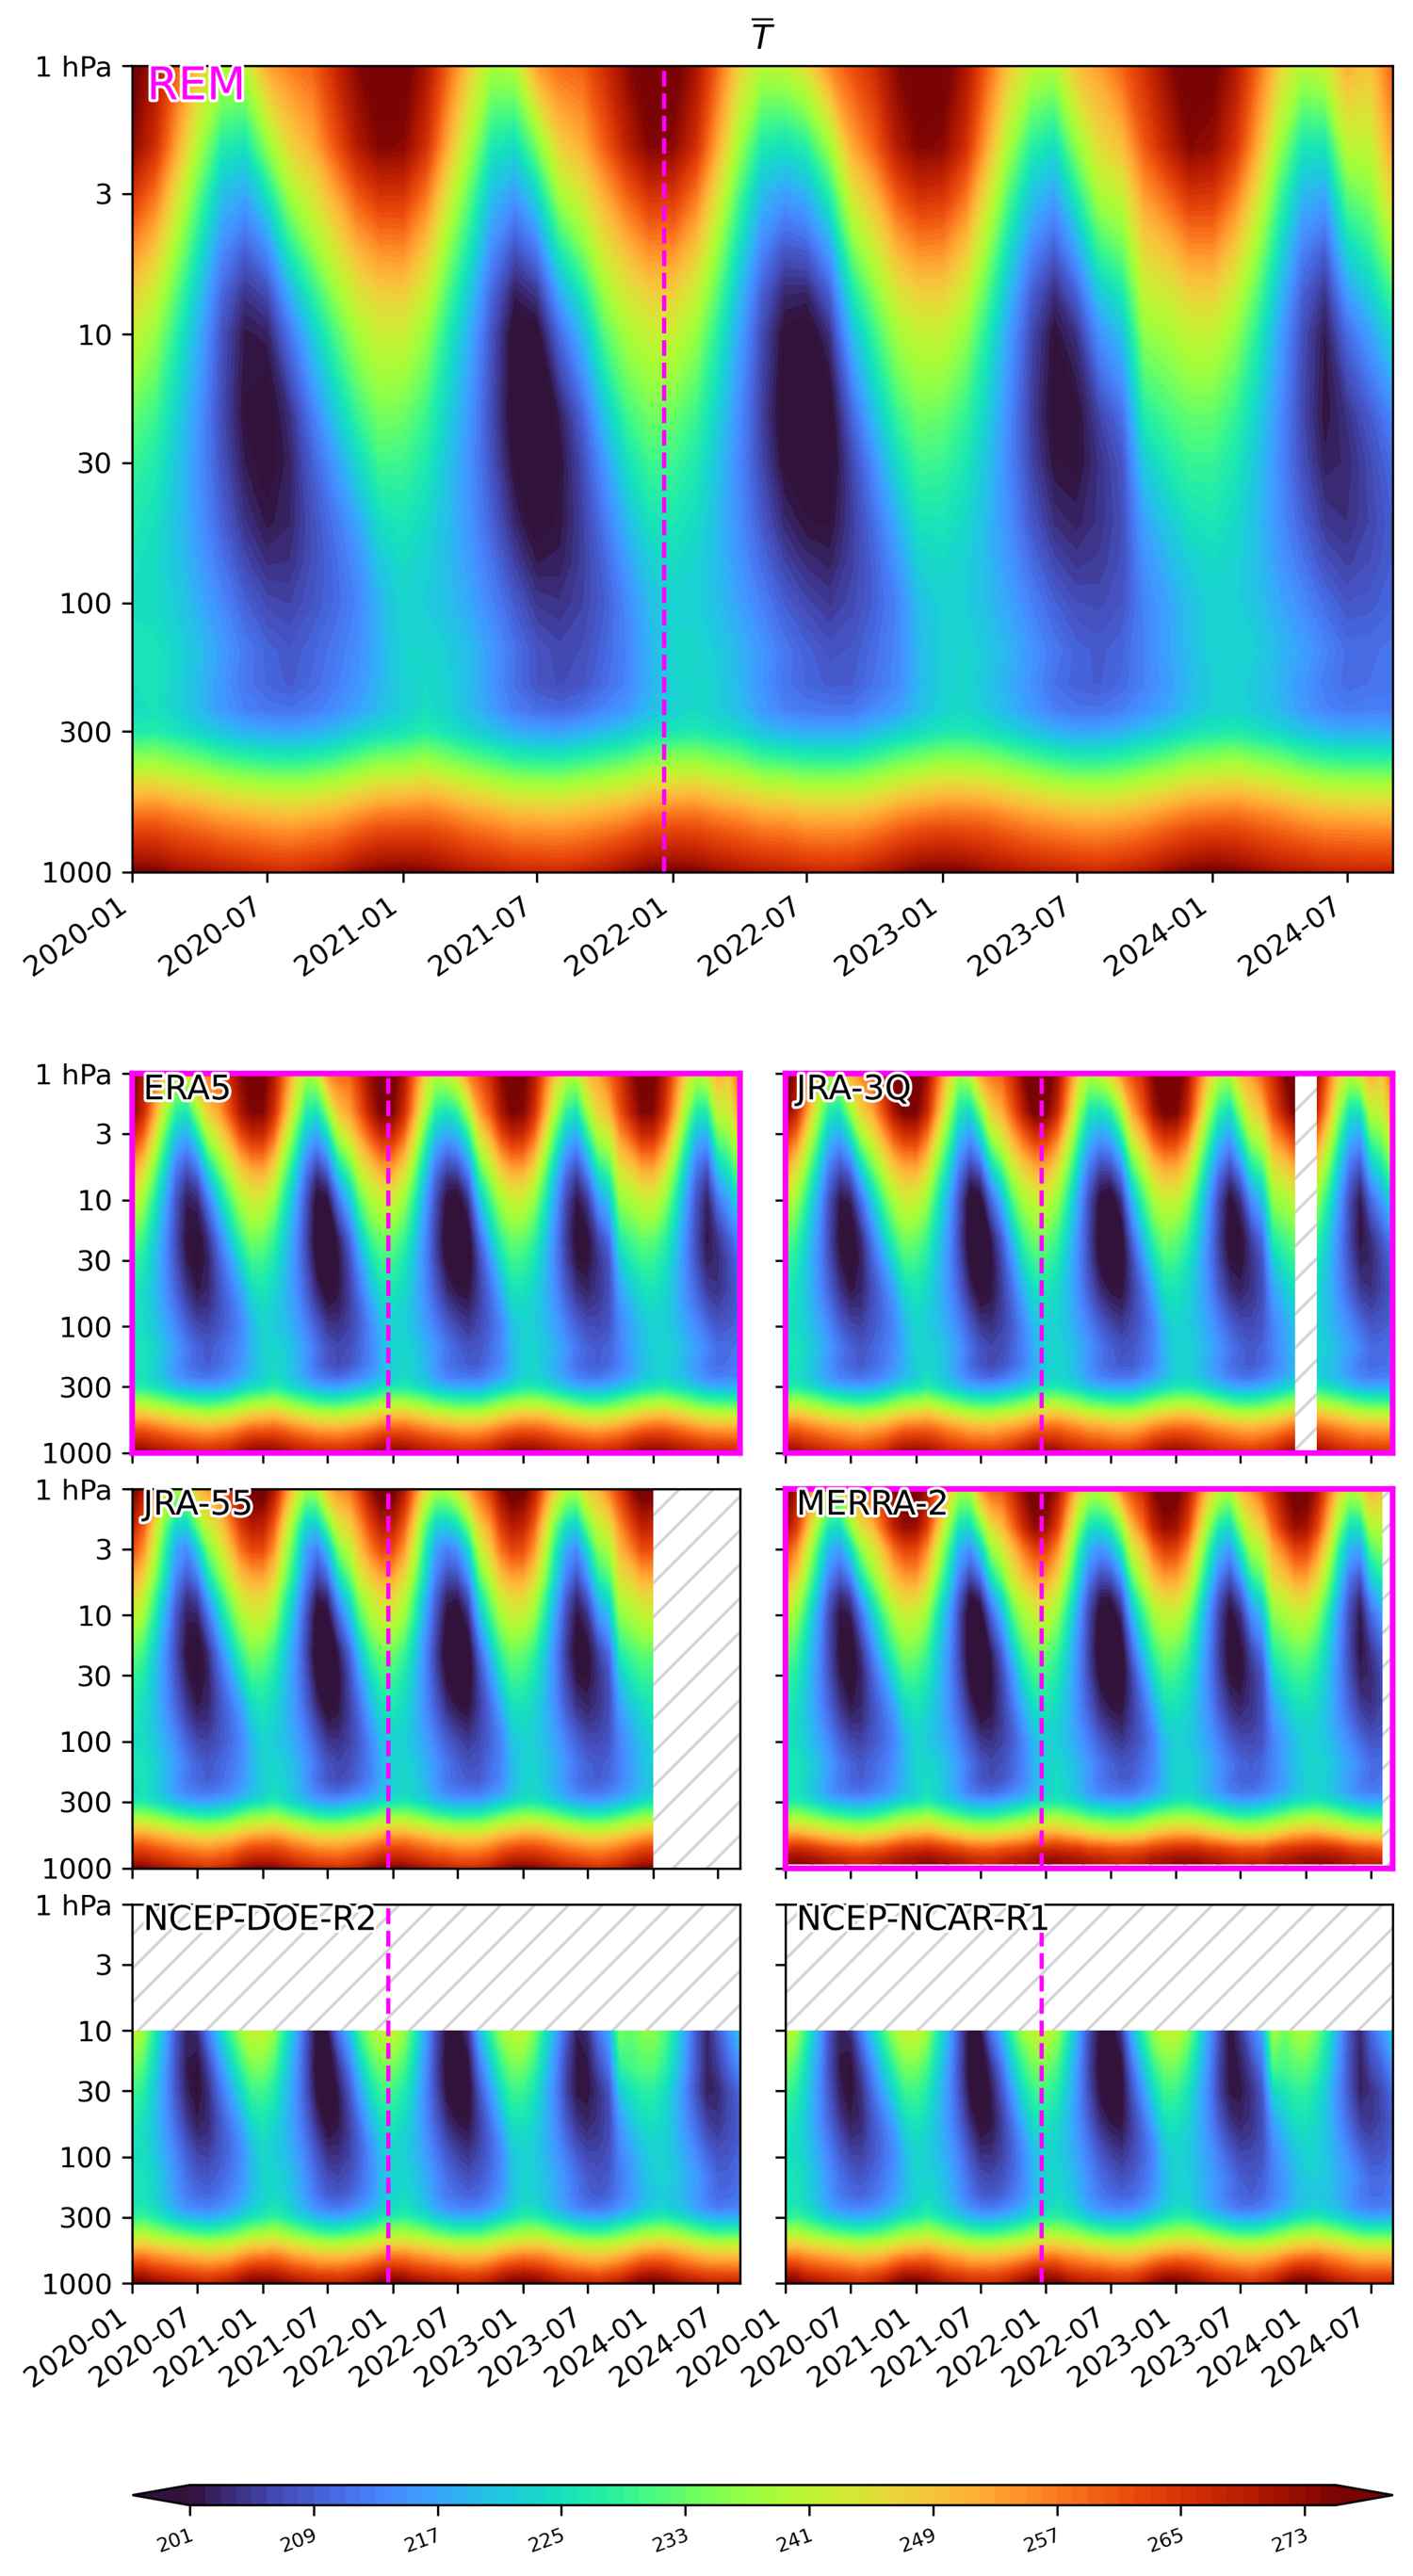
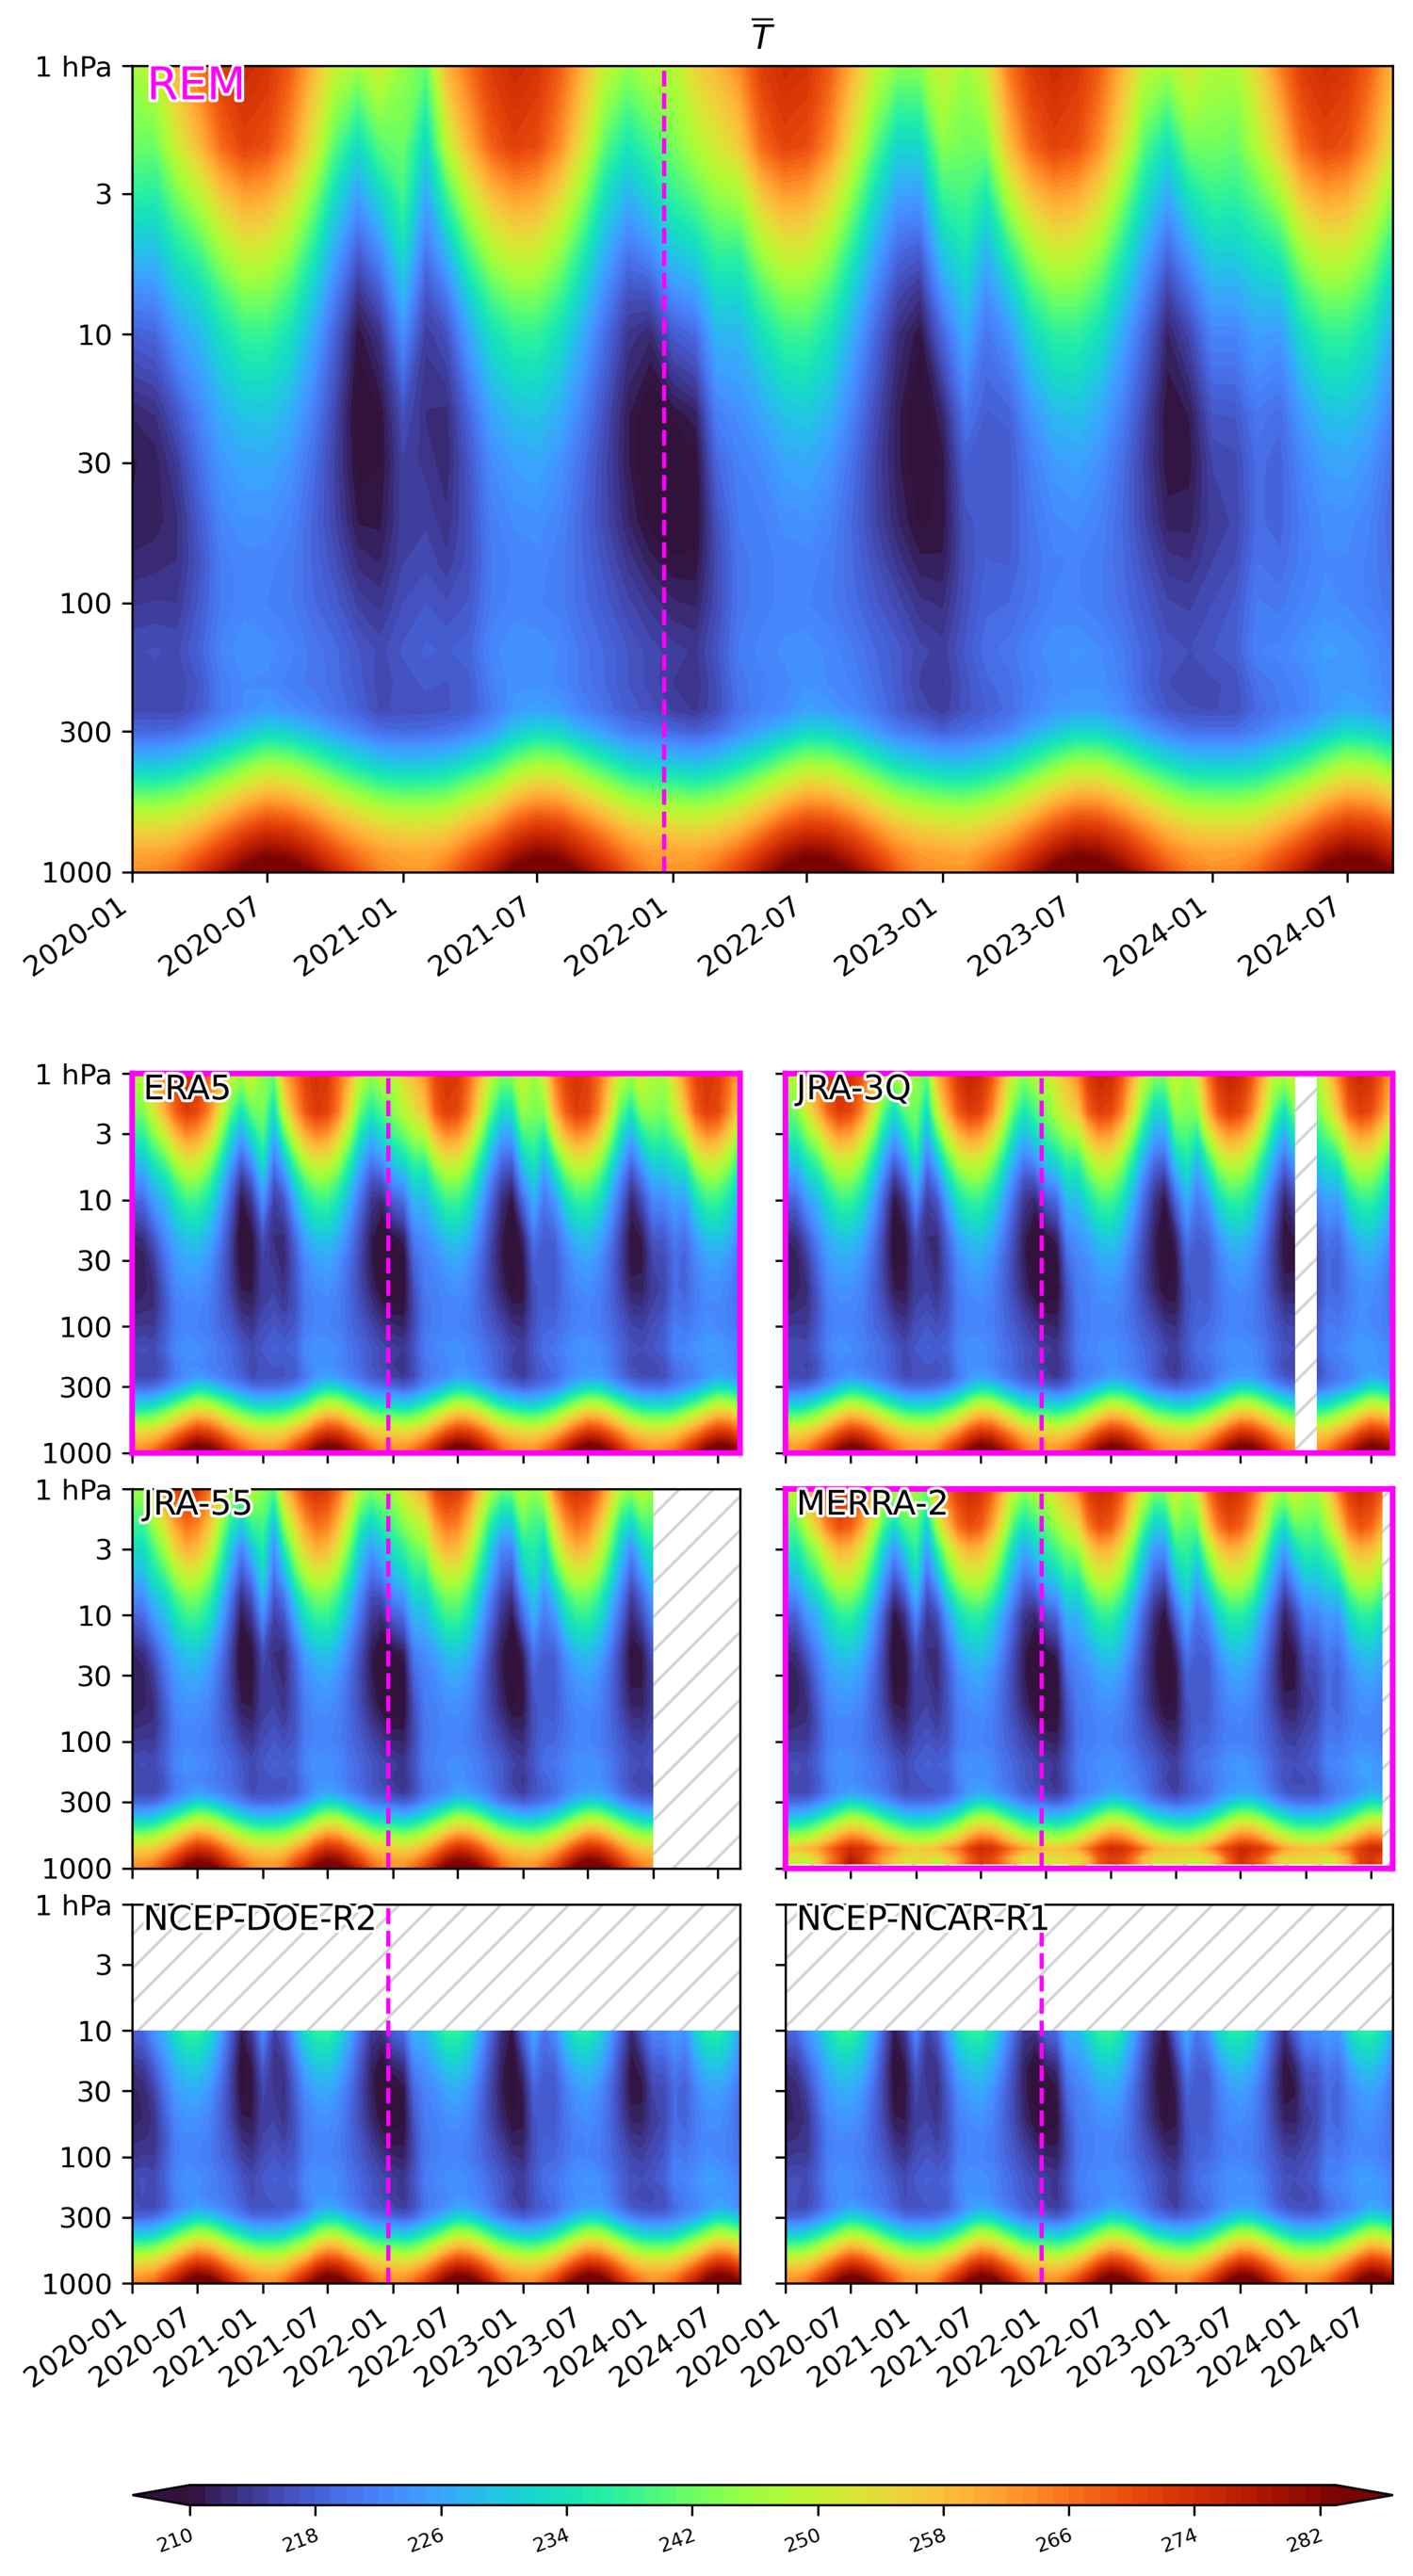
Absolute values (averaged over: 60S-30S)
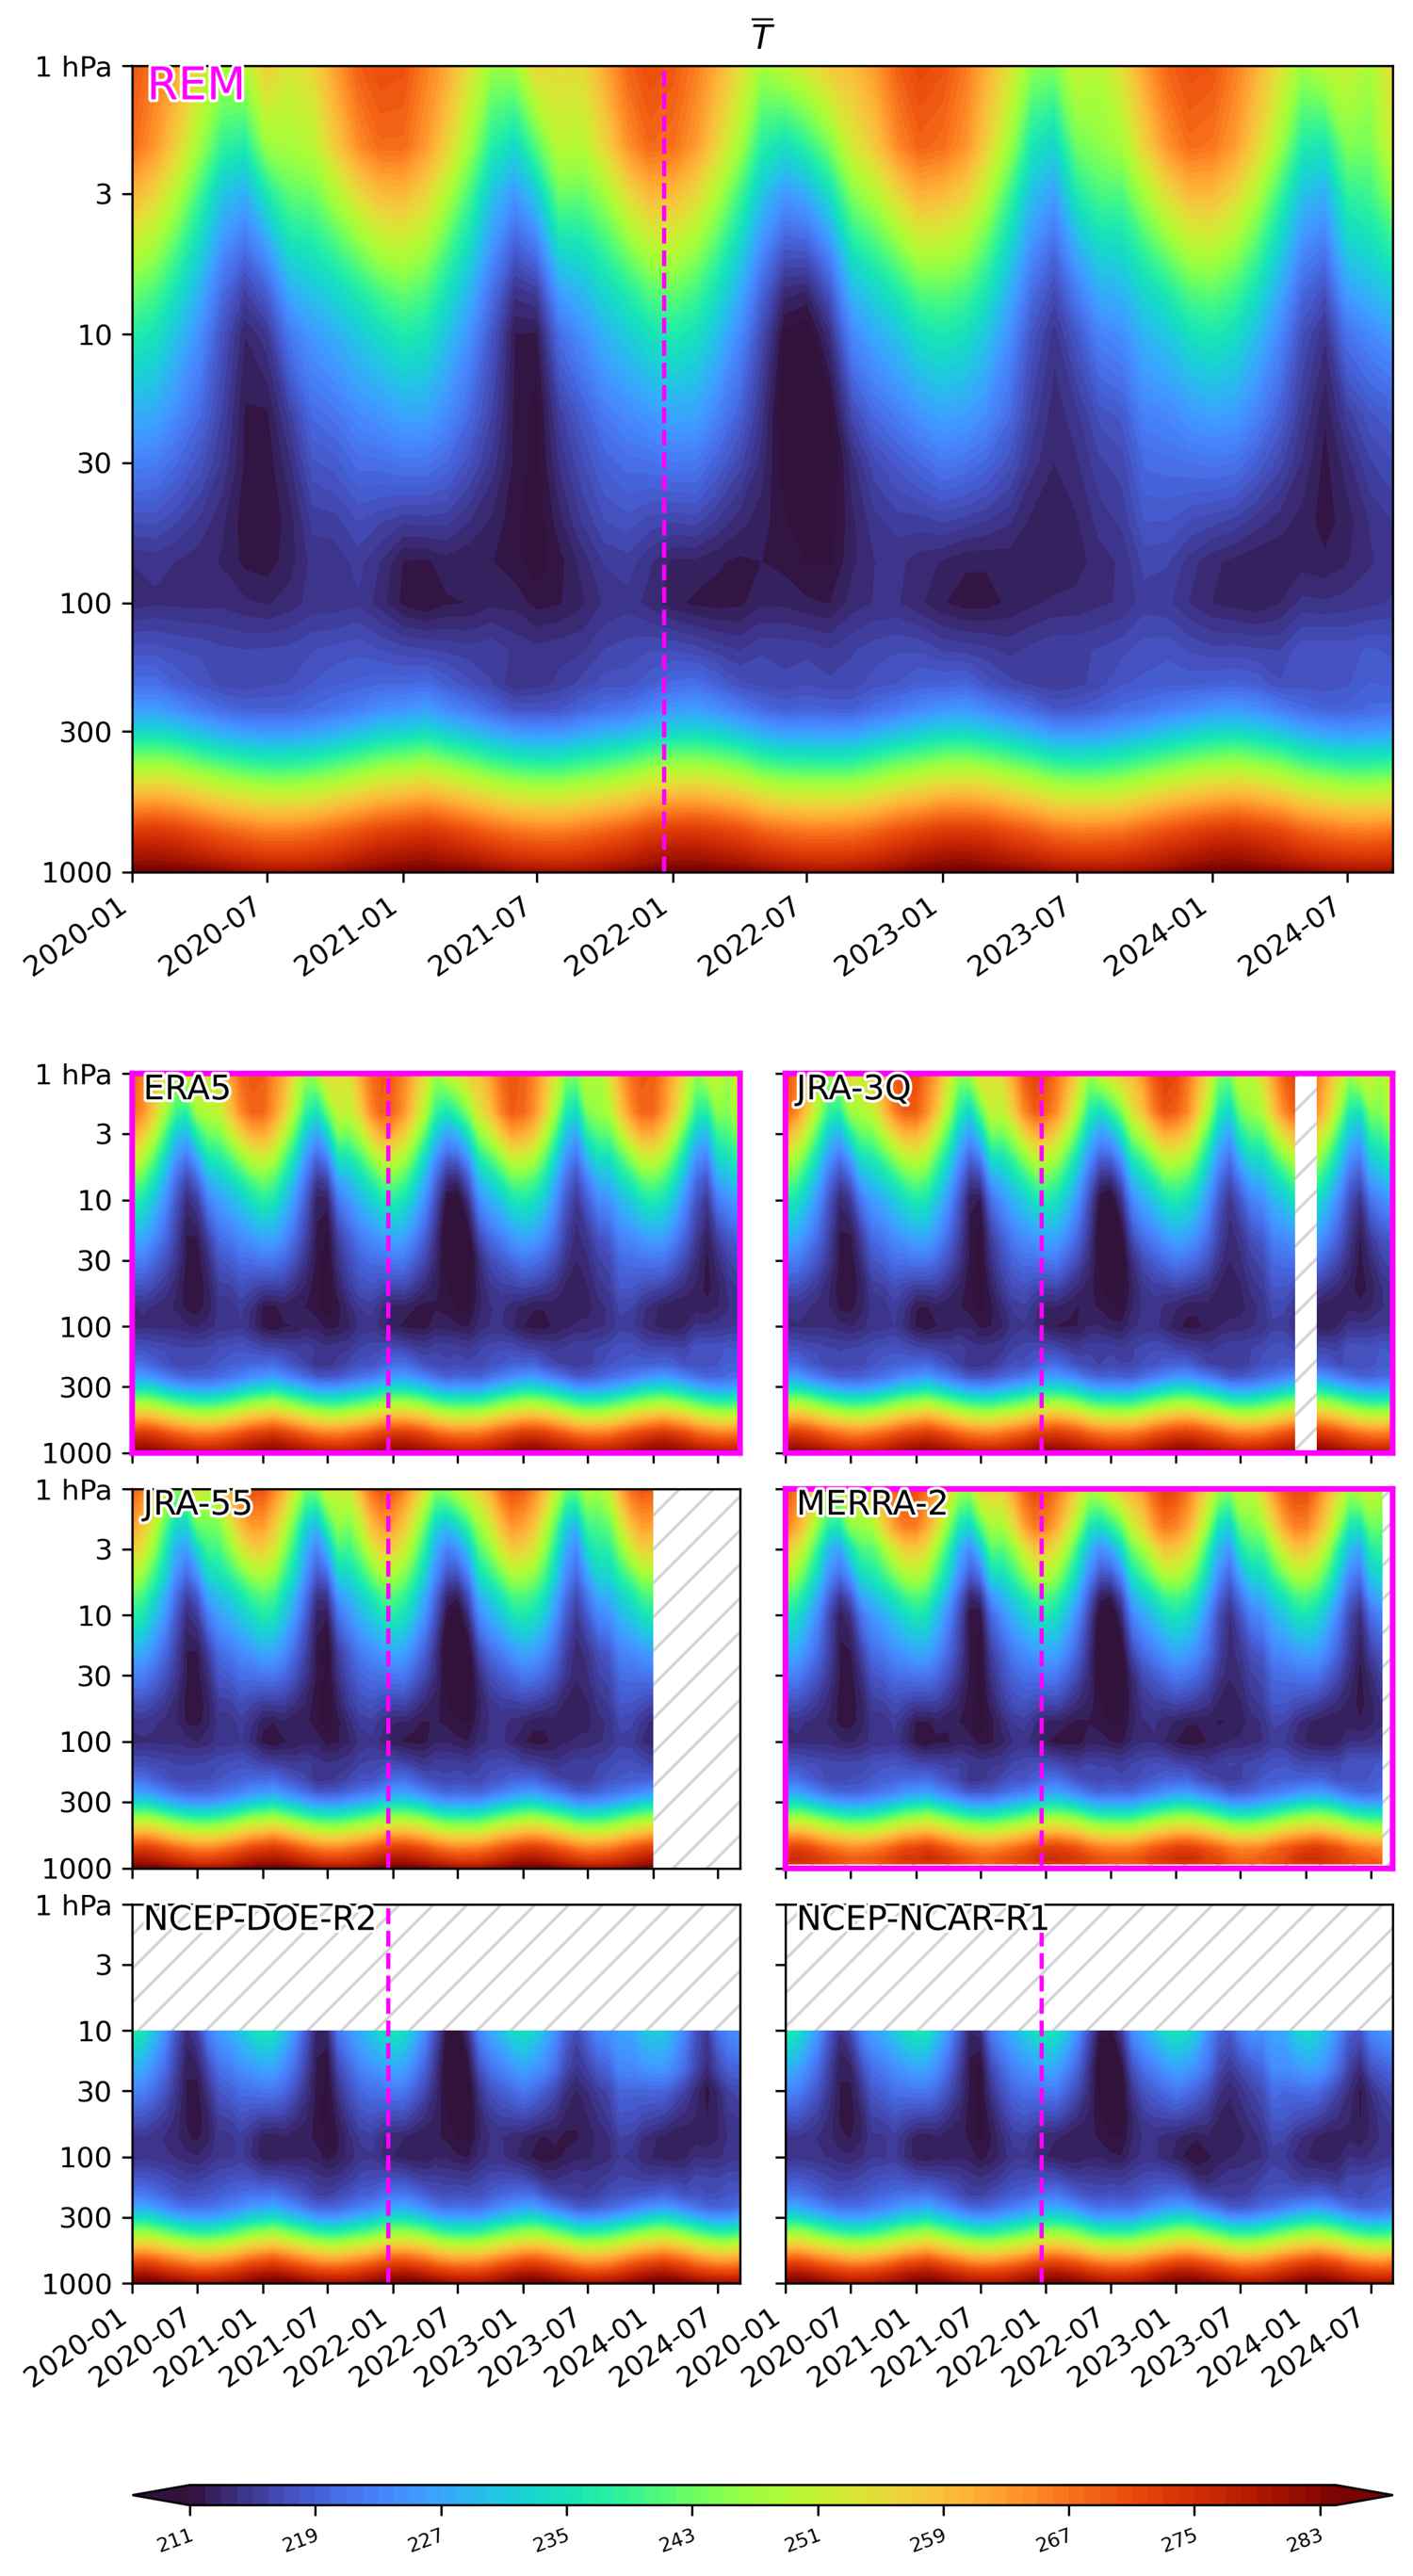
(top) Reanalysis ensemble mean (REM) of “air temperature” plotted as absolute values as a function of pressure and time. (below) Same but plotted for individual reanalyses. Reanalyses included in the REM are indicated with magenta borders. Unavailable data is hatched. The Hunga Tonga–Hunga Ha’apai eruption occured on 20 December 2021.
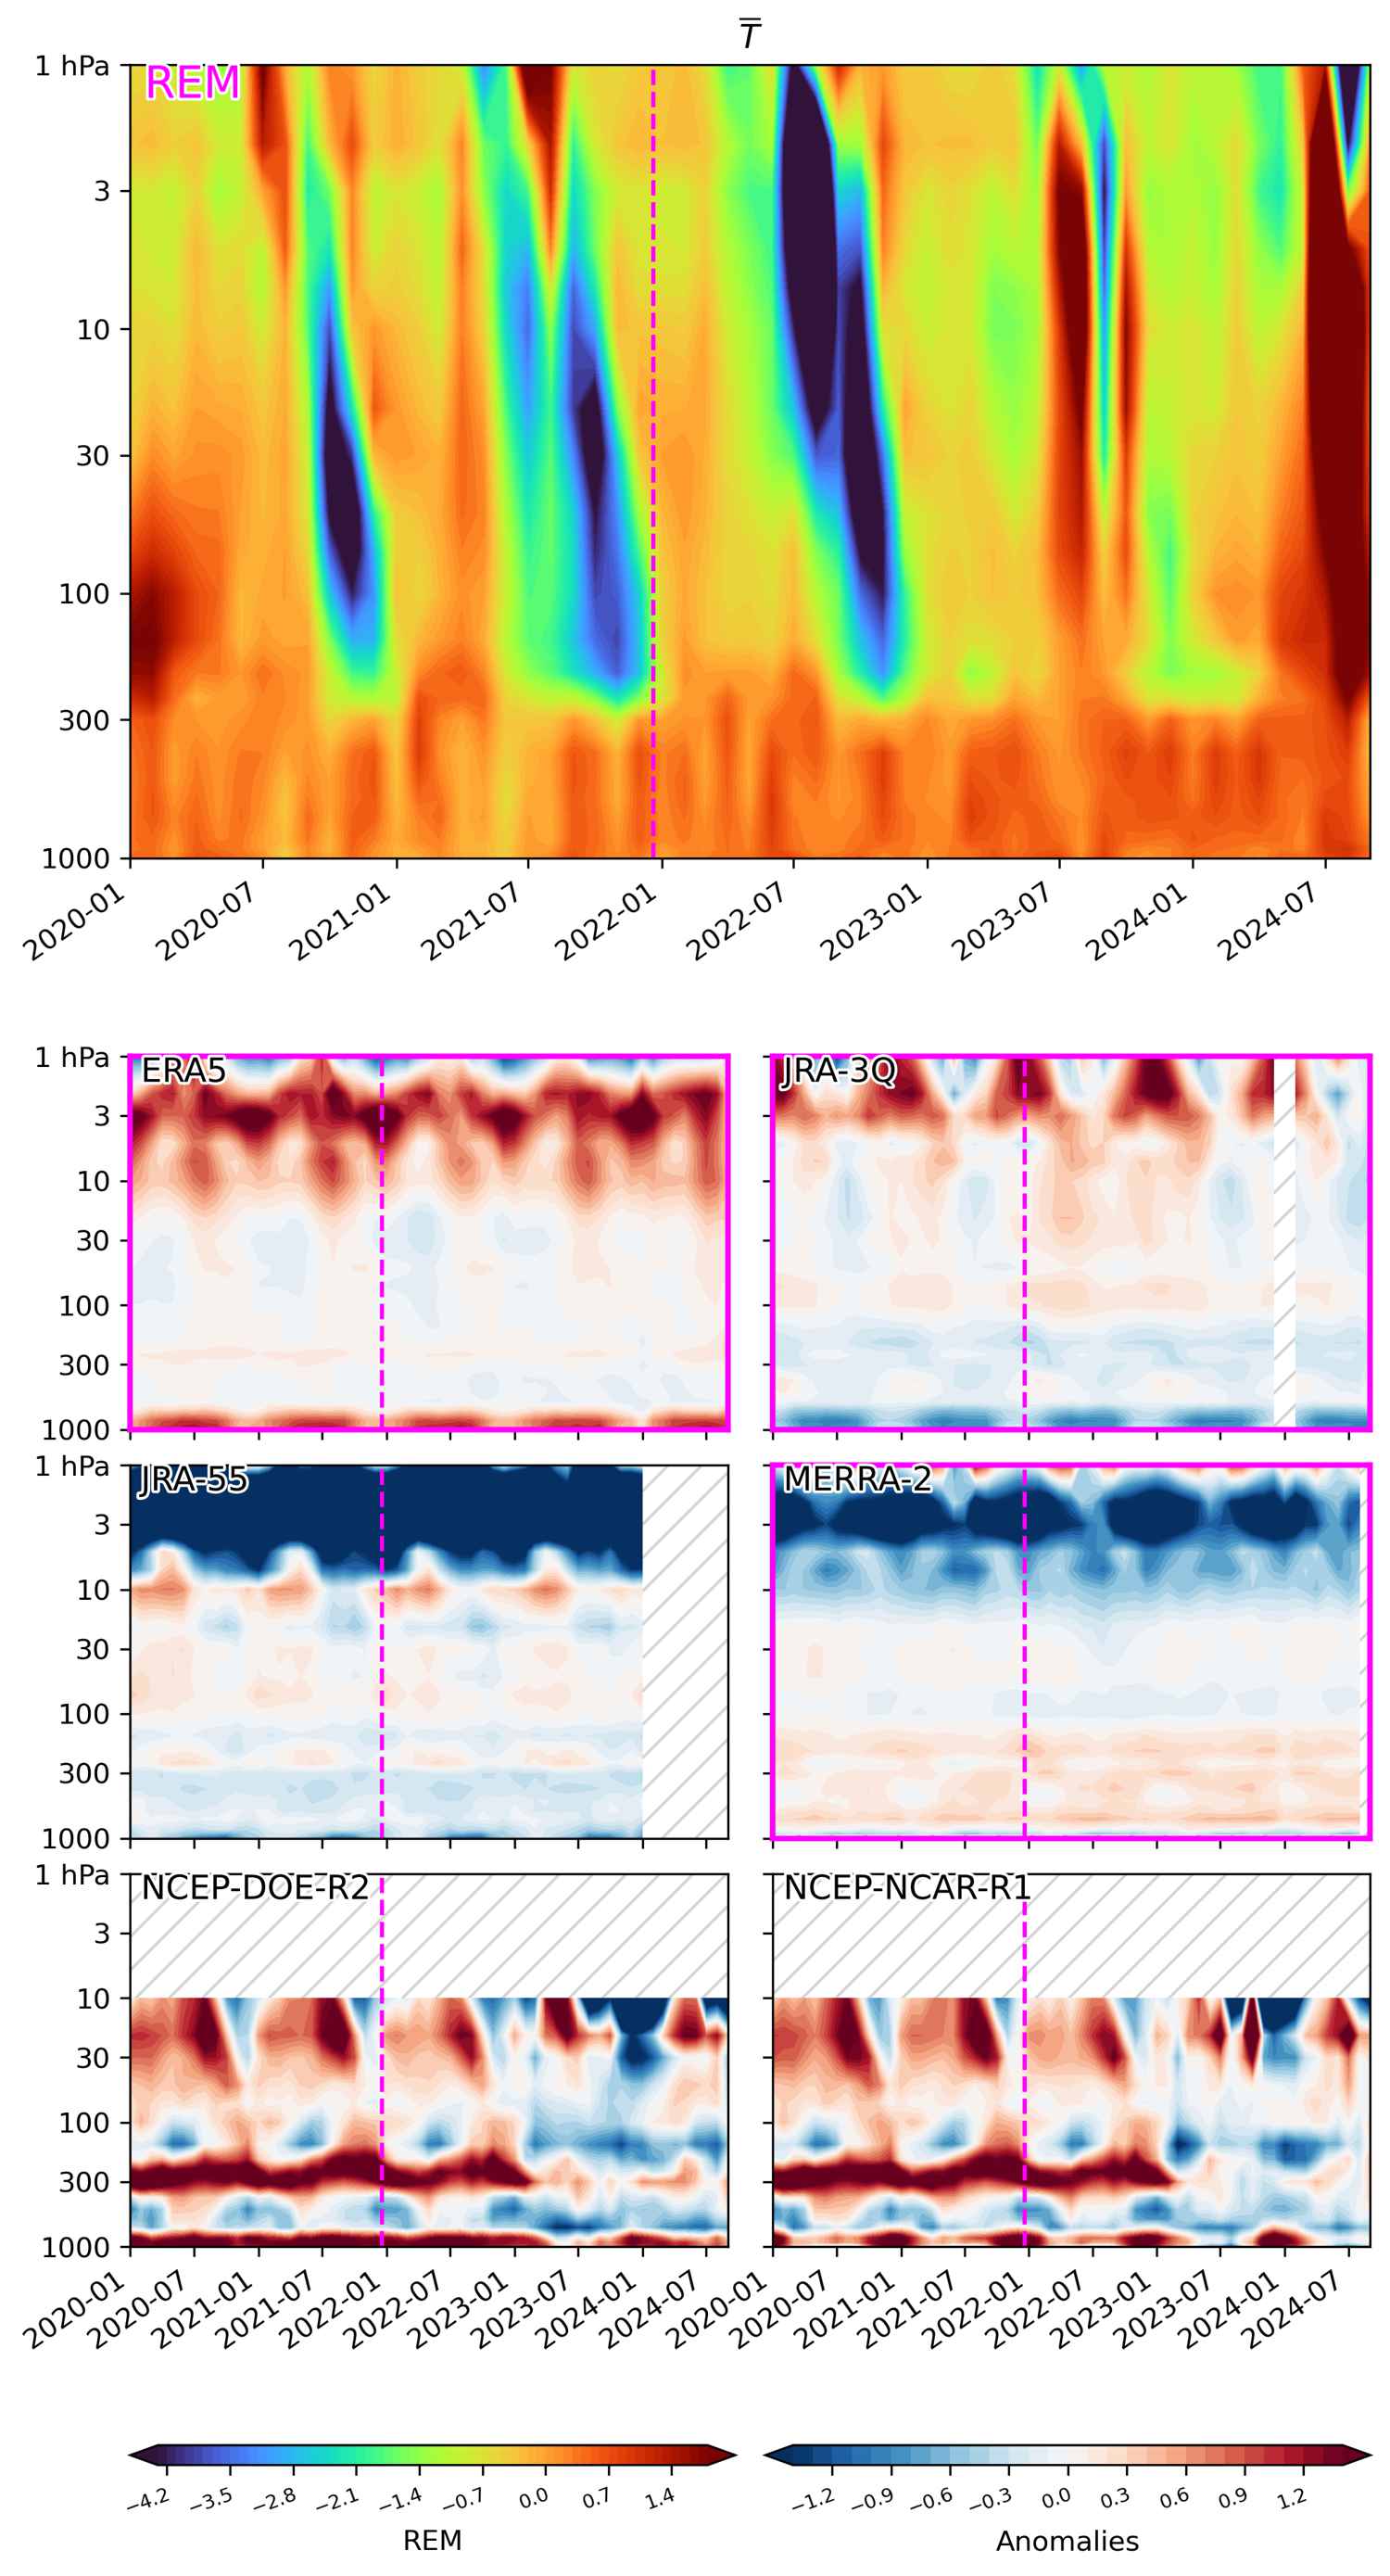
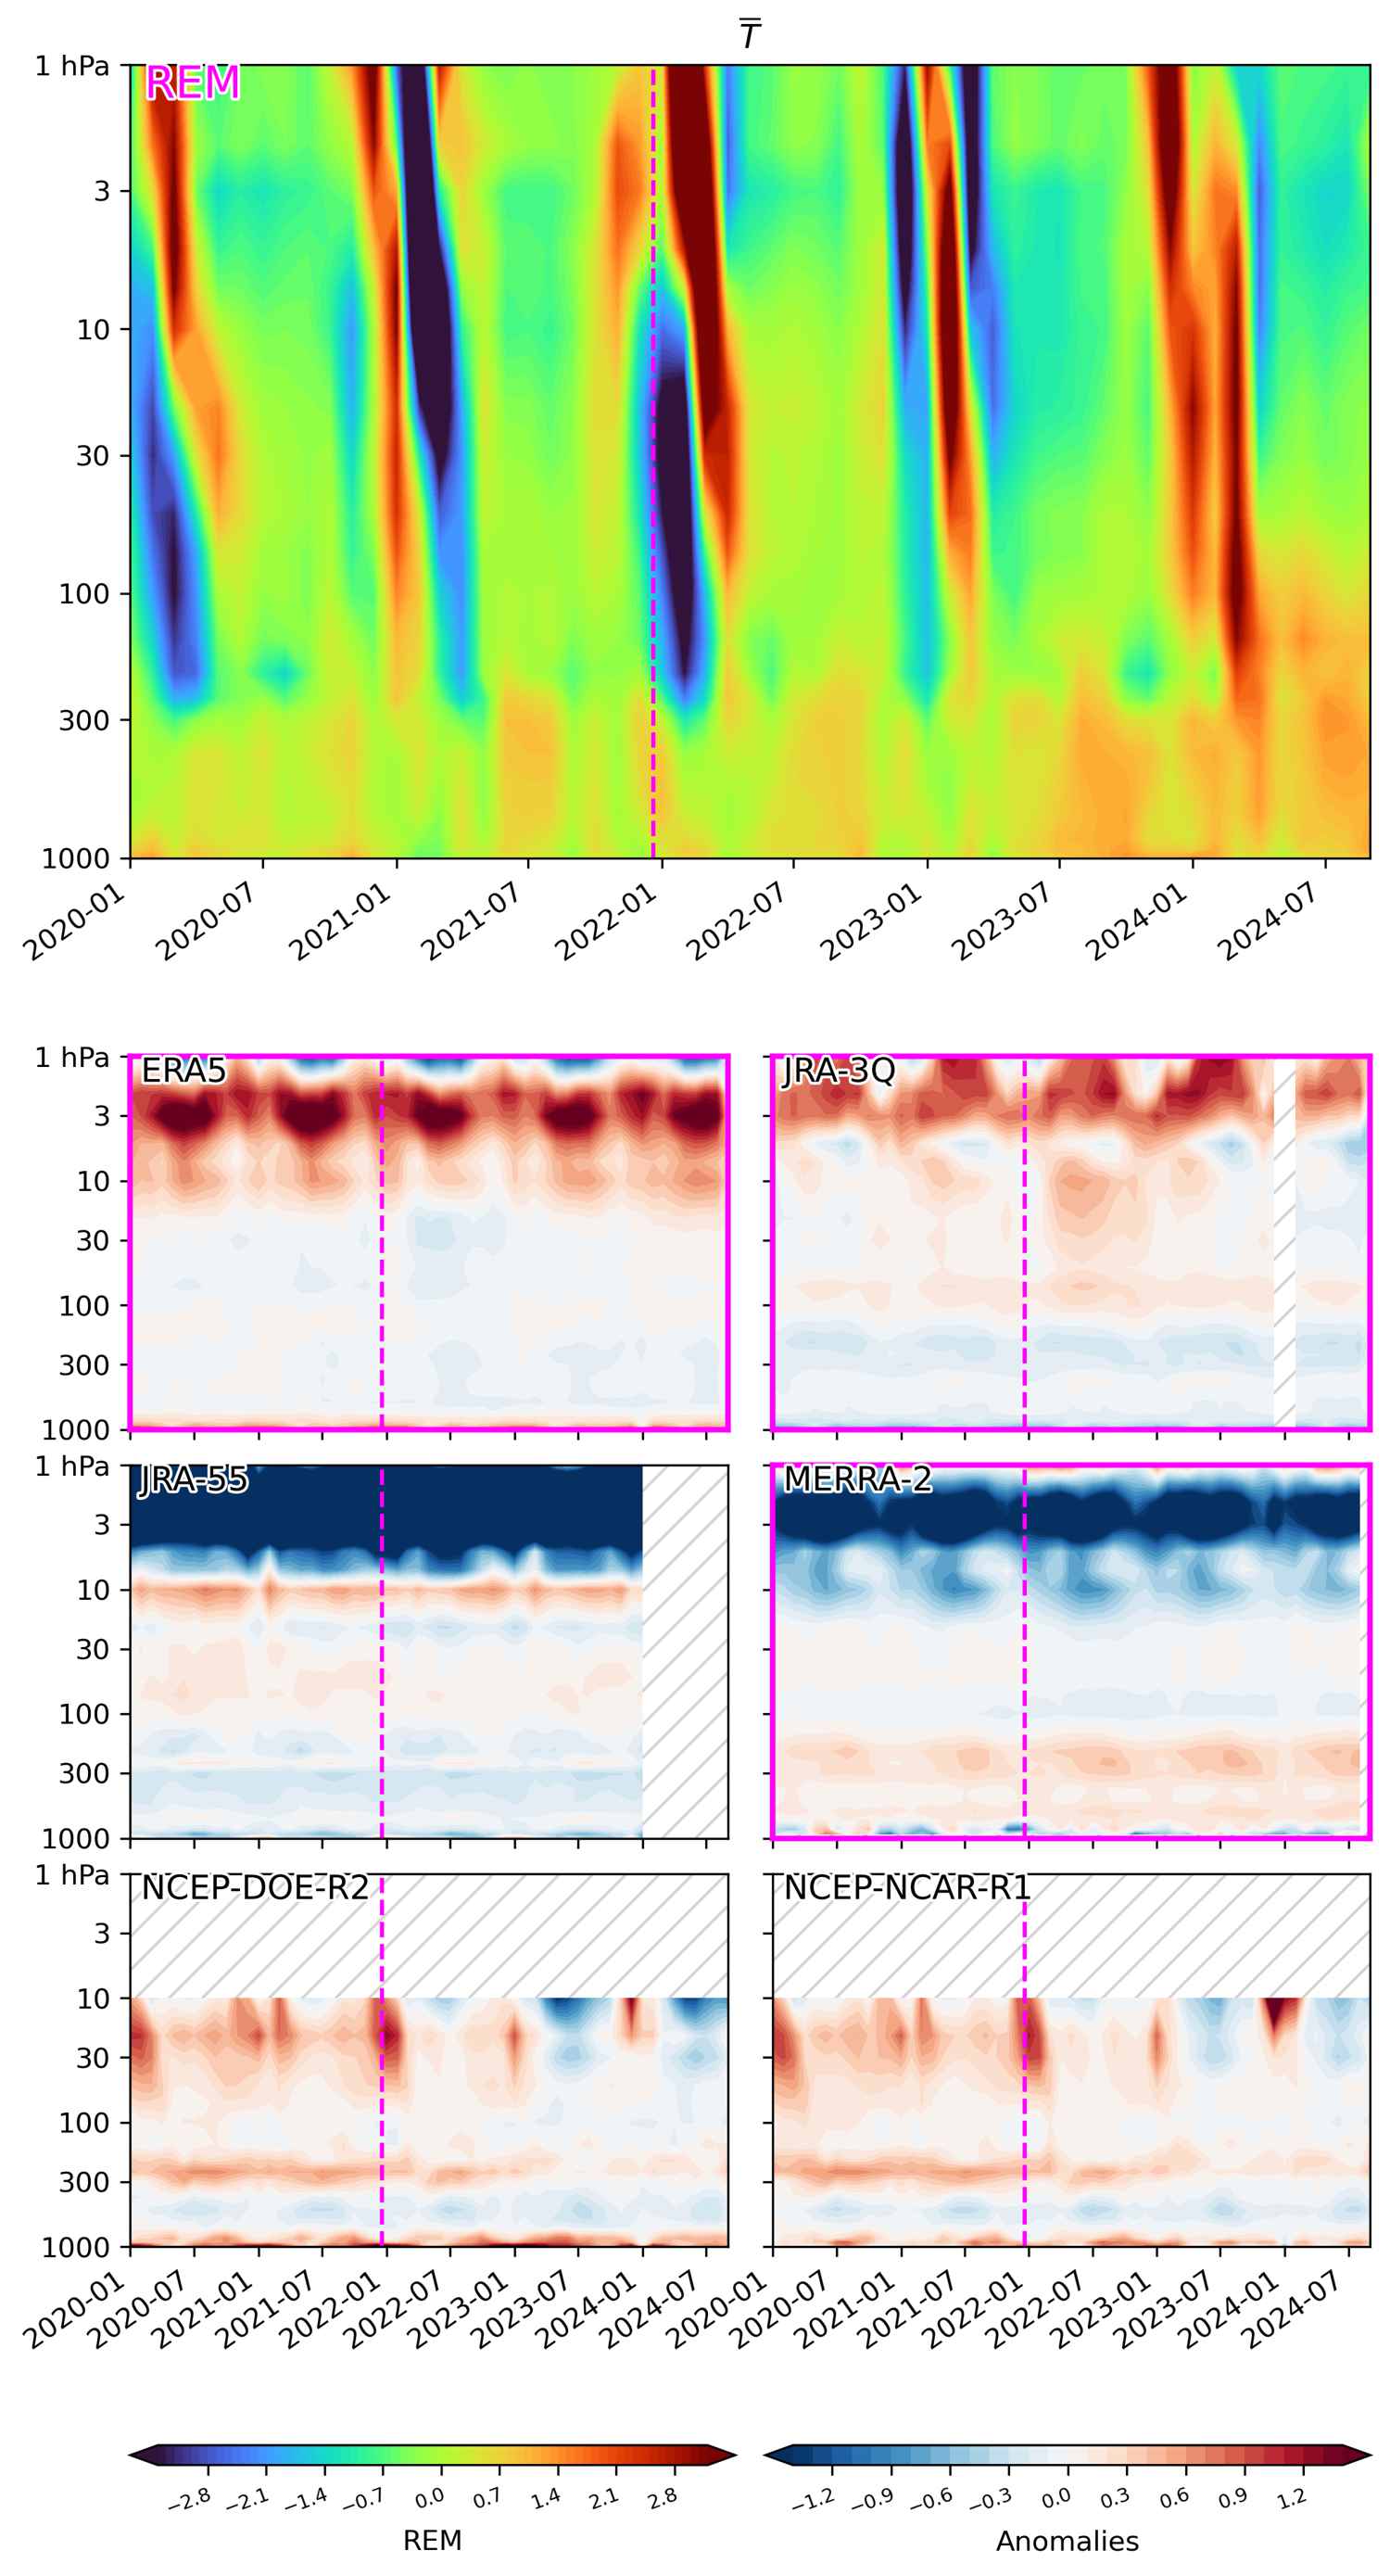
Anomalies as departure from the 2000-2022 monthly climatology (averaged over: 60S-30S)
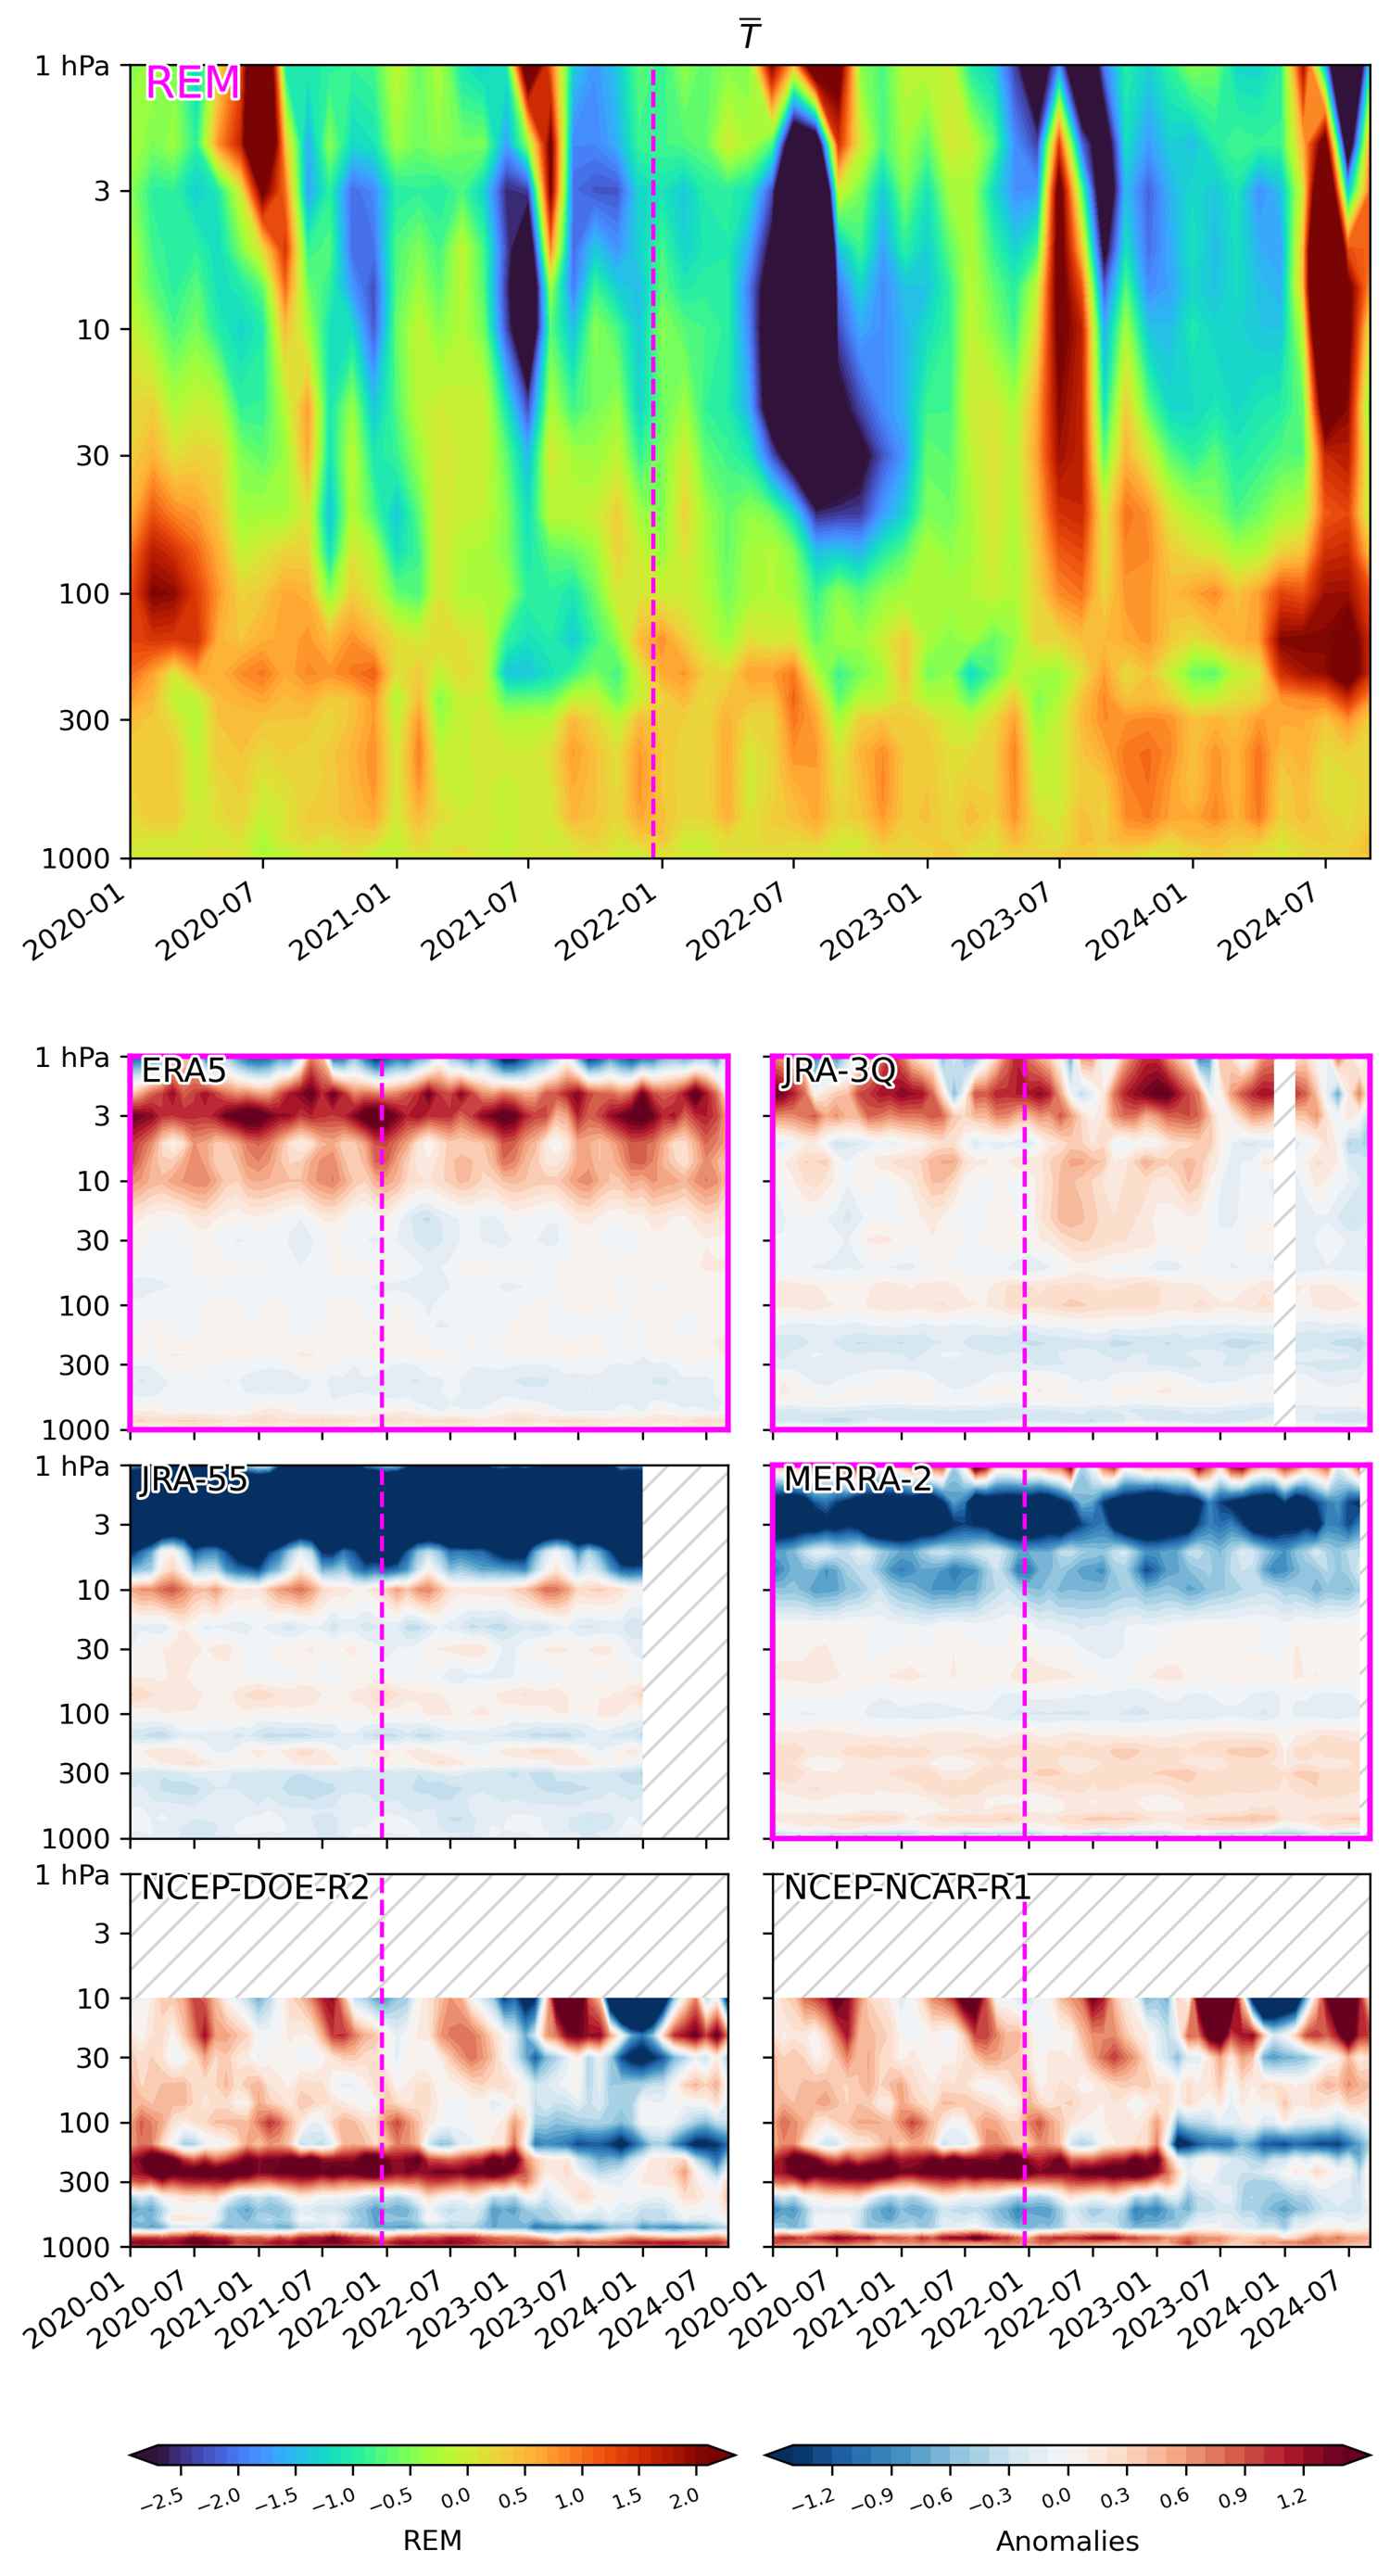
(top) Reanalysis ensemble mean (REM) of “air temperature” plotted as anomalies as a function of pressure and time. (below) The anomaly with respect to the REM is plotted for individual reanalyses. Reanalyses included in the REM are indicated with magenta borders. Unavailable data is hatched. The Hunga Tonga–Hunga Ha’apai eruption occured on 20 December 2021.
Absolute values (averaged over: 89S-60S)
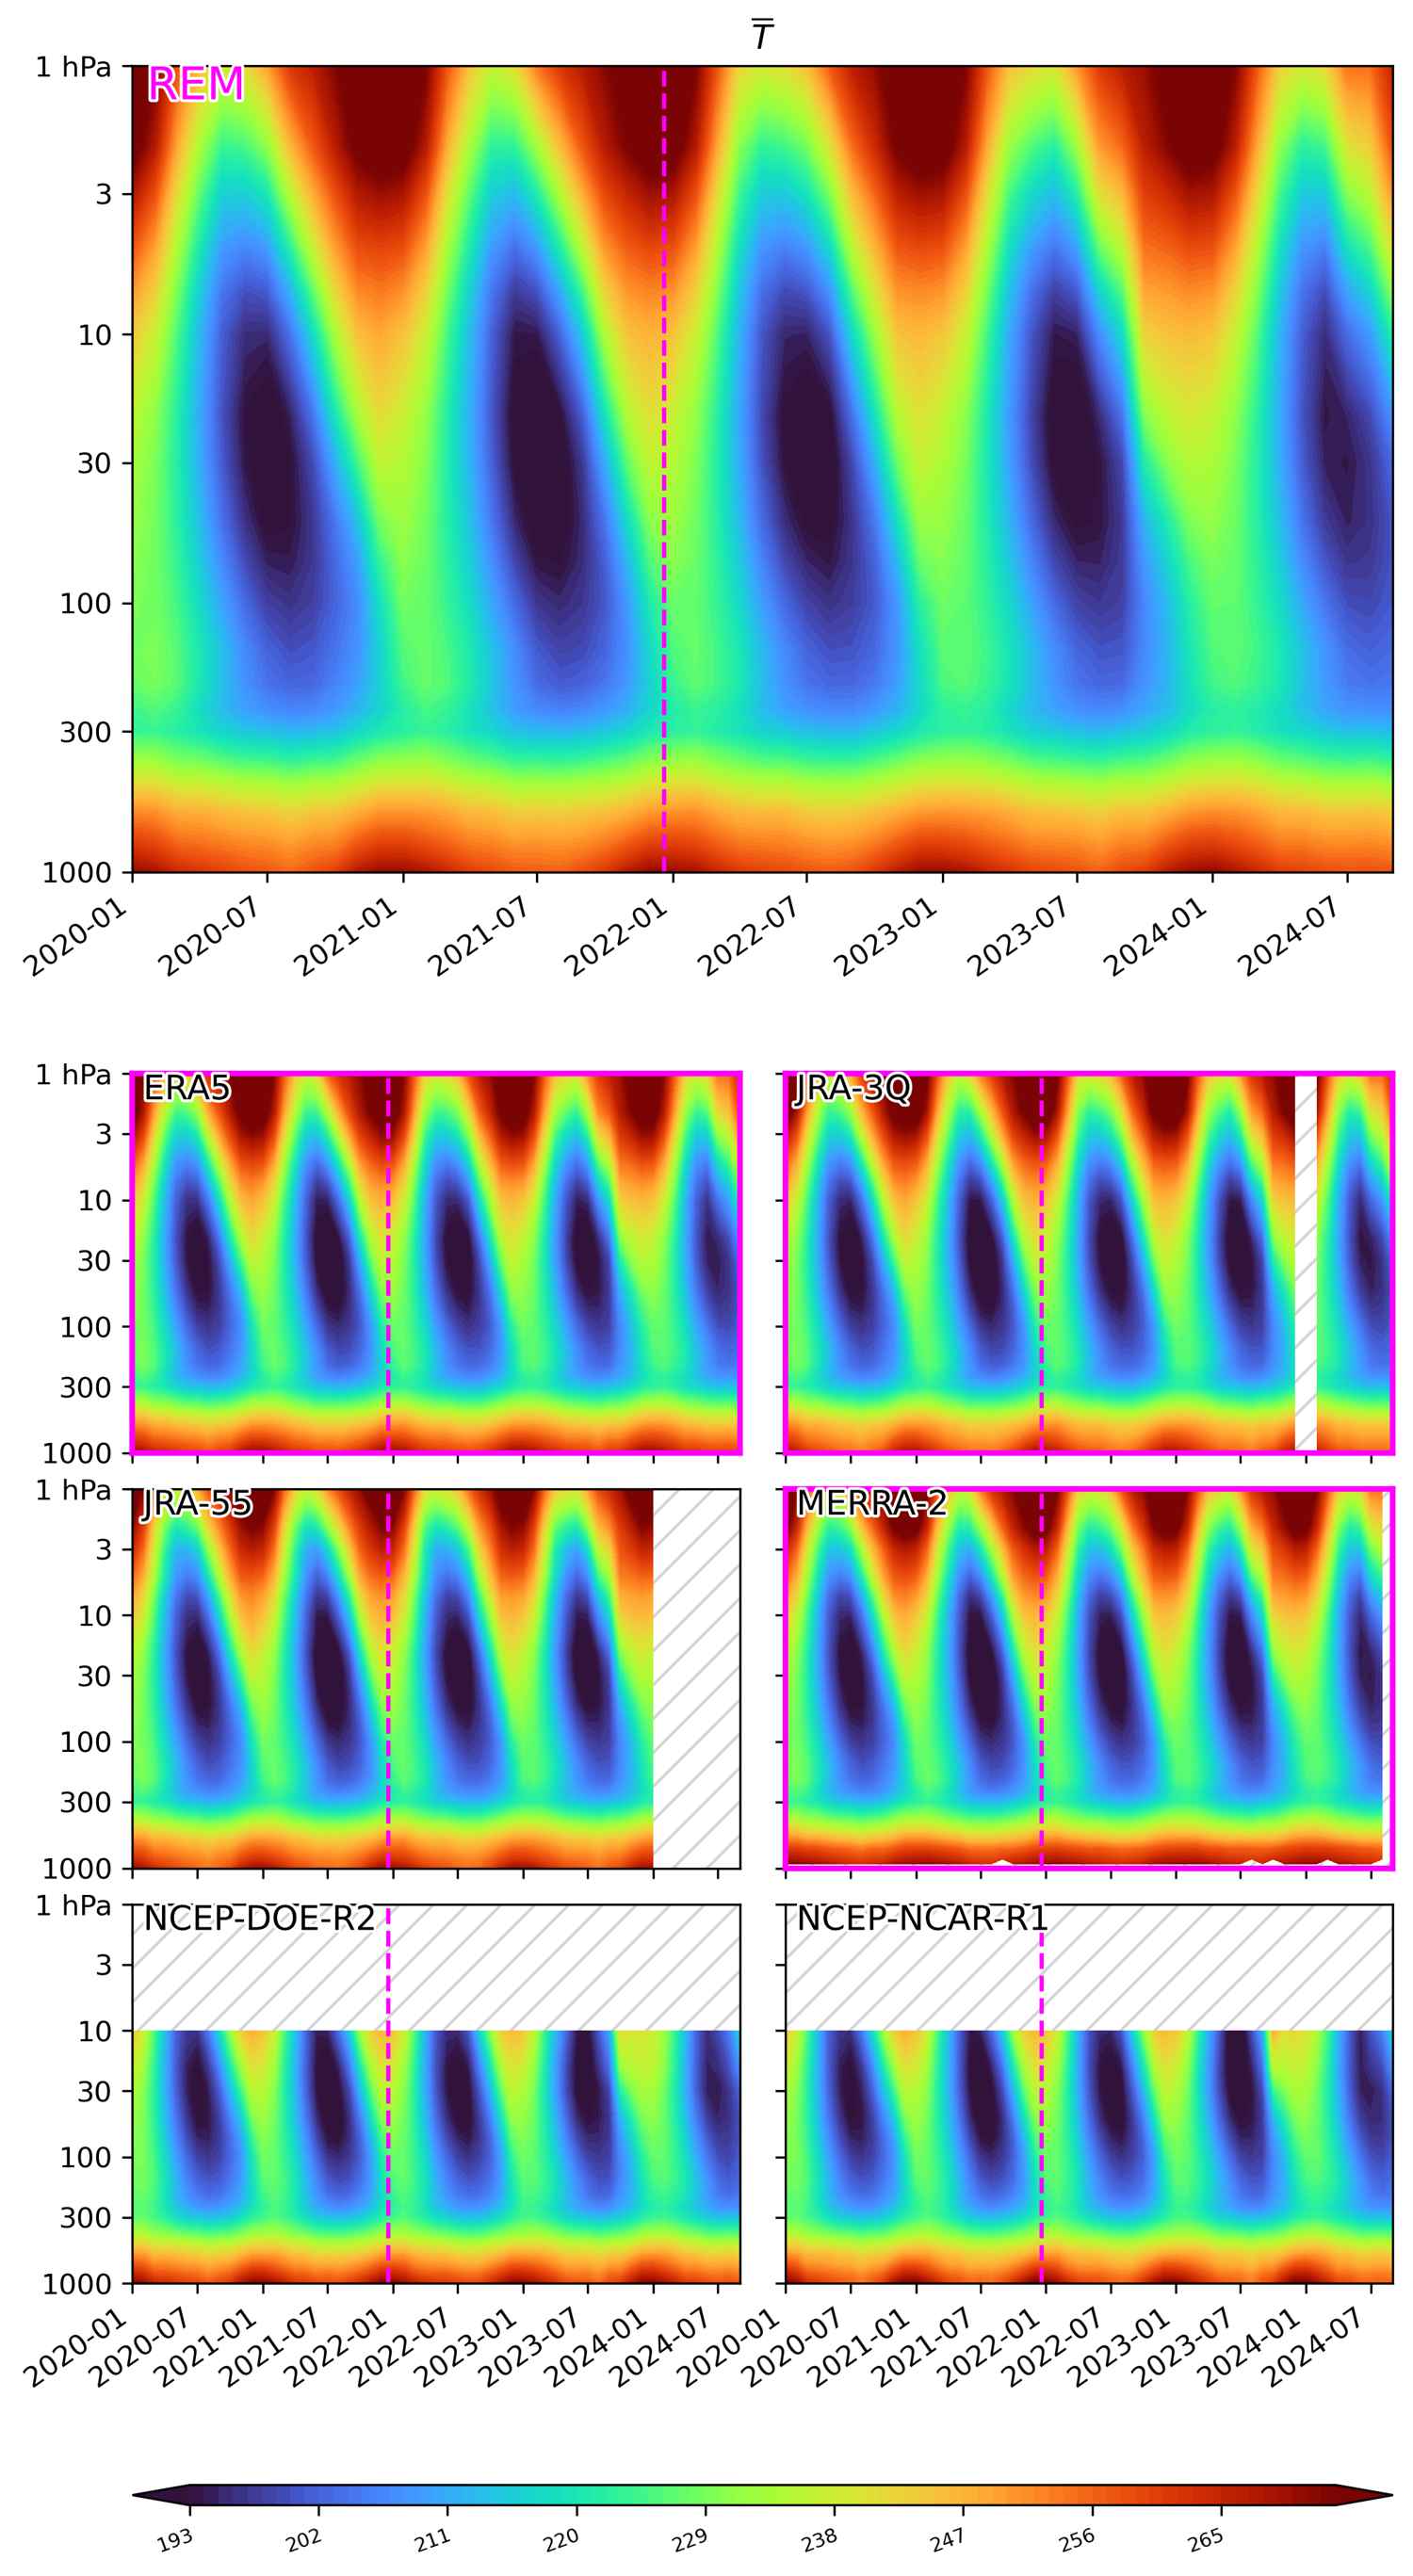
(top) Reanalysis ensemble mean (REM) of “air temperature” plotted as absolute values as a function of pressure and time. (below) Same but plotted for individual reanalyses. Reanalyses included in the REM are indicated with magenta borders. Unavailable data is hatched. The Hunga Tonga–Hunga Ha’apai eruption occured on 20 December 2021.
Anomalies as departure from the 2000-2022 monthly climatology (averaged over: 89S-60S)
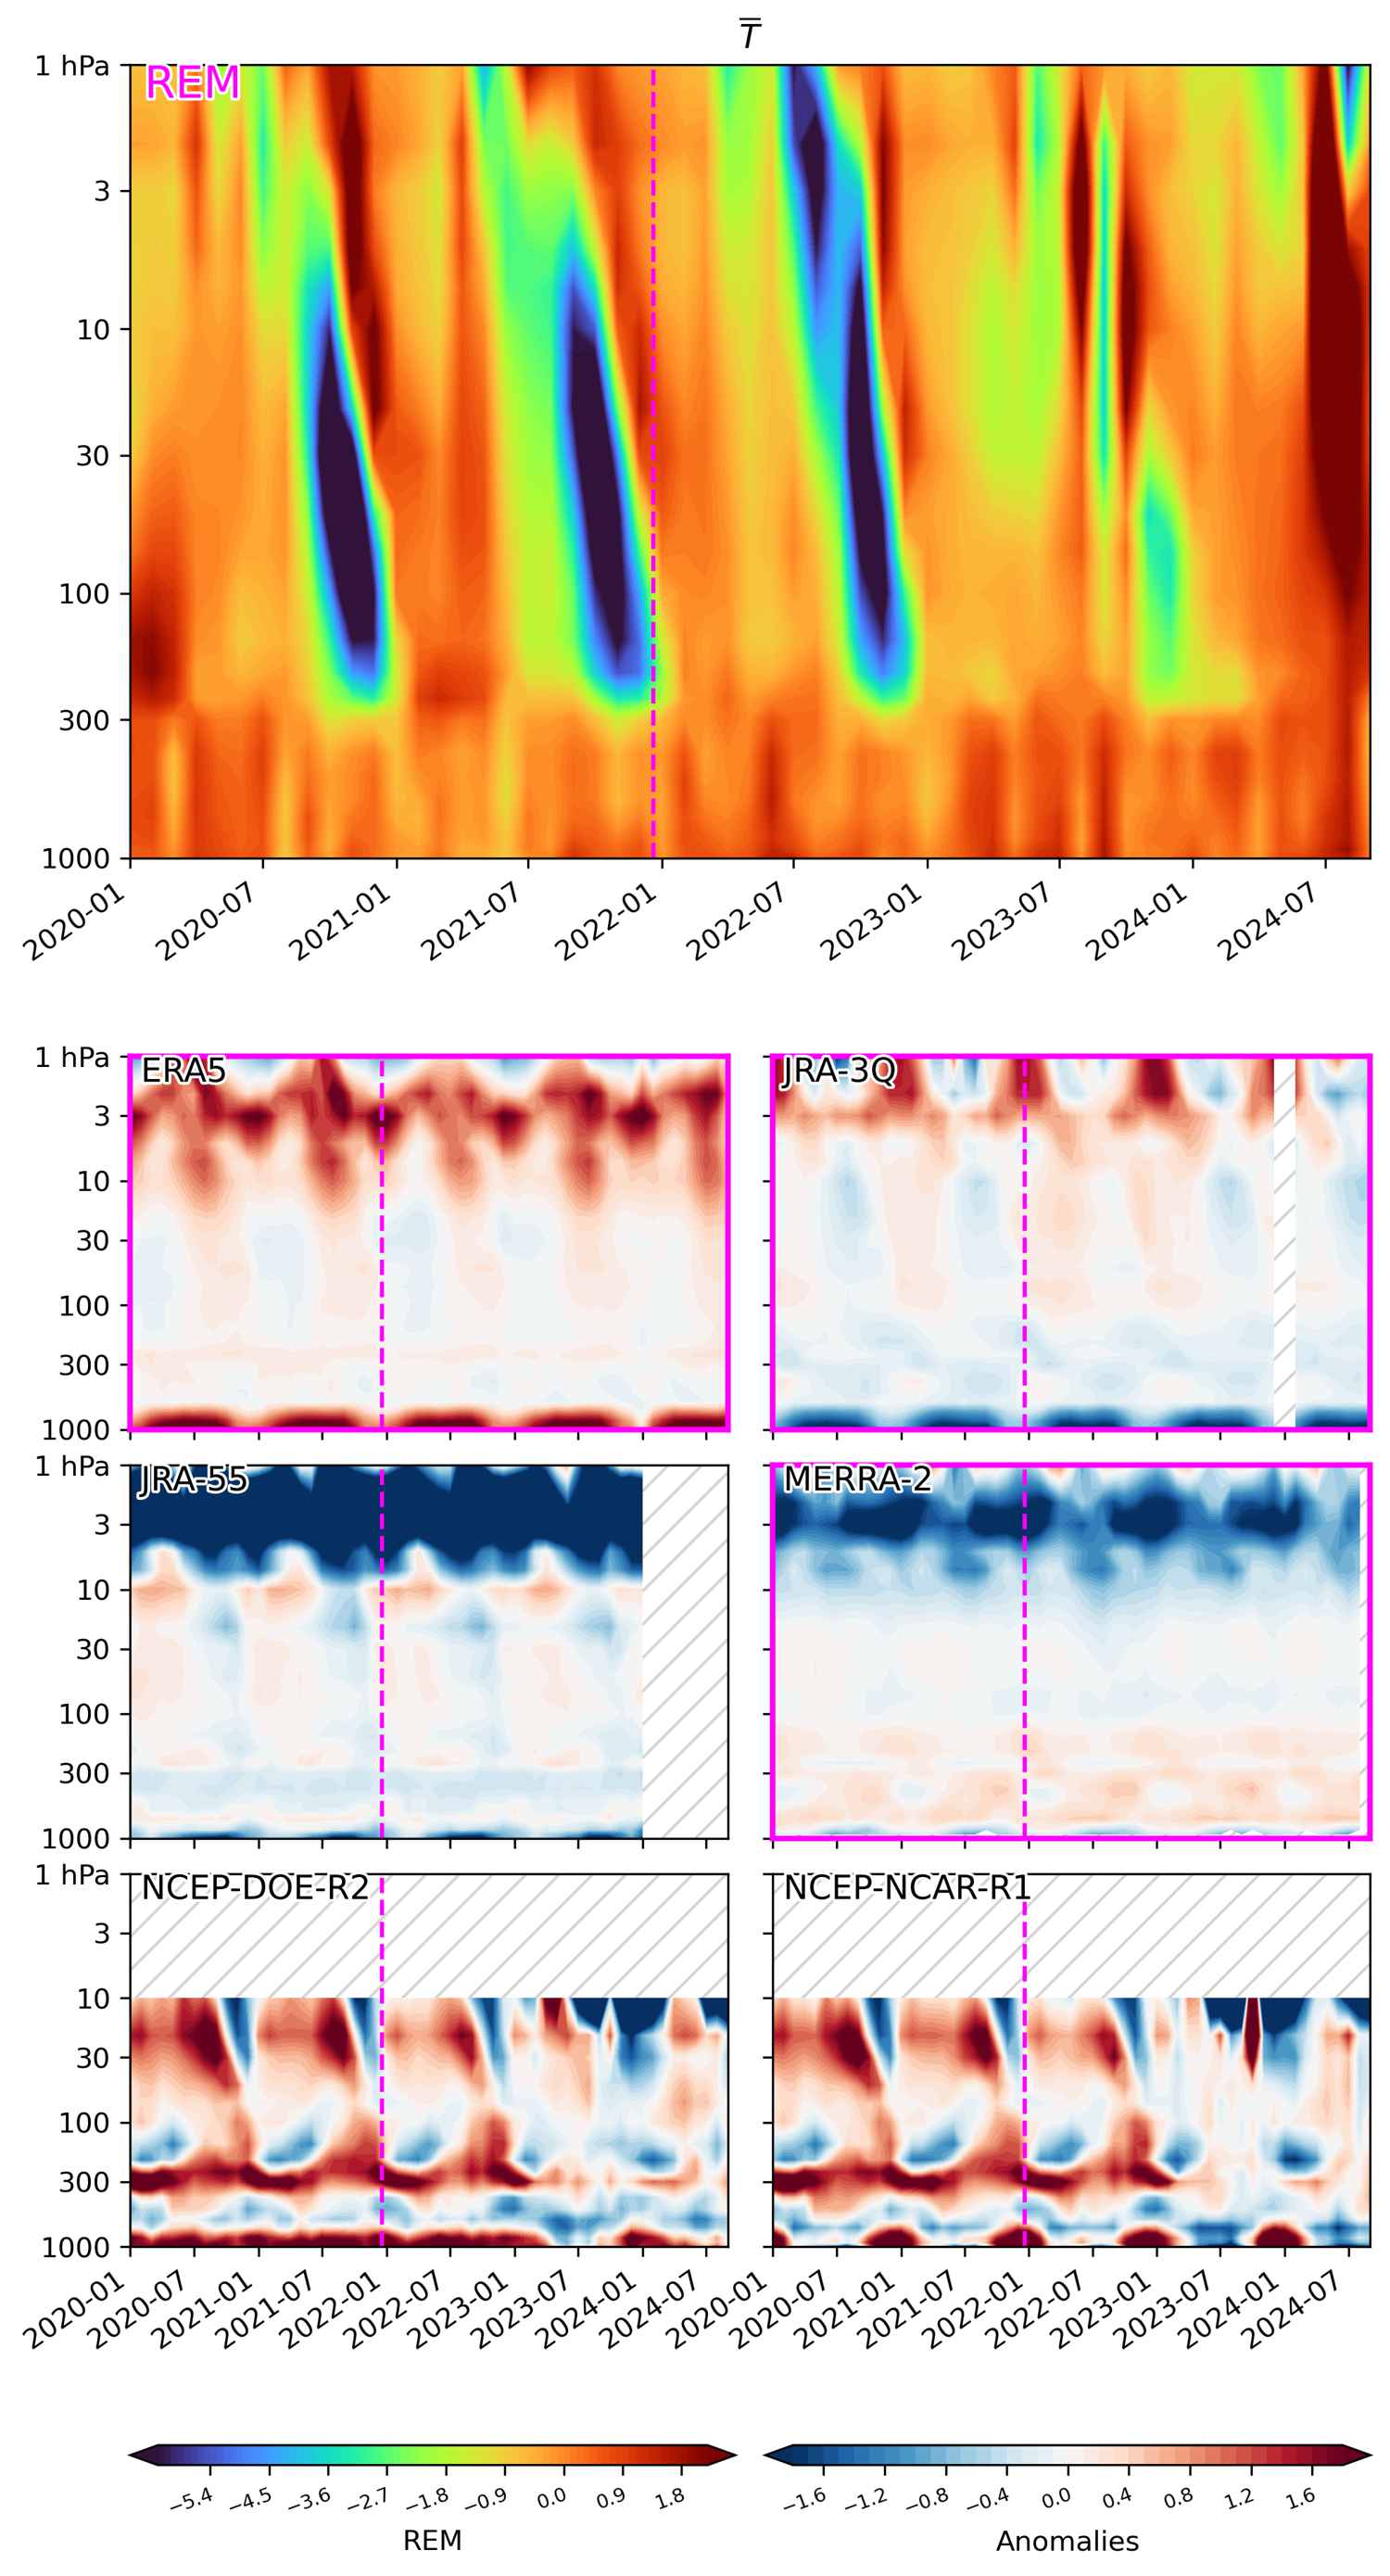
(top) Reanalysis ensemble mean (REM) of “air temperature” plotted as anomalies as a function of pressure and time. (below) The anomaly with respect to the REM is plotted for individual reanalyses. Reanalyses included in the REM are indicated with magenta borders. Unavailable data is hatched. The Hunga Tonga–Hunga Ha’apai eruption occured on 20 December 2021.
Absolute values (averaged over: 89S-45S)
(top) Reanalysis ensemble mean (REM) of “air temperature” plotted as absolute values as a function of pressure and time. (below) Same but plotted for individual reanalyses. Reanalyses included in the REM are indicated with magenta borders. Unavailable data is hatched. The Hunga Tonga–Hunga Ha’apai eruption occured on 20 December 2021.
Anomalies as departure from the 2000-2022 monthly climatology (averaged over: 89S-45S)
(top) Reanalysis ensemble mean (REM) of “air temperature” plotted as anomalies as a function of pressure and time. (below) The anomaly with respect to the REM is plotted for individual reanalyses. Reanalyses included in the REM are indicated with magenta borders. Unavailable data is hatched. The Hunga Tonga–Hunga Ha’apai eruption occured on 20 December 2021.
Absolute values (averaged over: 15S-15N)
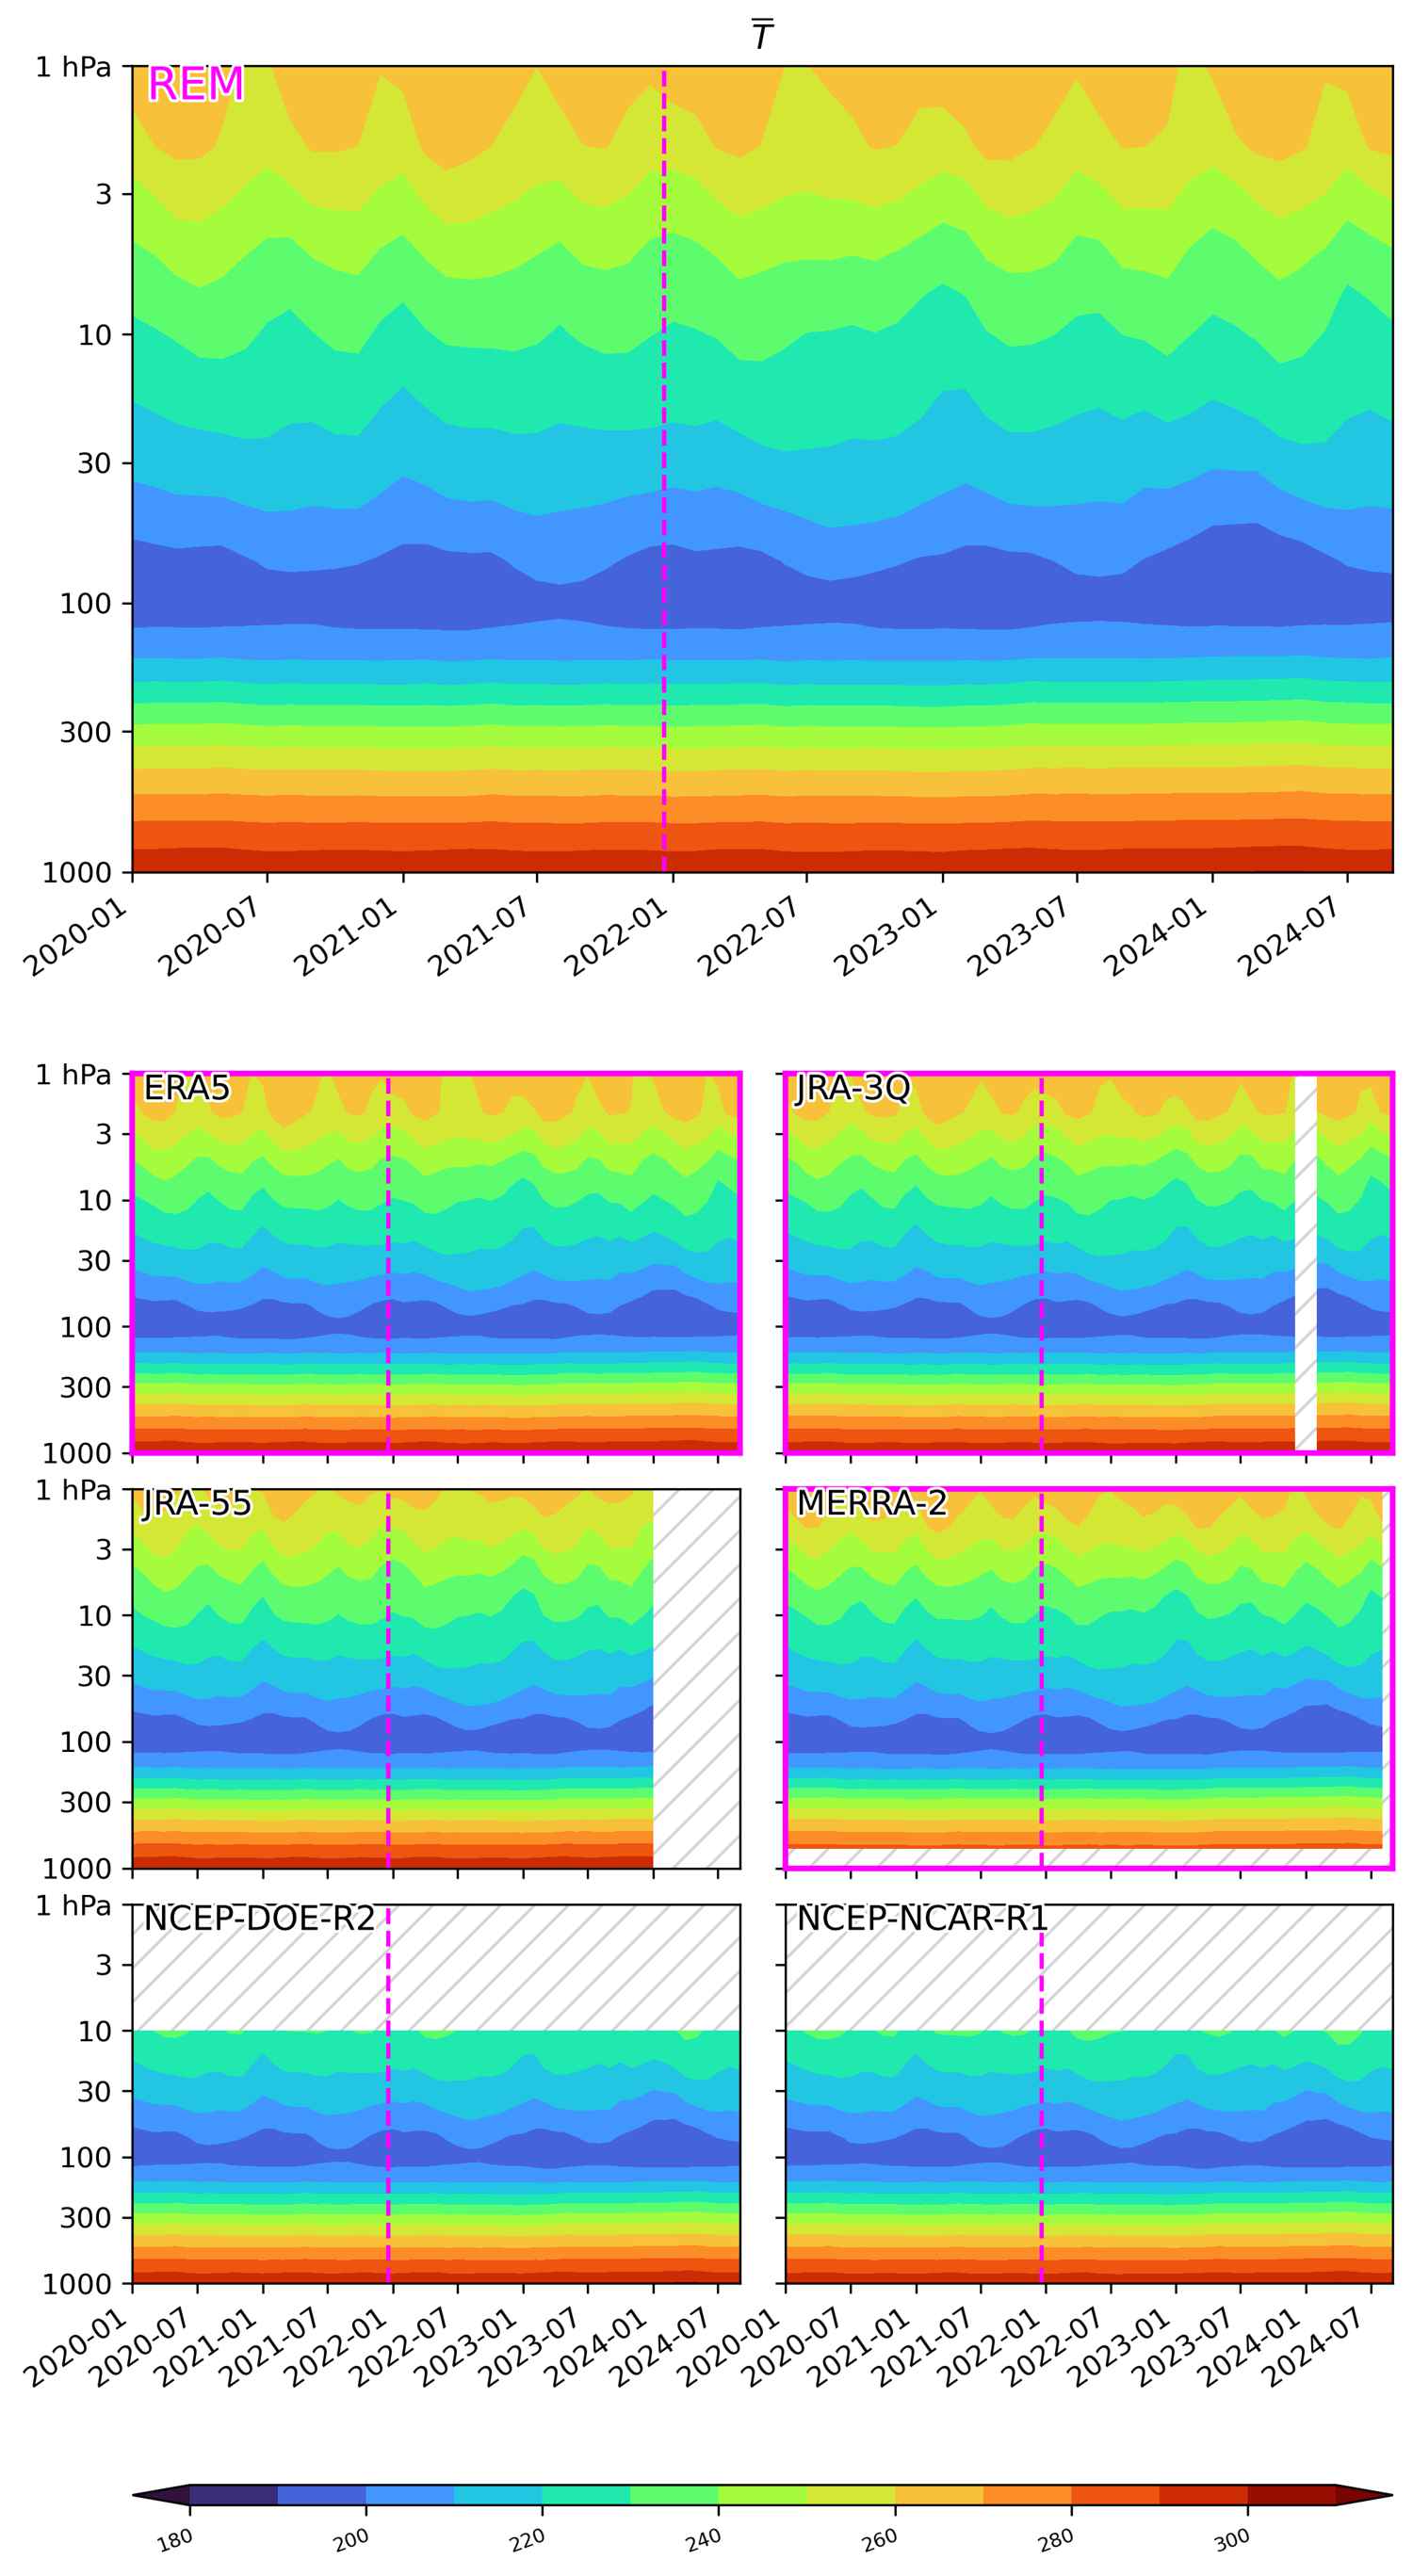
(top) Reanalysis ensemble mean (REM) of “air temperature” plotted as absolute values as a function of pressure and time. (below) Same but plotted for individual reanalyses. Reanalyses included in the REM are indicated with magenta borders. Unavailable data is hatched. The Hunga Tonga–Hunga Ha’apai eruption occured on 20 December 2021.
Anomalies as departure from the 2000-2022 monthly climatology (averaged over: 15S-15N)
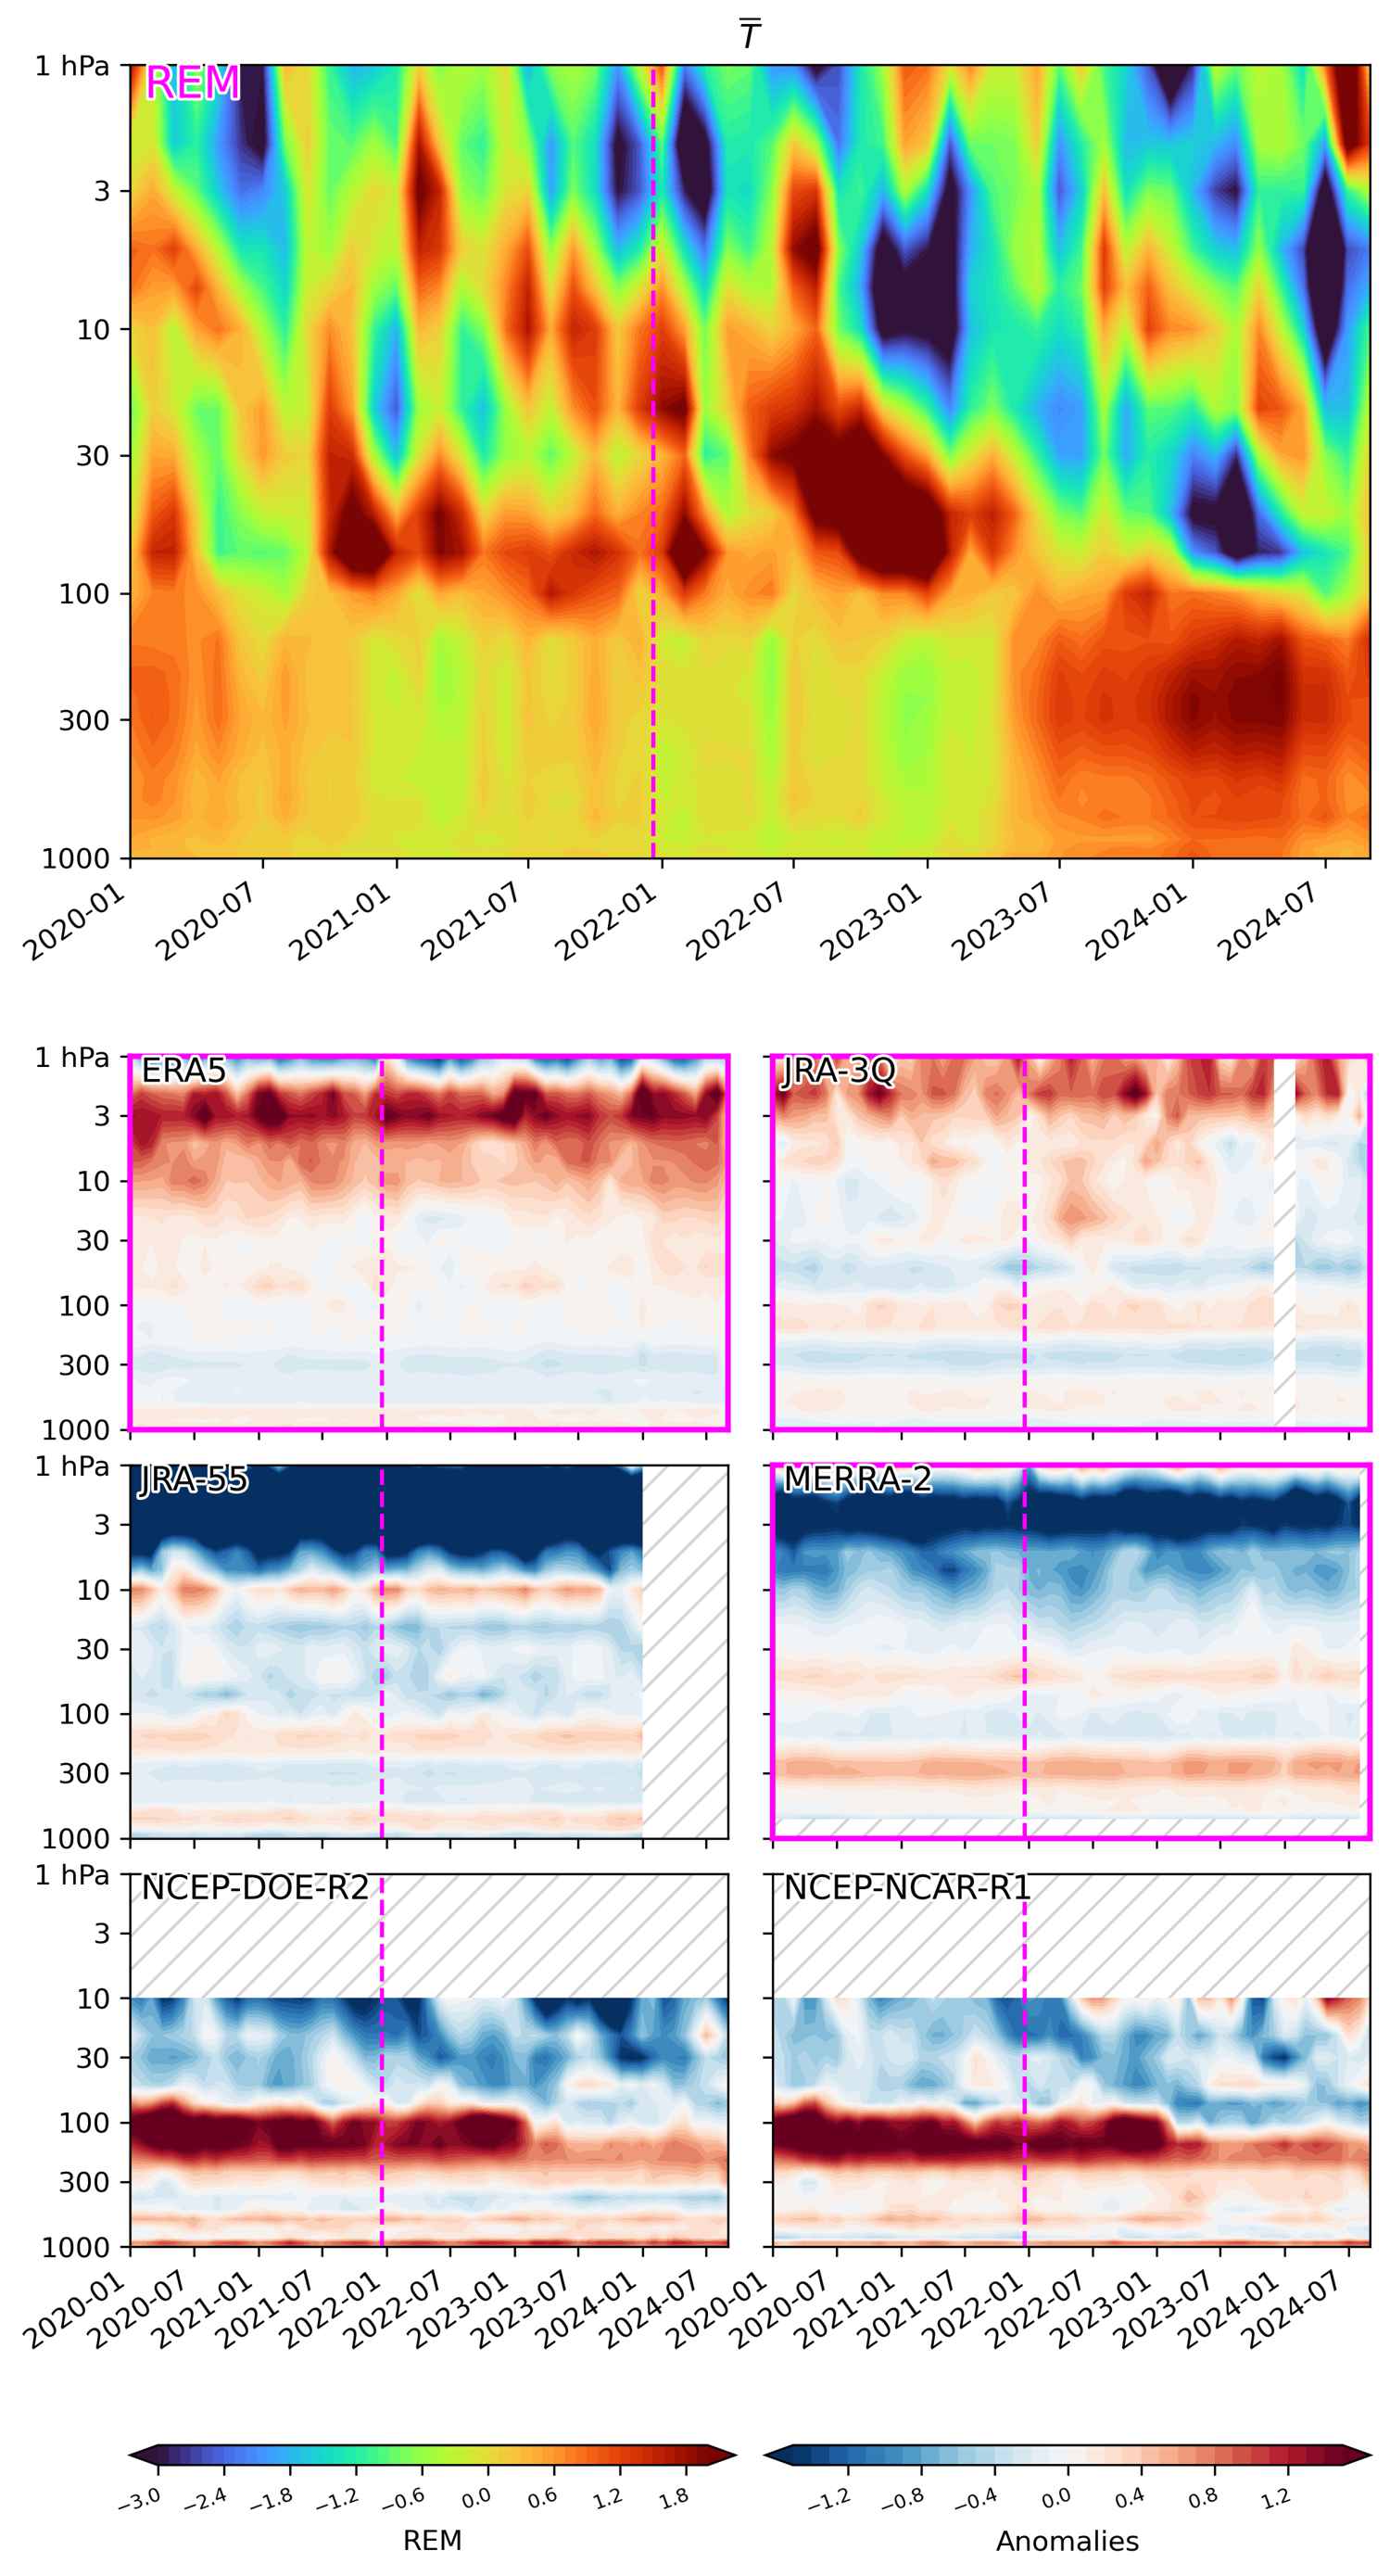
(top) Reanalysis ensemble mean (REM) of “air temperature” plotted as anomalies as a function of pressure and time. (below) The anomaly with respect to the REM is plotted for individual reanalyses. Reanalyses included in the REM are indicated with magenta borders. Unavailable data is hatched. The Hunga Tonga–Hunga Ha’apai eruption occured on 20 December 2021.
Absolute values (averaged over: 45N-89N)
(top) Reanalysis ensemble mean (REM) of “air temperature” plotted as absolute values as a function of pressure and time. (below) Same but plotted for individual reanalyses. Reanalyses included in the REM are indicated with magenta borders. Unavailable data is hatched. The Hunga Tonga–Hunga Ha’apai eruption occured on 20 December 2021.
Anomalies as departure from the 2000-2022 monthly climatology (averaged over: 45N-89N)
(top) Reanalysis ensemble mean (REM) of “air temperature” plotted as anomalies as a function of pressure and time. (below) The anomaly with respect to the REM is plotted for individual reanalyses. Reanalyses included in the REM are indicated with magenta borders. Unavailable data is hatched. The Hunga Tonga–Hunga Ha’apai eruption occured on 20 December 2021.
Absolute values (averaged over: 60S-30S)
(top) Reanalysis ensemble mean (REM) of “air temperature” plotted as absolute values as a function of pressure and time. (below) Same but plotted for individual reanalyses. Reanalyses included in the REM are indicated with magenta borders. Unavailable data is hatched. The Hunga Tonga–Hunga Ha’apai eruption occured on 20 December 2021.
Anomalies as departure from the 2000-2022 monthly climatology (averaged over: 60S-30S)
(top) Reanalysis ensemble mean (REM) of “air temperature” plotted as anomalies as a function of pressure and time. (below) The anomaly with respect to the REM is plotted for individual reanalyses. Reanalyses included in the REM are indicated with magenta borders. Unavailable data is hatched. The Hunga Tonga–Hunga Ha’apai eruption occured on 20 December 2021.
Absolute values (averaged over: 89S-60S)
(top) Reanalysis ensemble mean (REM) of “air temperature” plotted as absolute values as a function of pressure and time. (below) Same but plotted for individual reanalyses. Reanalyses included in the REM are indicated with magenta borders. Unavailable data is hatched. The Hunga Tonga–Hunga Ha’apai eruption occured on 20 December 2021.
Anomalies as departure from the 2000-2022 monthly climatology (averaged over: 89S-60S)
(top) Reanalysis ensemble mean (REM) of “air temperature” plotted as anomalies as a function of pressure and time. (below) The anomaly with respect to the REM is plotted for individual reanalyses. Reanalyses included in the REM are indicated with magenta borders. Unavailable data is hatched. The Hunga Tonga–Hunga Ha’apai eruption occured on 20 December 2021.
Absolute values (averaged over: 89S-45S)
(top) Reanalysis ensemble mean (REM) of “air temperature” plotted as absolute values as a function of pressure and time. (below) Same but plotted for individual reanalyses. Reanalyses included in the REM are indicated with magenta borders. Unavailable data is hatched. The Hunga Tonga–Hunga Ha’apai eruption occured on 20 December 2021.
Anomalies as departure from the 2000-2022 monthly climatology (averaged over: 89S-45S)
(top) Reanalysis ensemble mean (REM) of “air temperature” plotted as anomalies as a function of pressure and time. (below) The anomaly with respect to the REM is plotted for individual reanalyses. Reanalyses included in the REM are indicated with magenta borders. Unavailable data is hatched. The Hunga Tonga–Hunga Ha’apai eruption occured on 20 December 2021.
Absolute values (averaged over: 15S-15N)
(top) Reanalysis ensemble mean (REM) of “air temperature” plotted as absolute values as a function of pressure and time. (below) Same but plotted for individual reanalyses. Reanalyses included in the REM are indicated with magenta borders. Unavailable data is hatched. The Hunga Tonga–Hunga Ha’apai eruption occured on 20 December 2021.
Anomalies as departure from the 2000-2022 monthly climatology (averaged over: 15S-15N)
(top) Reanalysis ensemble mean (REM) of “air temperature” plotted as anomalies as a function of pressure and time. (below) The anomaly with respect to the REM is plotted for individual reanalyses. Reanalyses included in the REM are indicated with magenta borders. Unavailable data is hatched. The Hunga Tonga–Hunga Ha’apai eruption occured on 20 December 2021.
Absolute values (averaged over: 45N-89N)
(top) Reanalysis ensemble mean (REM) of “air temperature” plotted as absolute values as a function of pressure and time. (below) Same but plotted for individual reanalyses. Reanalyses included in the REM are indicated with magenta borders. Unavailable data is hatched. The Hunga Tonga–Hunga Ha’apai eruption occured on 20 December 2021.
Anomalies as departure from the 2000-2022 monthly climatology (averaged over: 45N-89N)
(top) Reanalysis ensemble mean (REM) of “air temperature” plotted as anomalies as a function of pressure and time. (below) The anomaly with respect to the REM is plotted for individual reanalyses. Reanalyses included in the REM are indicated with magenta borders. Unavailable data is hatched. The Hunga Tonga–Hunga Ha’apai eruption occured on 20 December 2021.
Meridional heat flux
[latex] \overline{v’T’}[/latex]
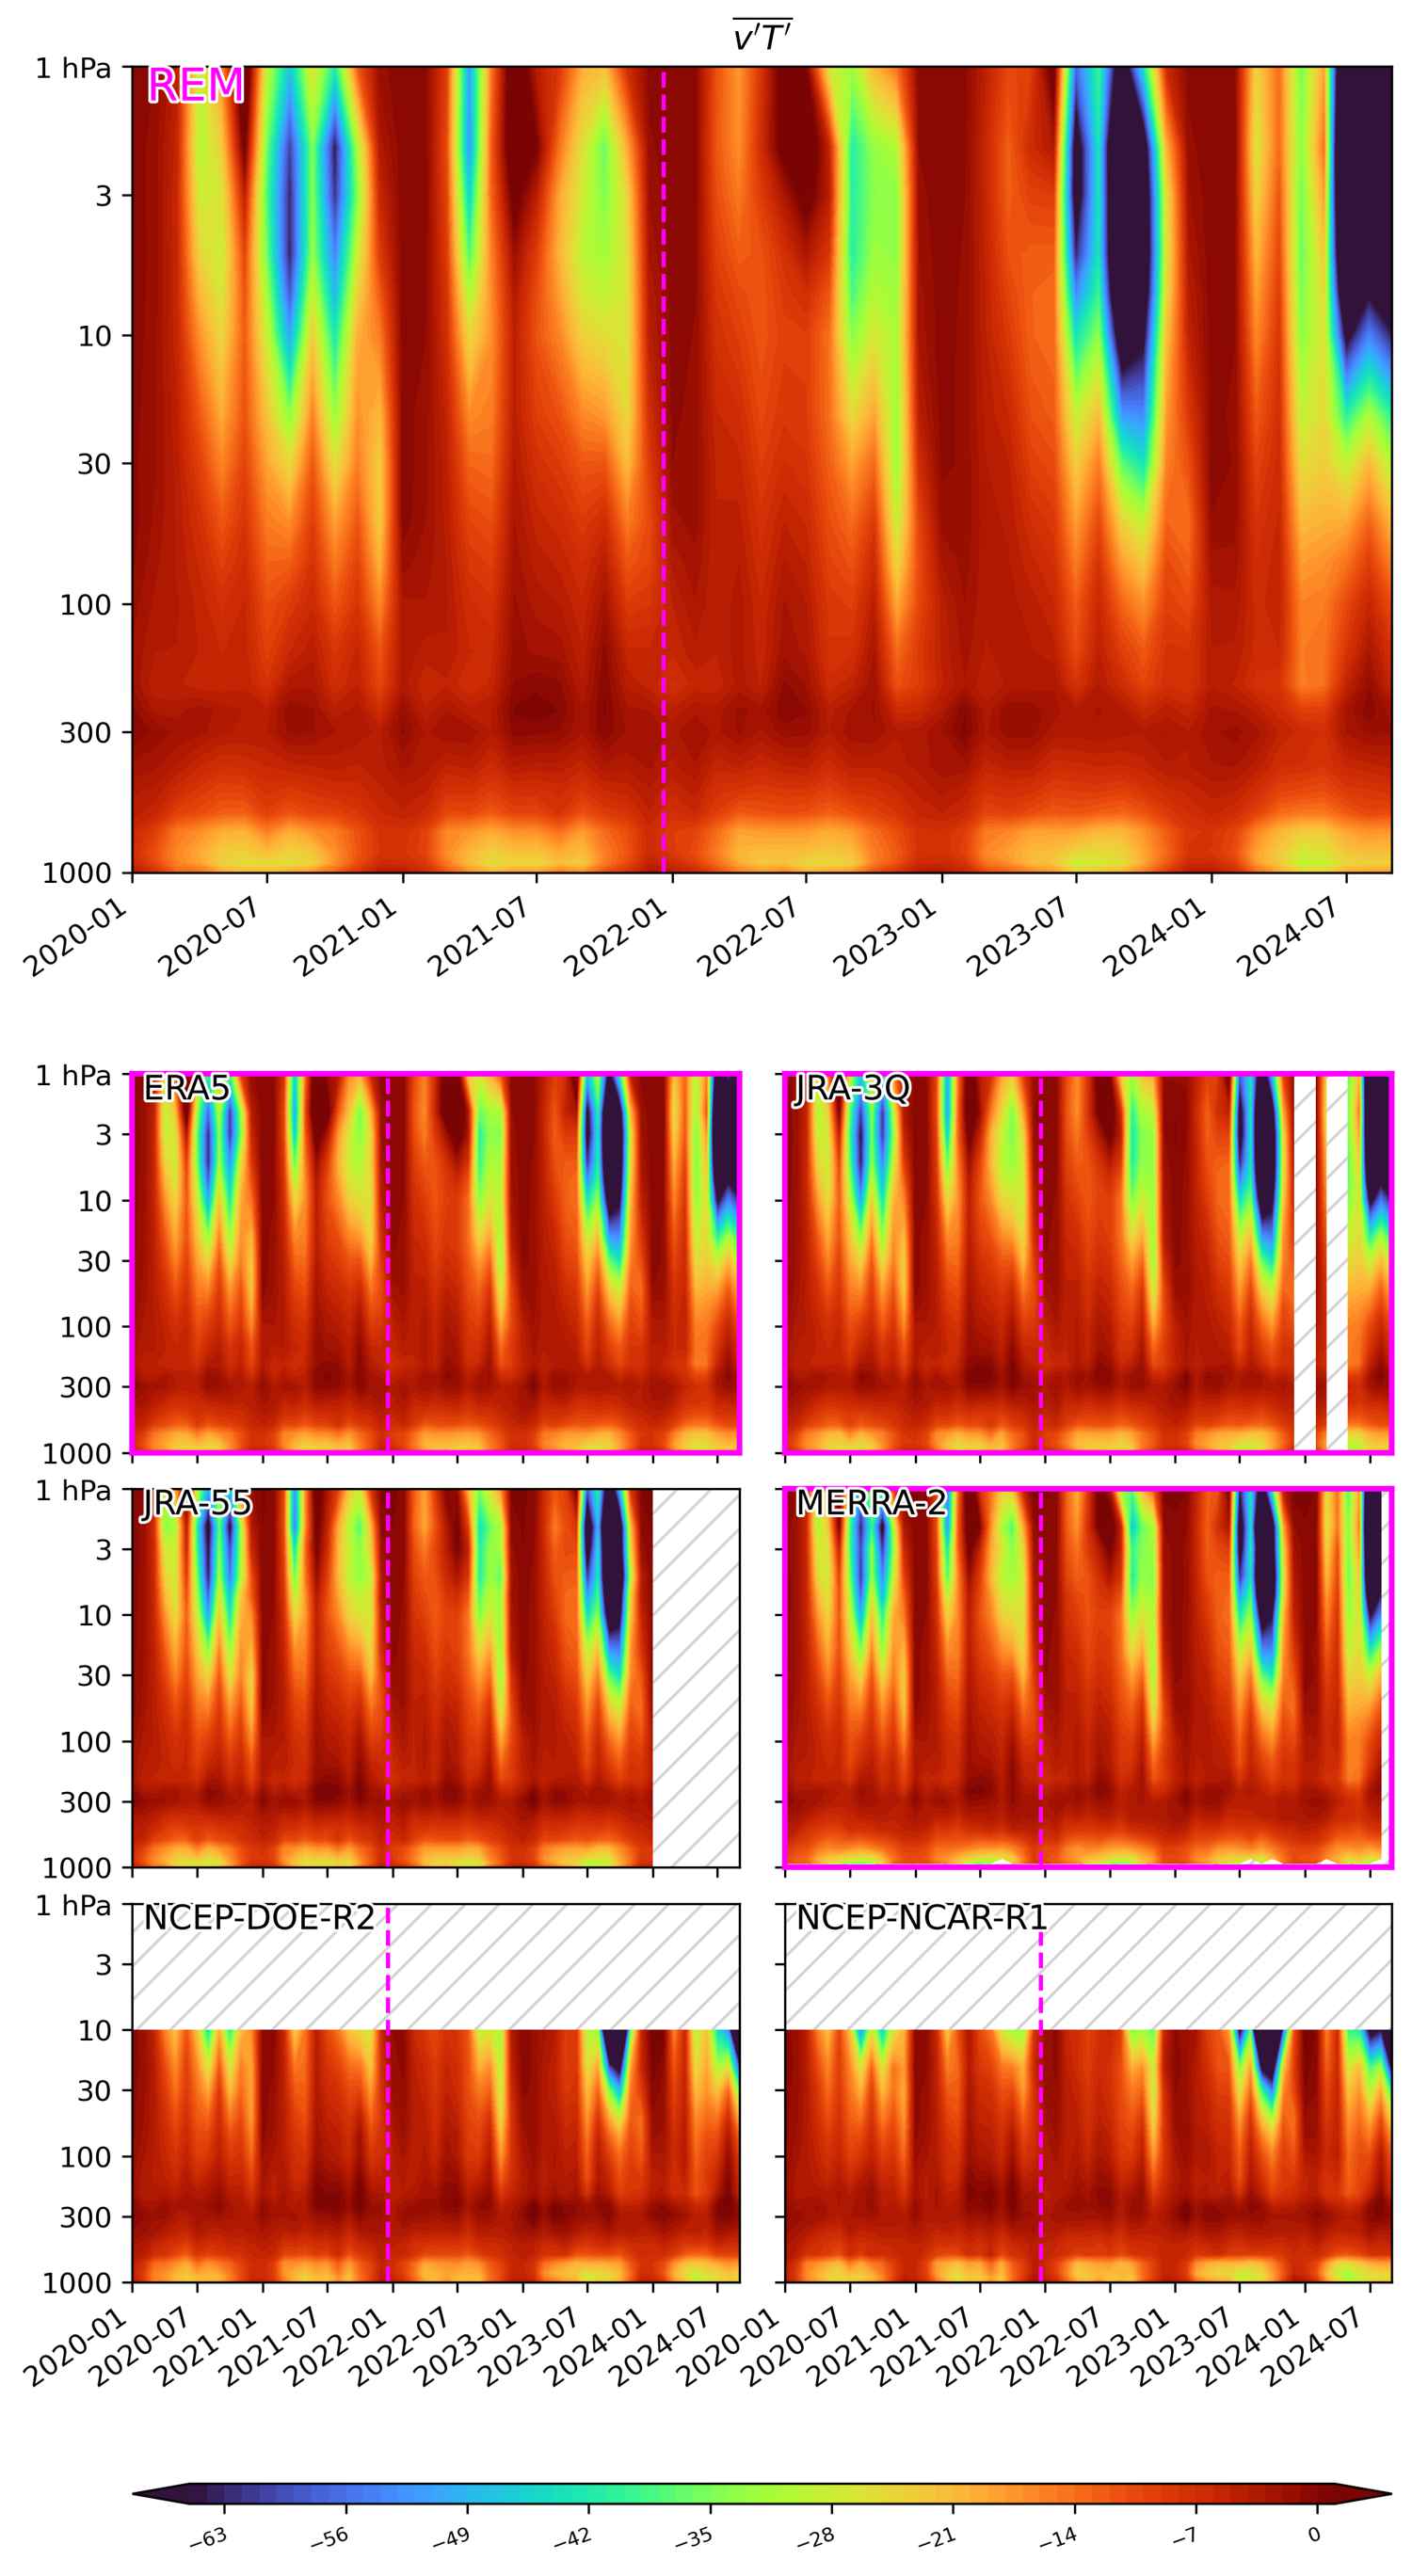
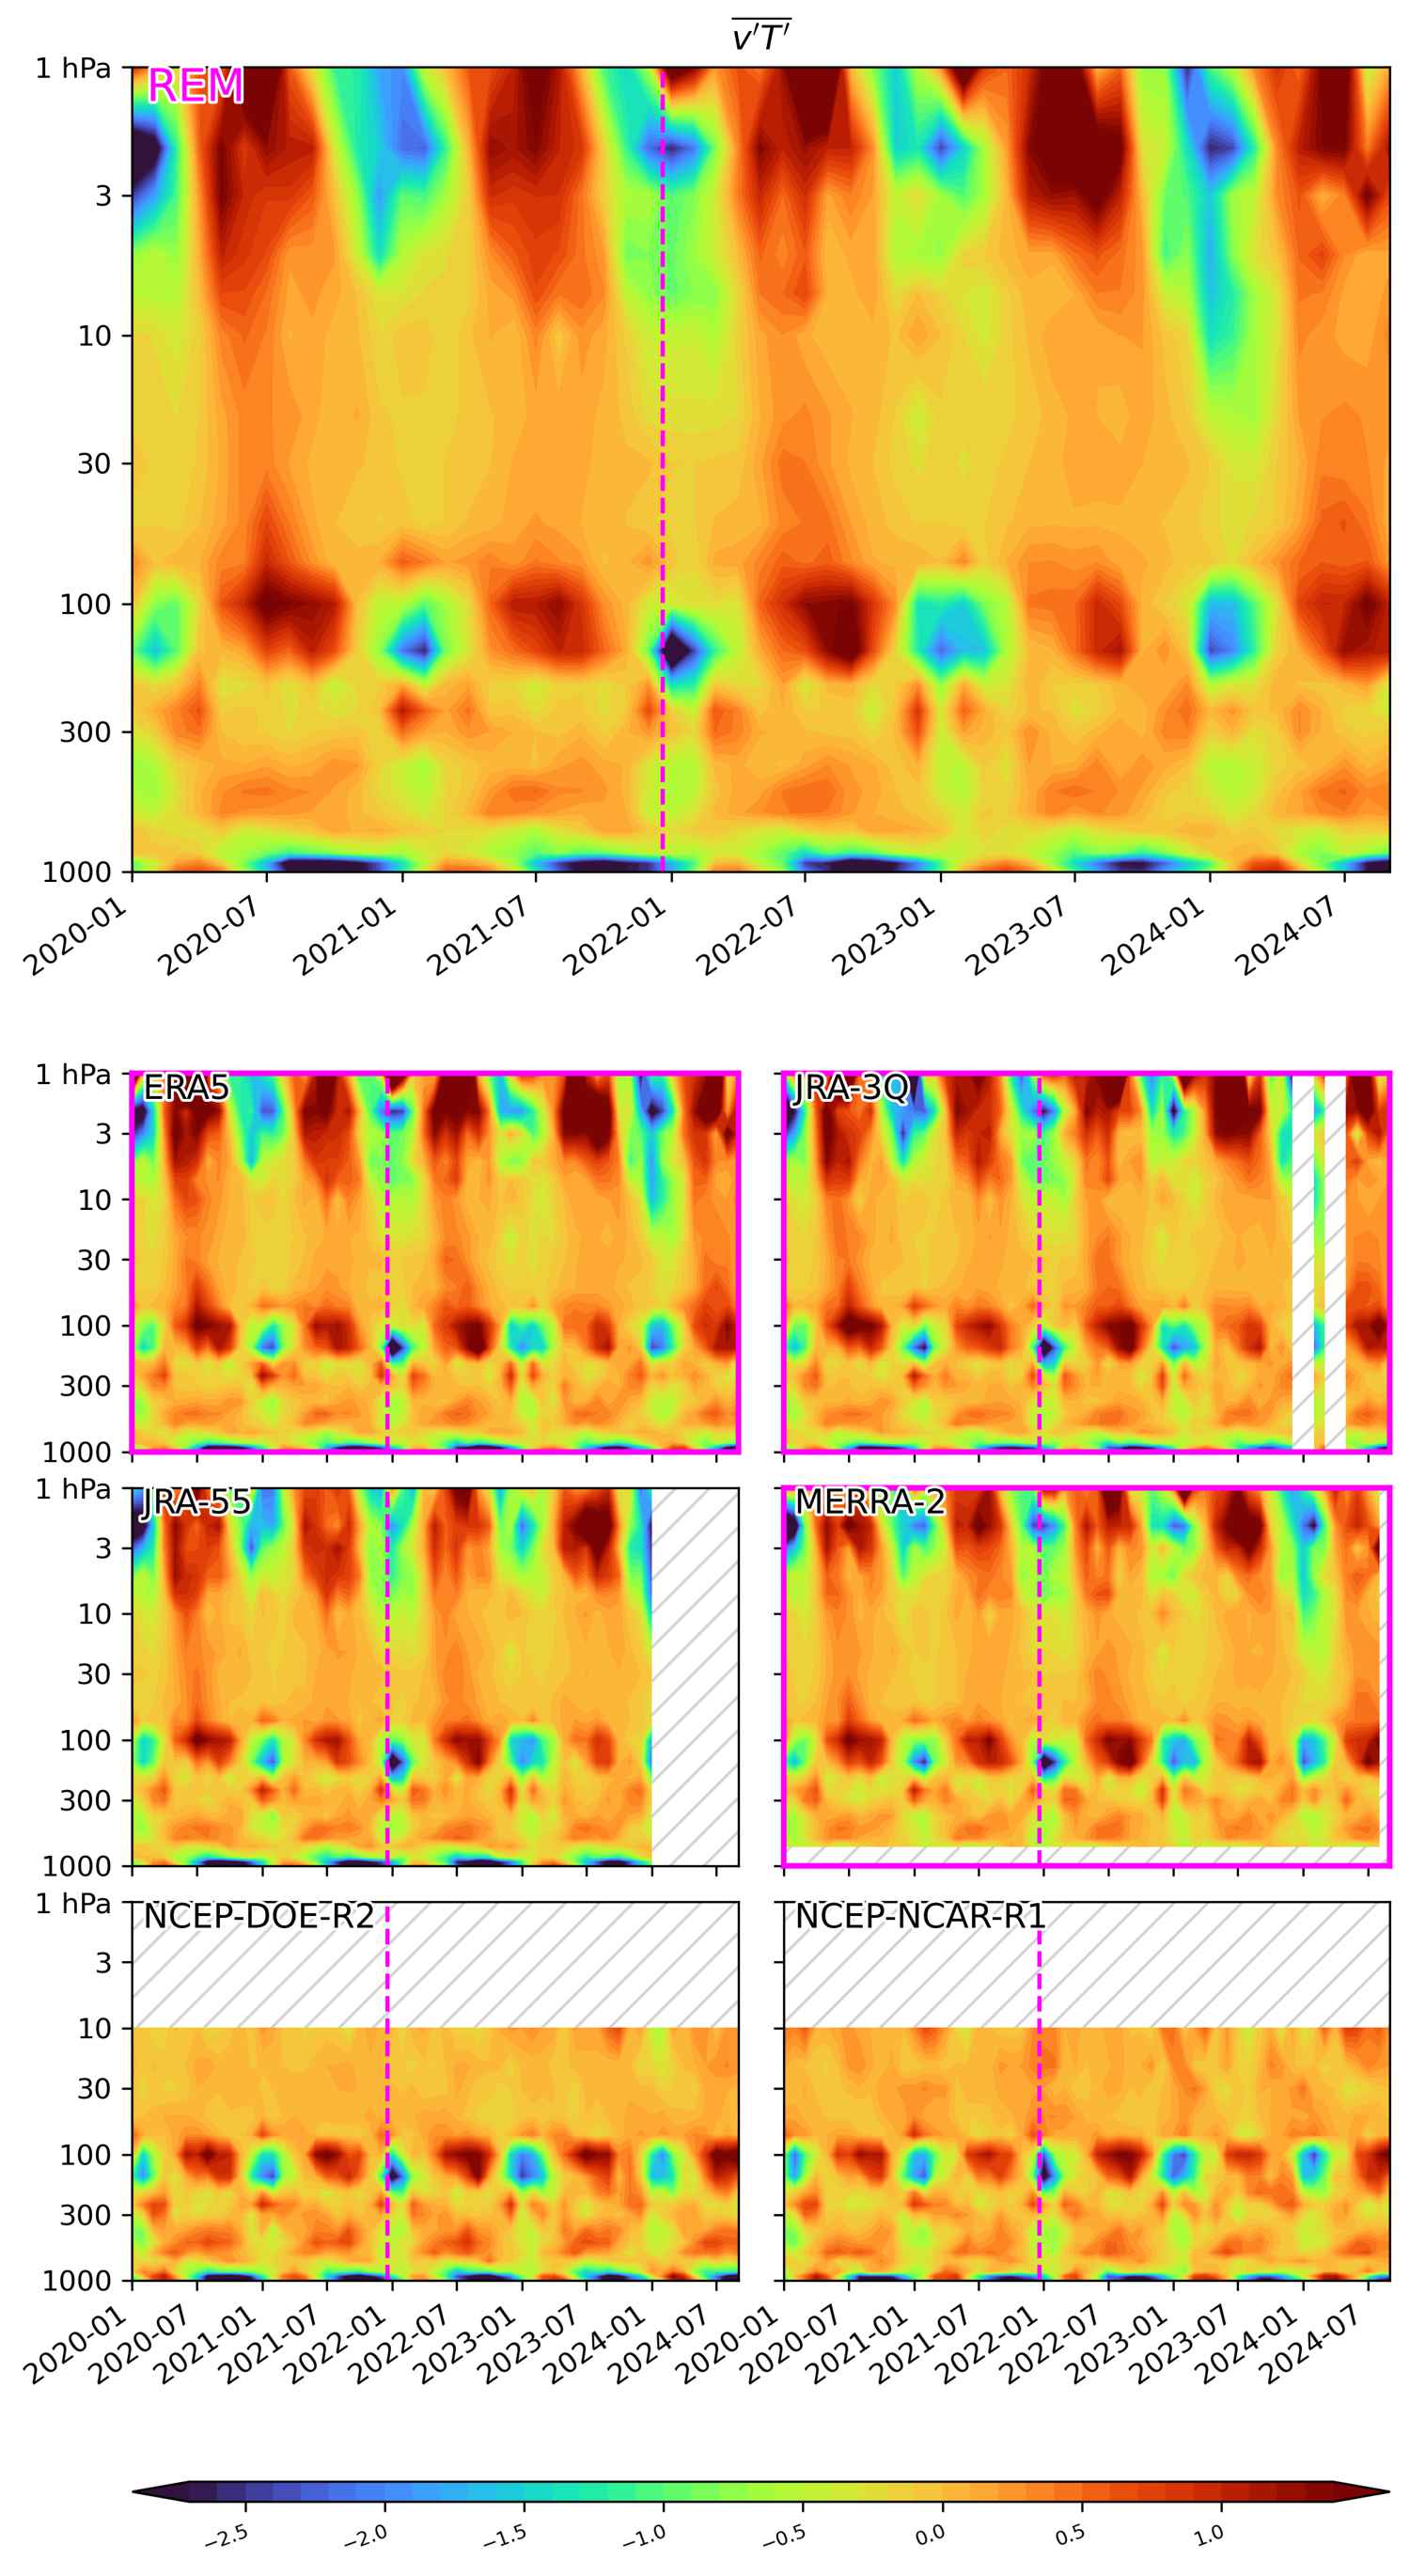
Absolute values (averaged over: 60S-30S)
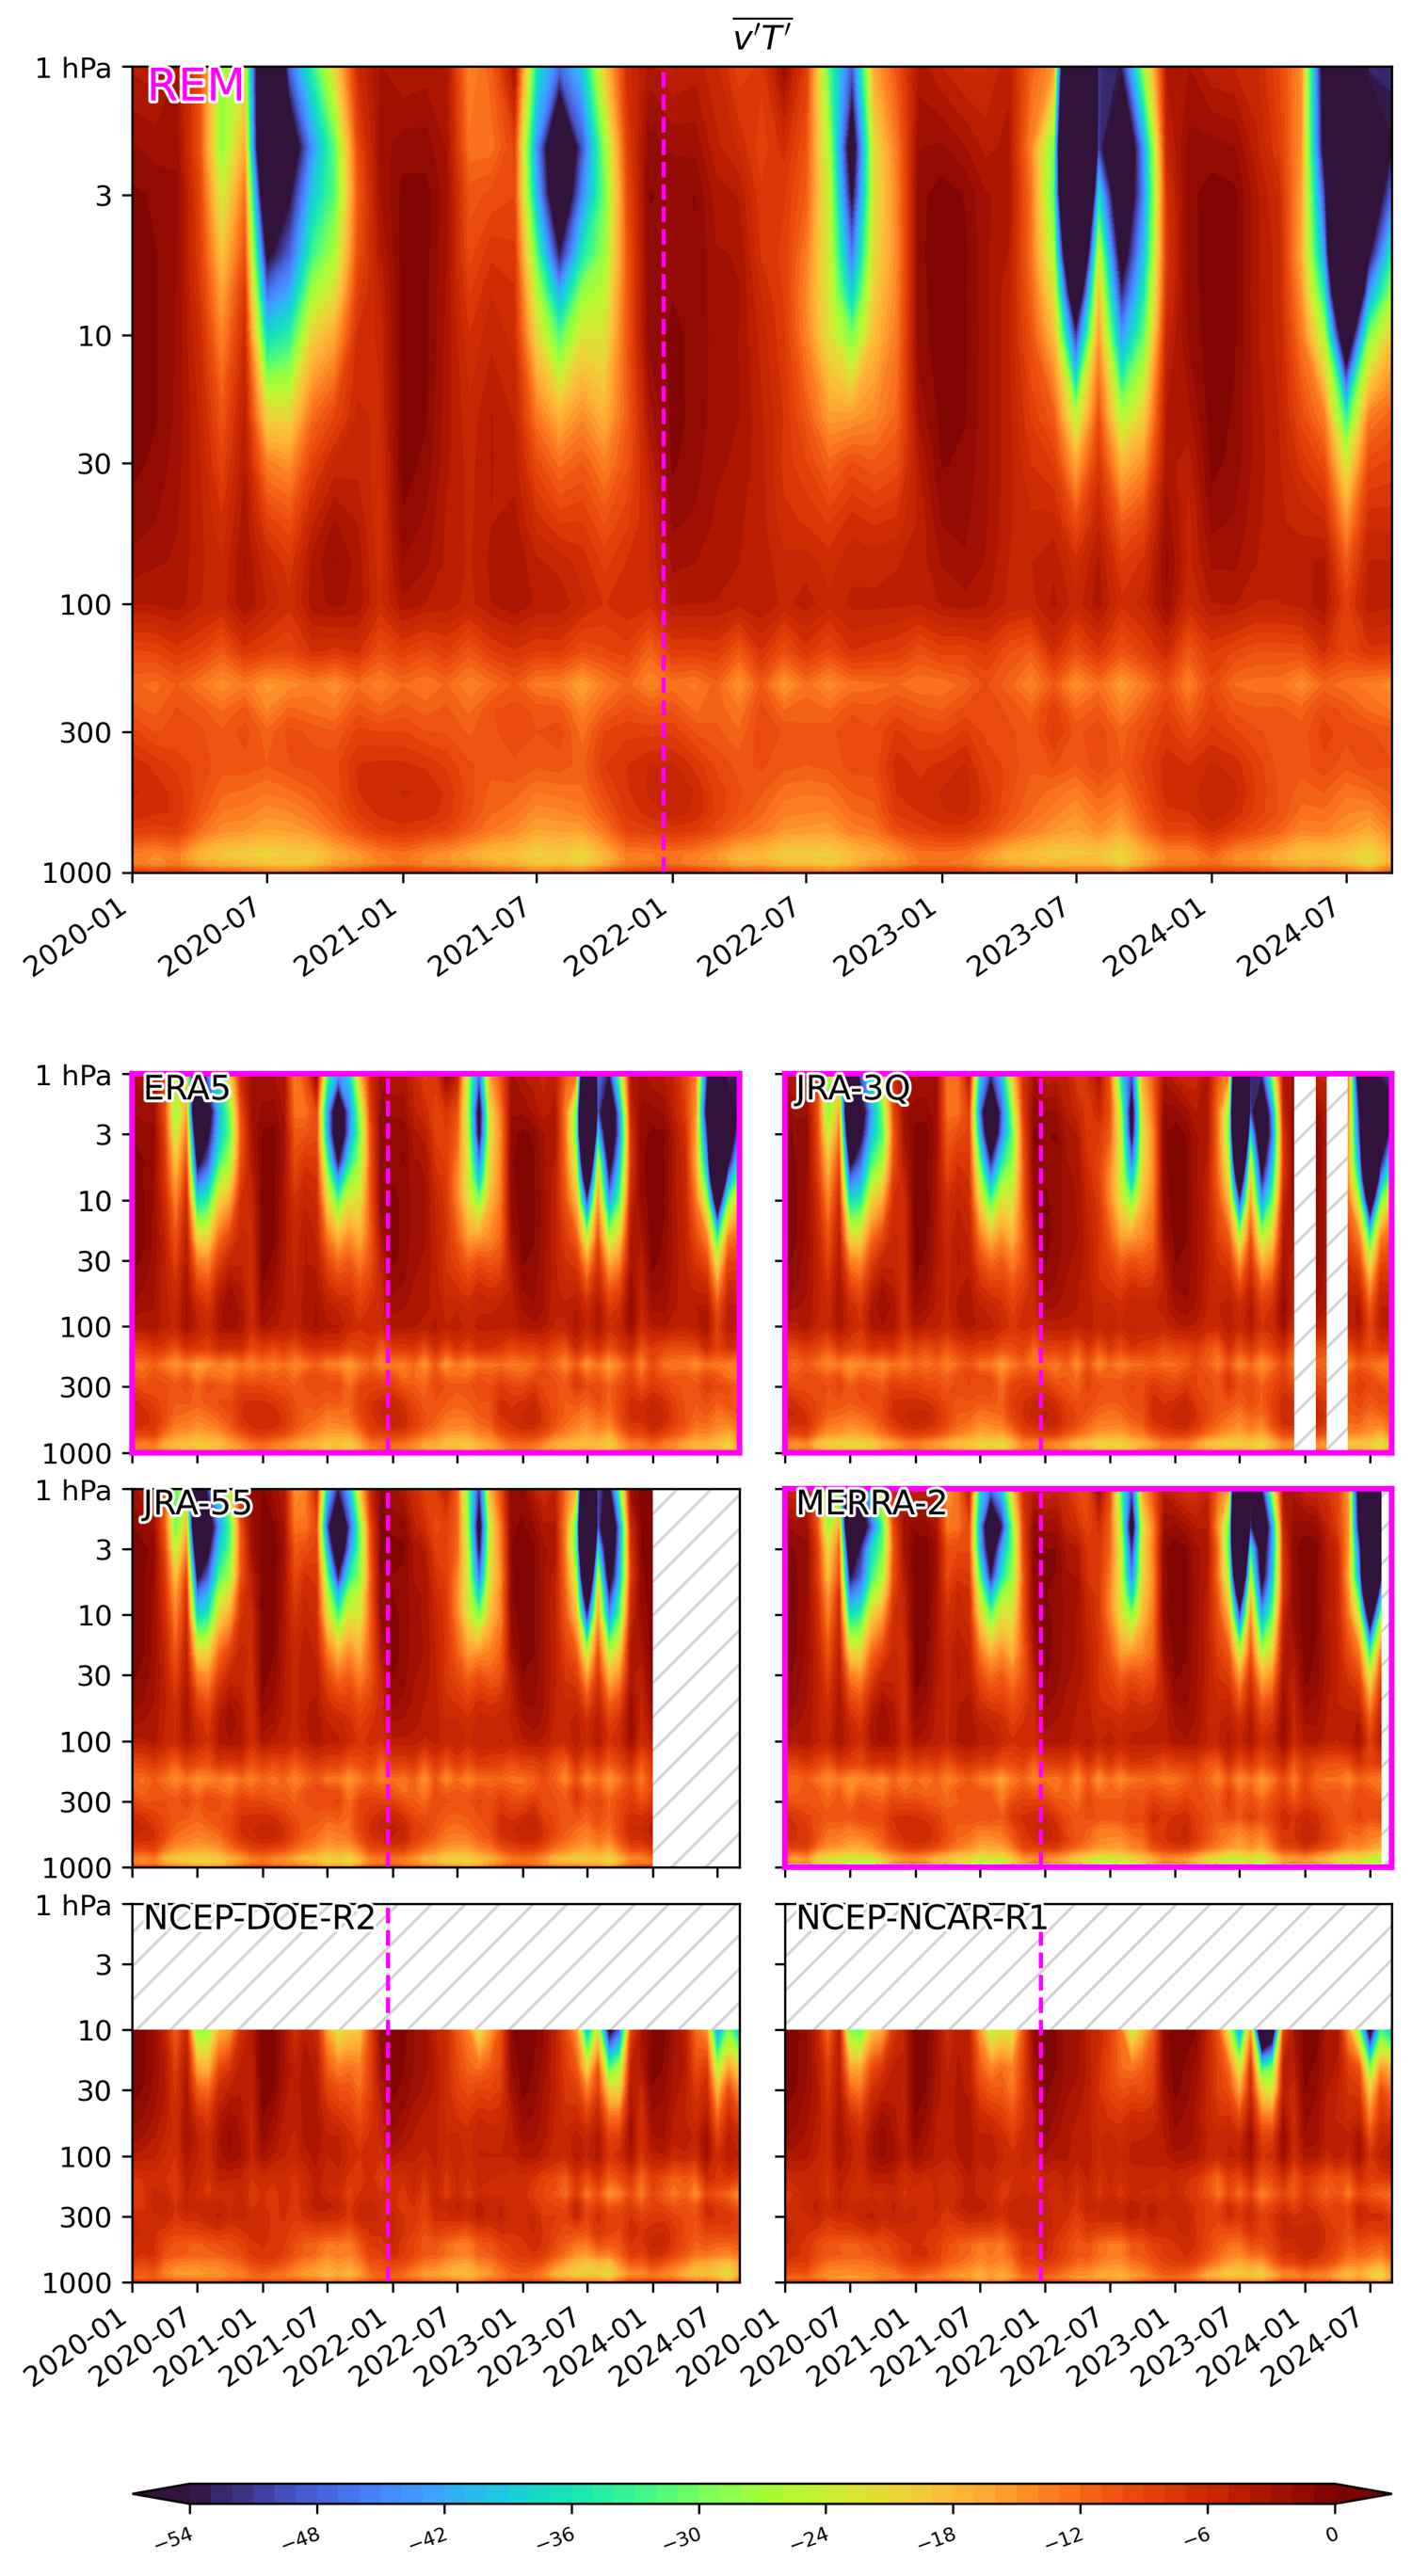
(top) Reanalysis ensemble mean (REM) of “meridional heat flux” plotted as absolute values as a function of pressure and time. (below) Same but plotted for individual reanalyses. Reanalyses included in the REM are indicated with magenta borders. Unavailable data is hatched. The Hunga Tonga–Hunga Ha’apai eruption occured on 20 December 2021.
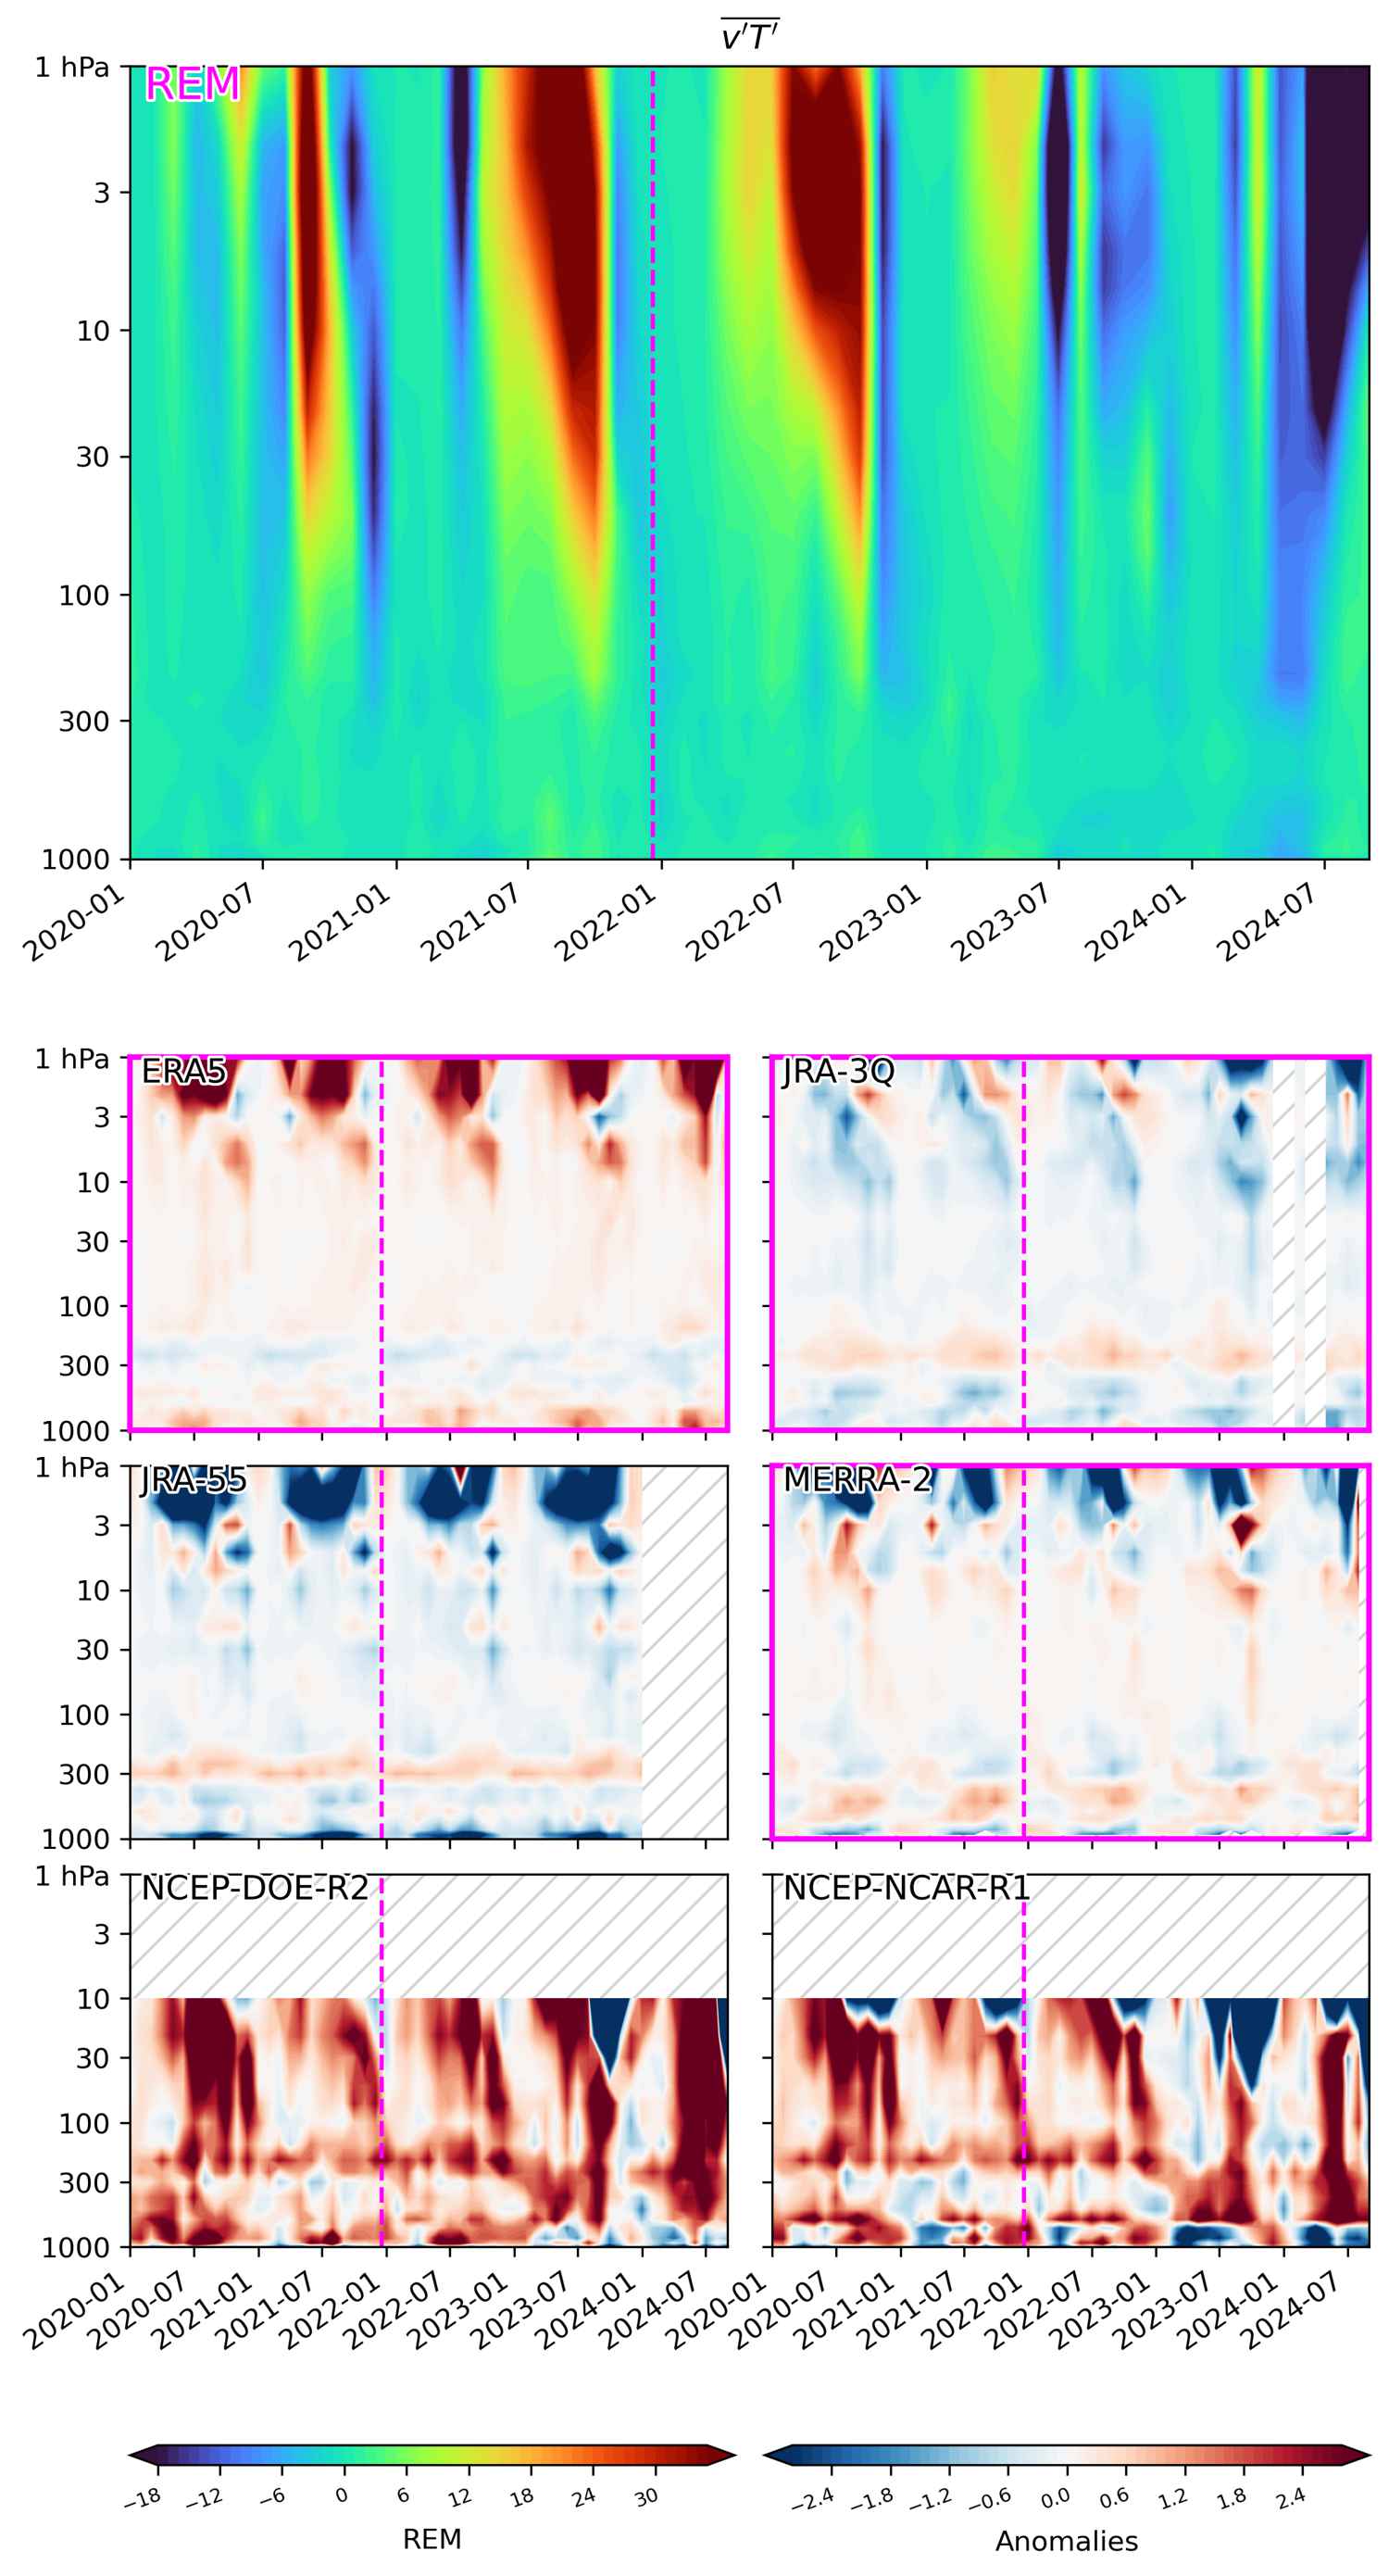
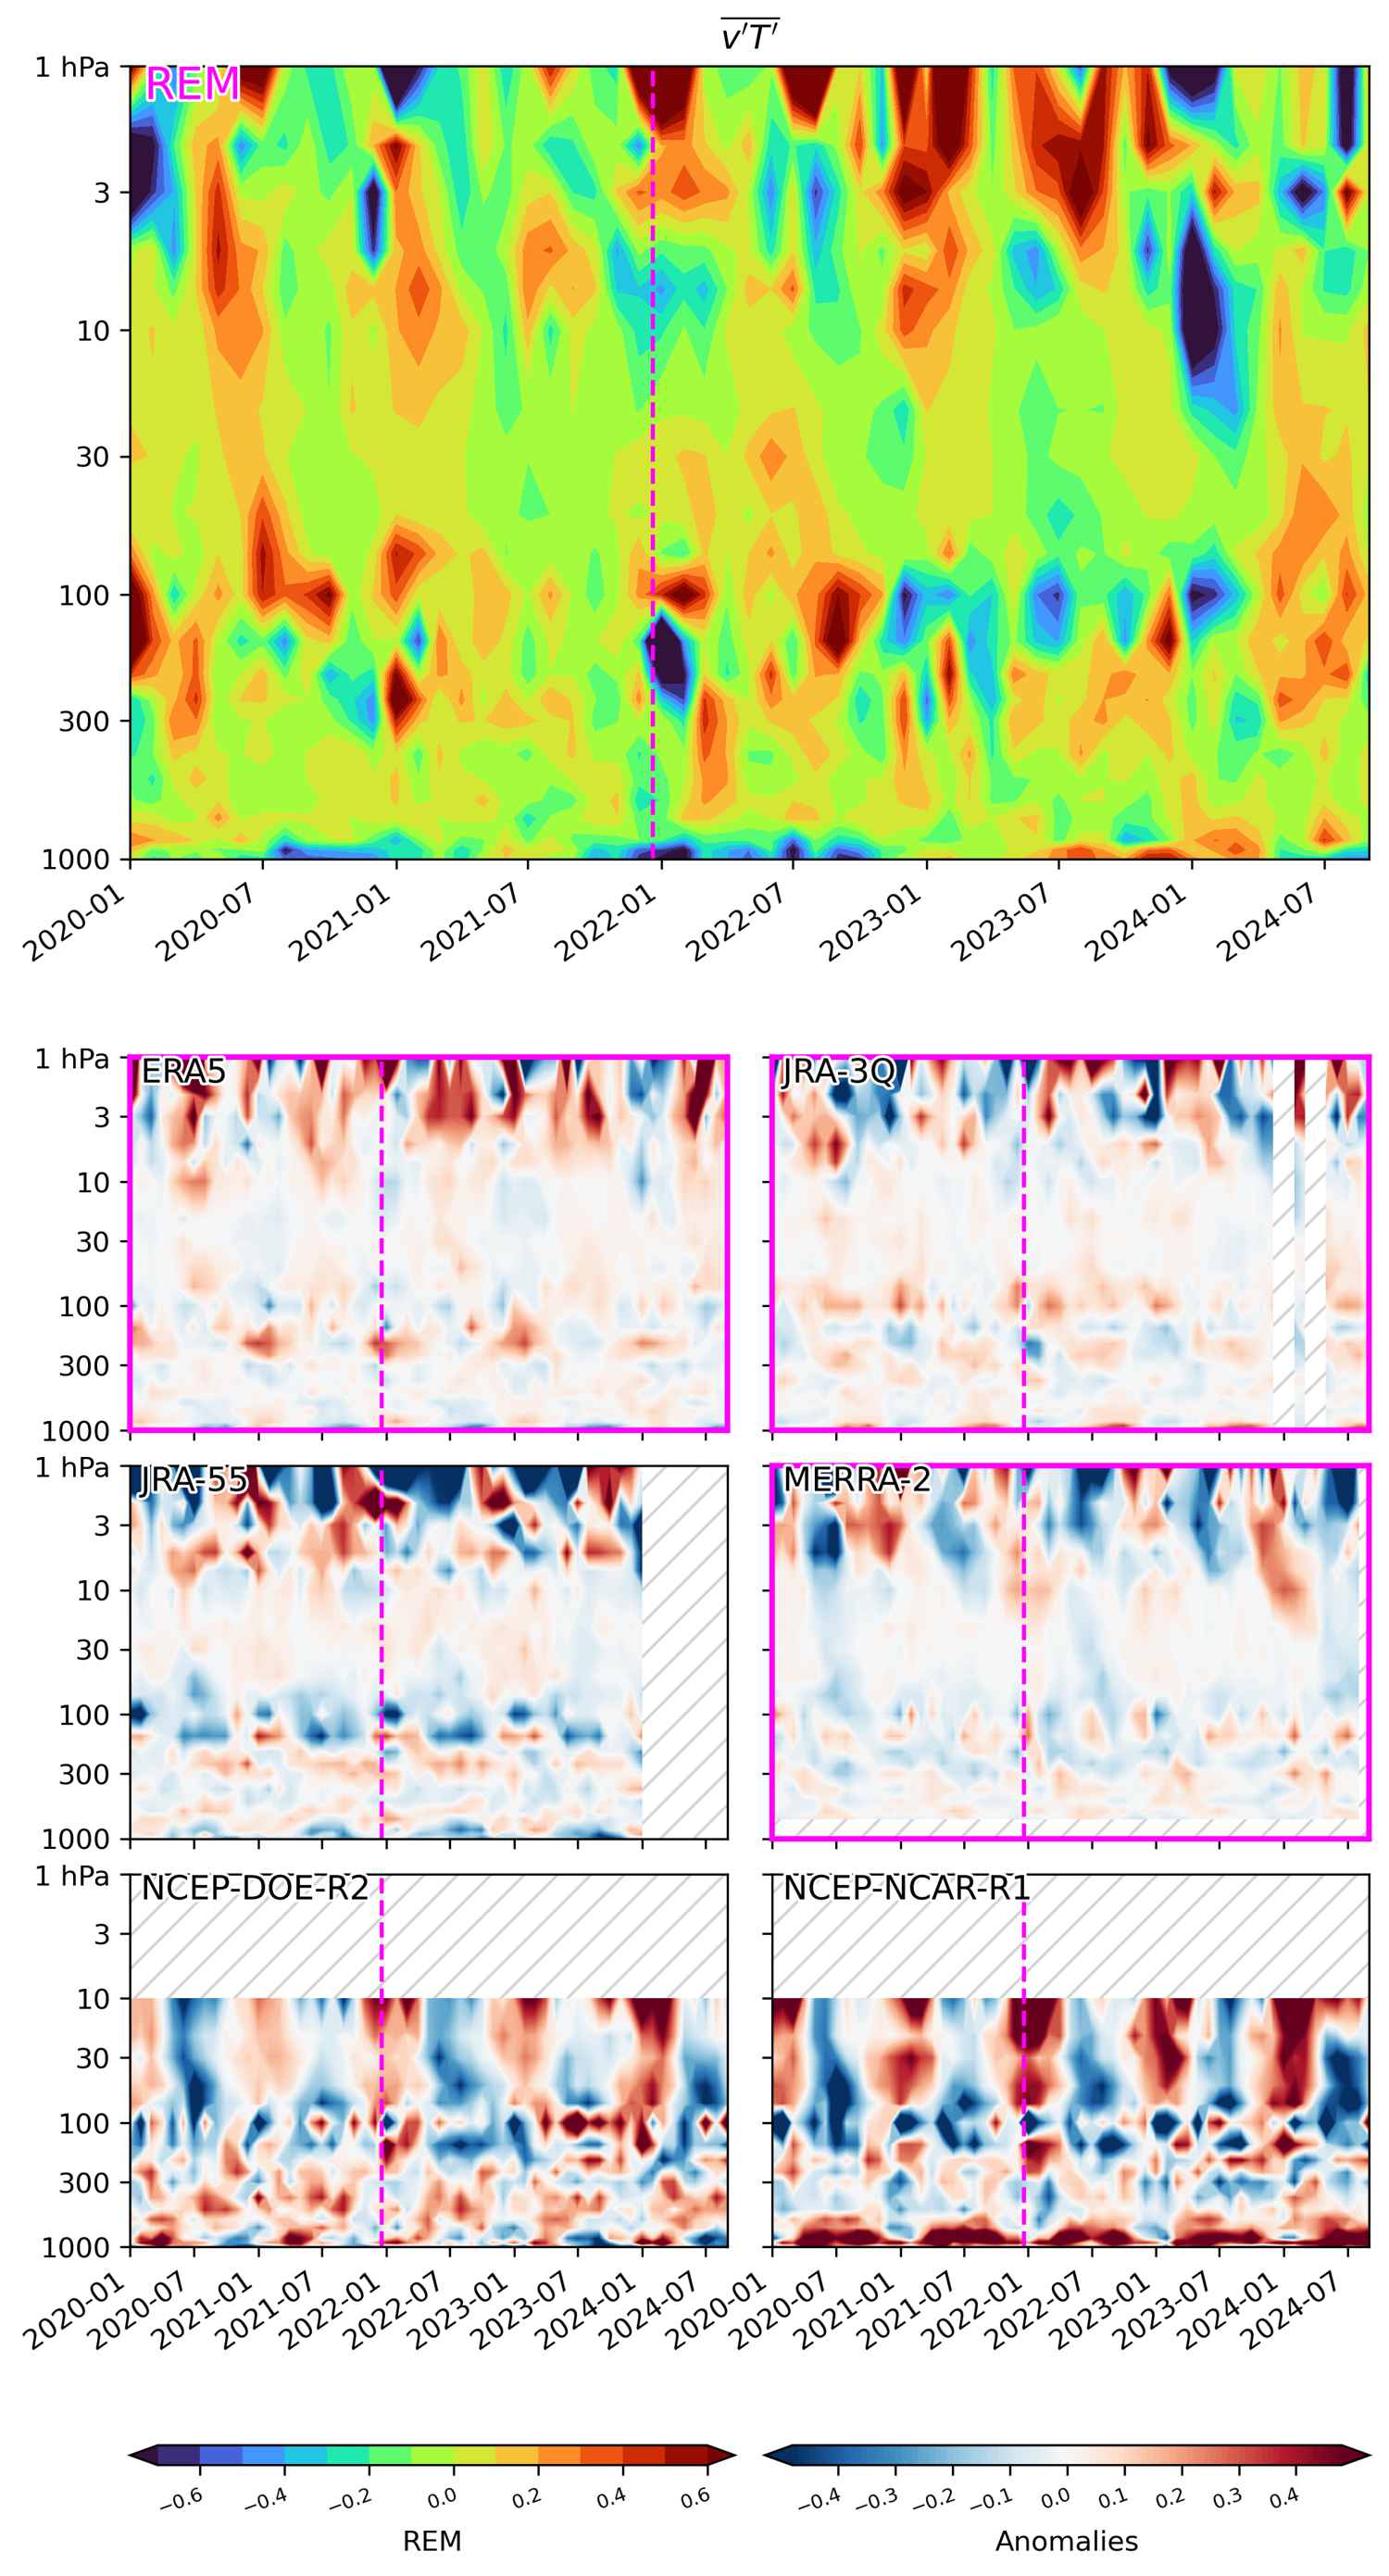
Anomalies as departure from the 2000-2022 monthly climatology (averaged over: 60S-30S)
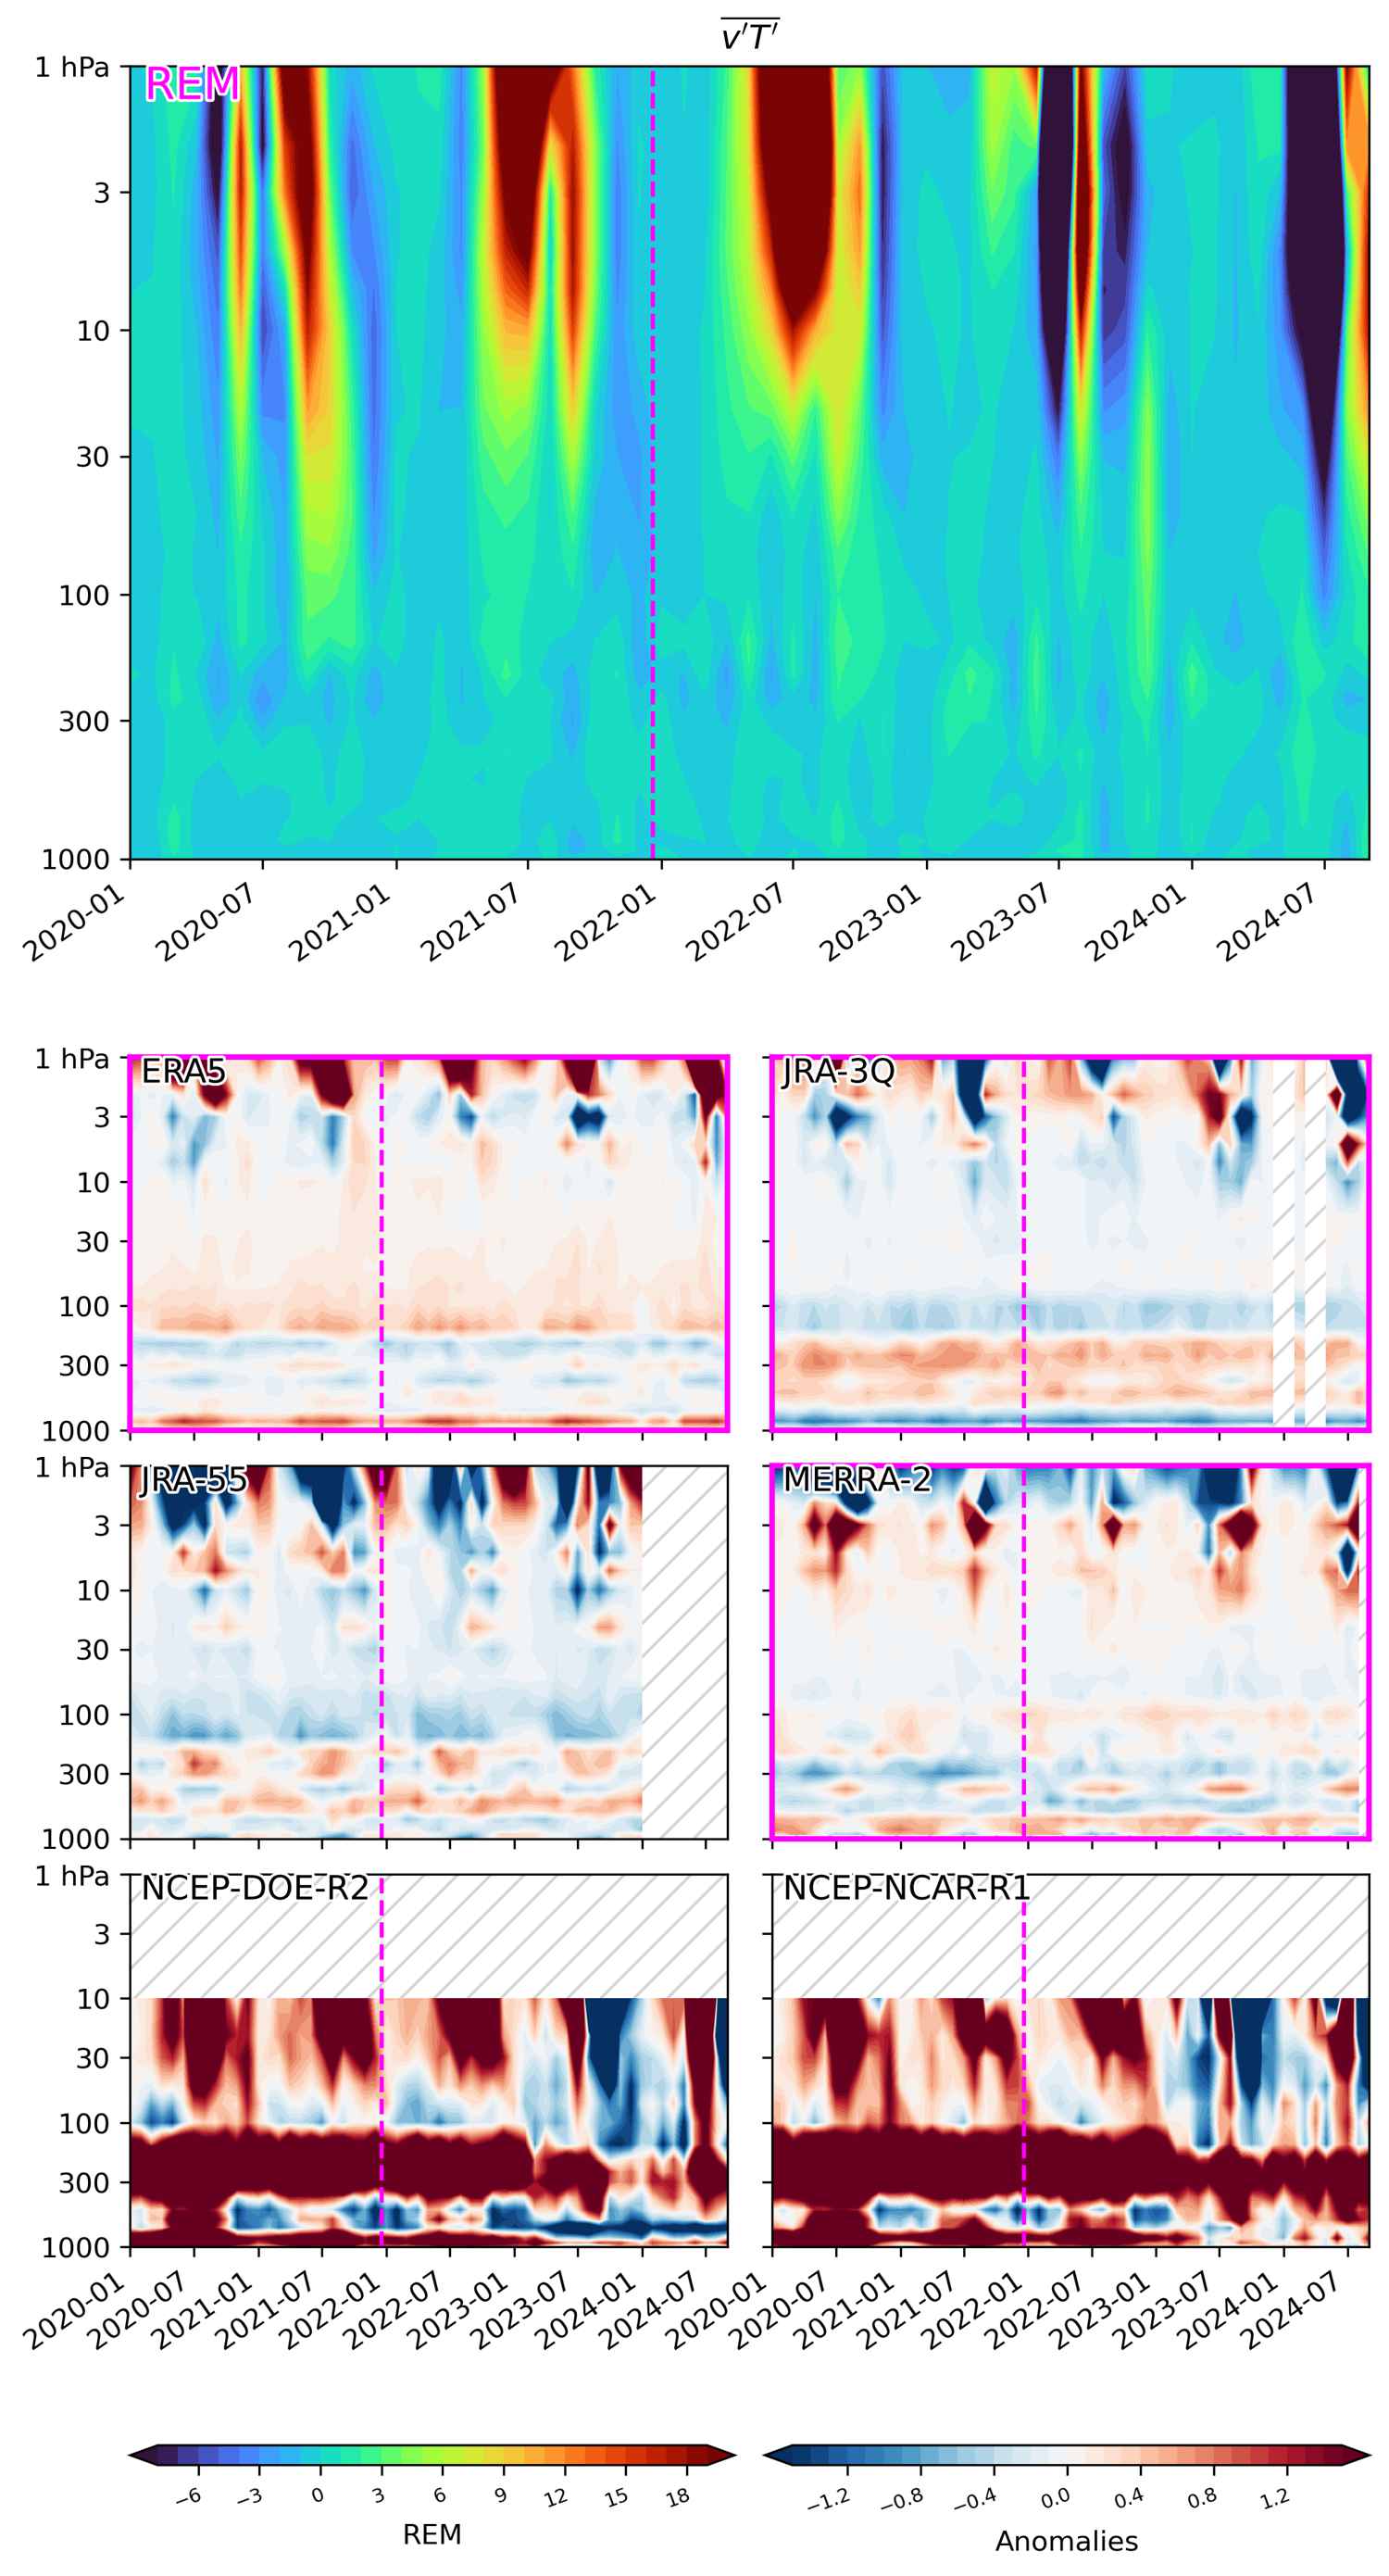
(top) Reanalysis ensemble mean (REM) of “meridional heat flux” plotted as anomalies as a function of pressure and time. (below) The anomaly with respect to the REM is plotted for individual reanalyses. Reanalyses included in the REM are indicated with magenta borders. Unavailable data is hatched. The Hunga Tonga–Hunga Ha’apai eruption occured on 20 December 2021.
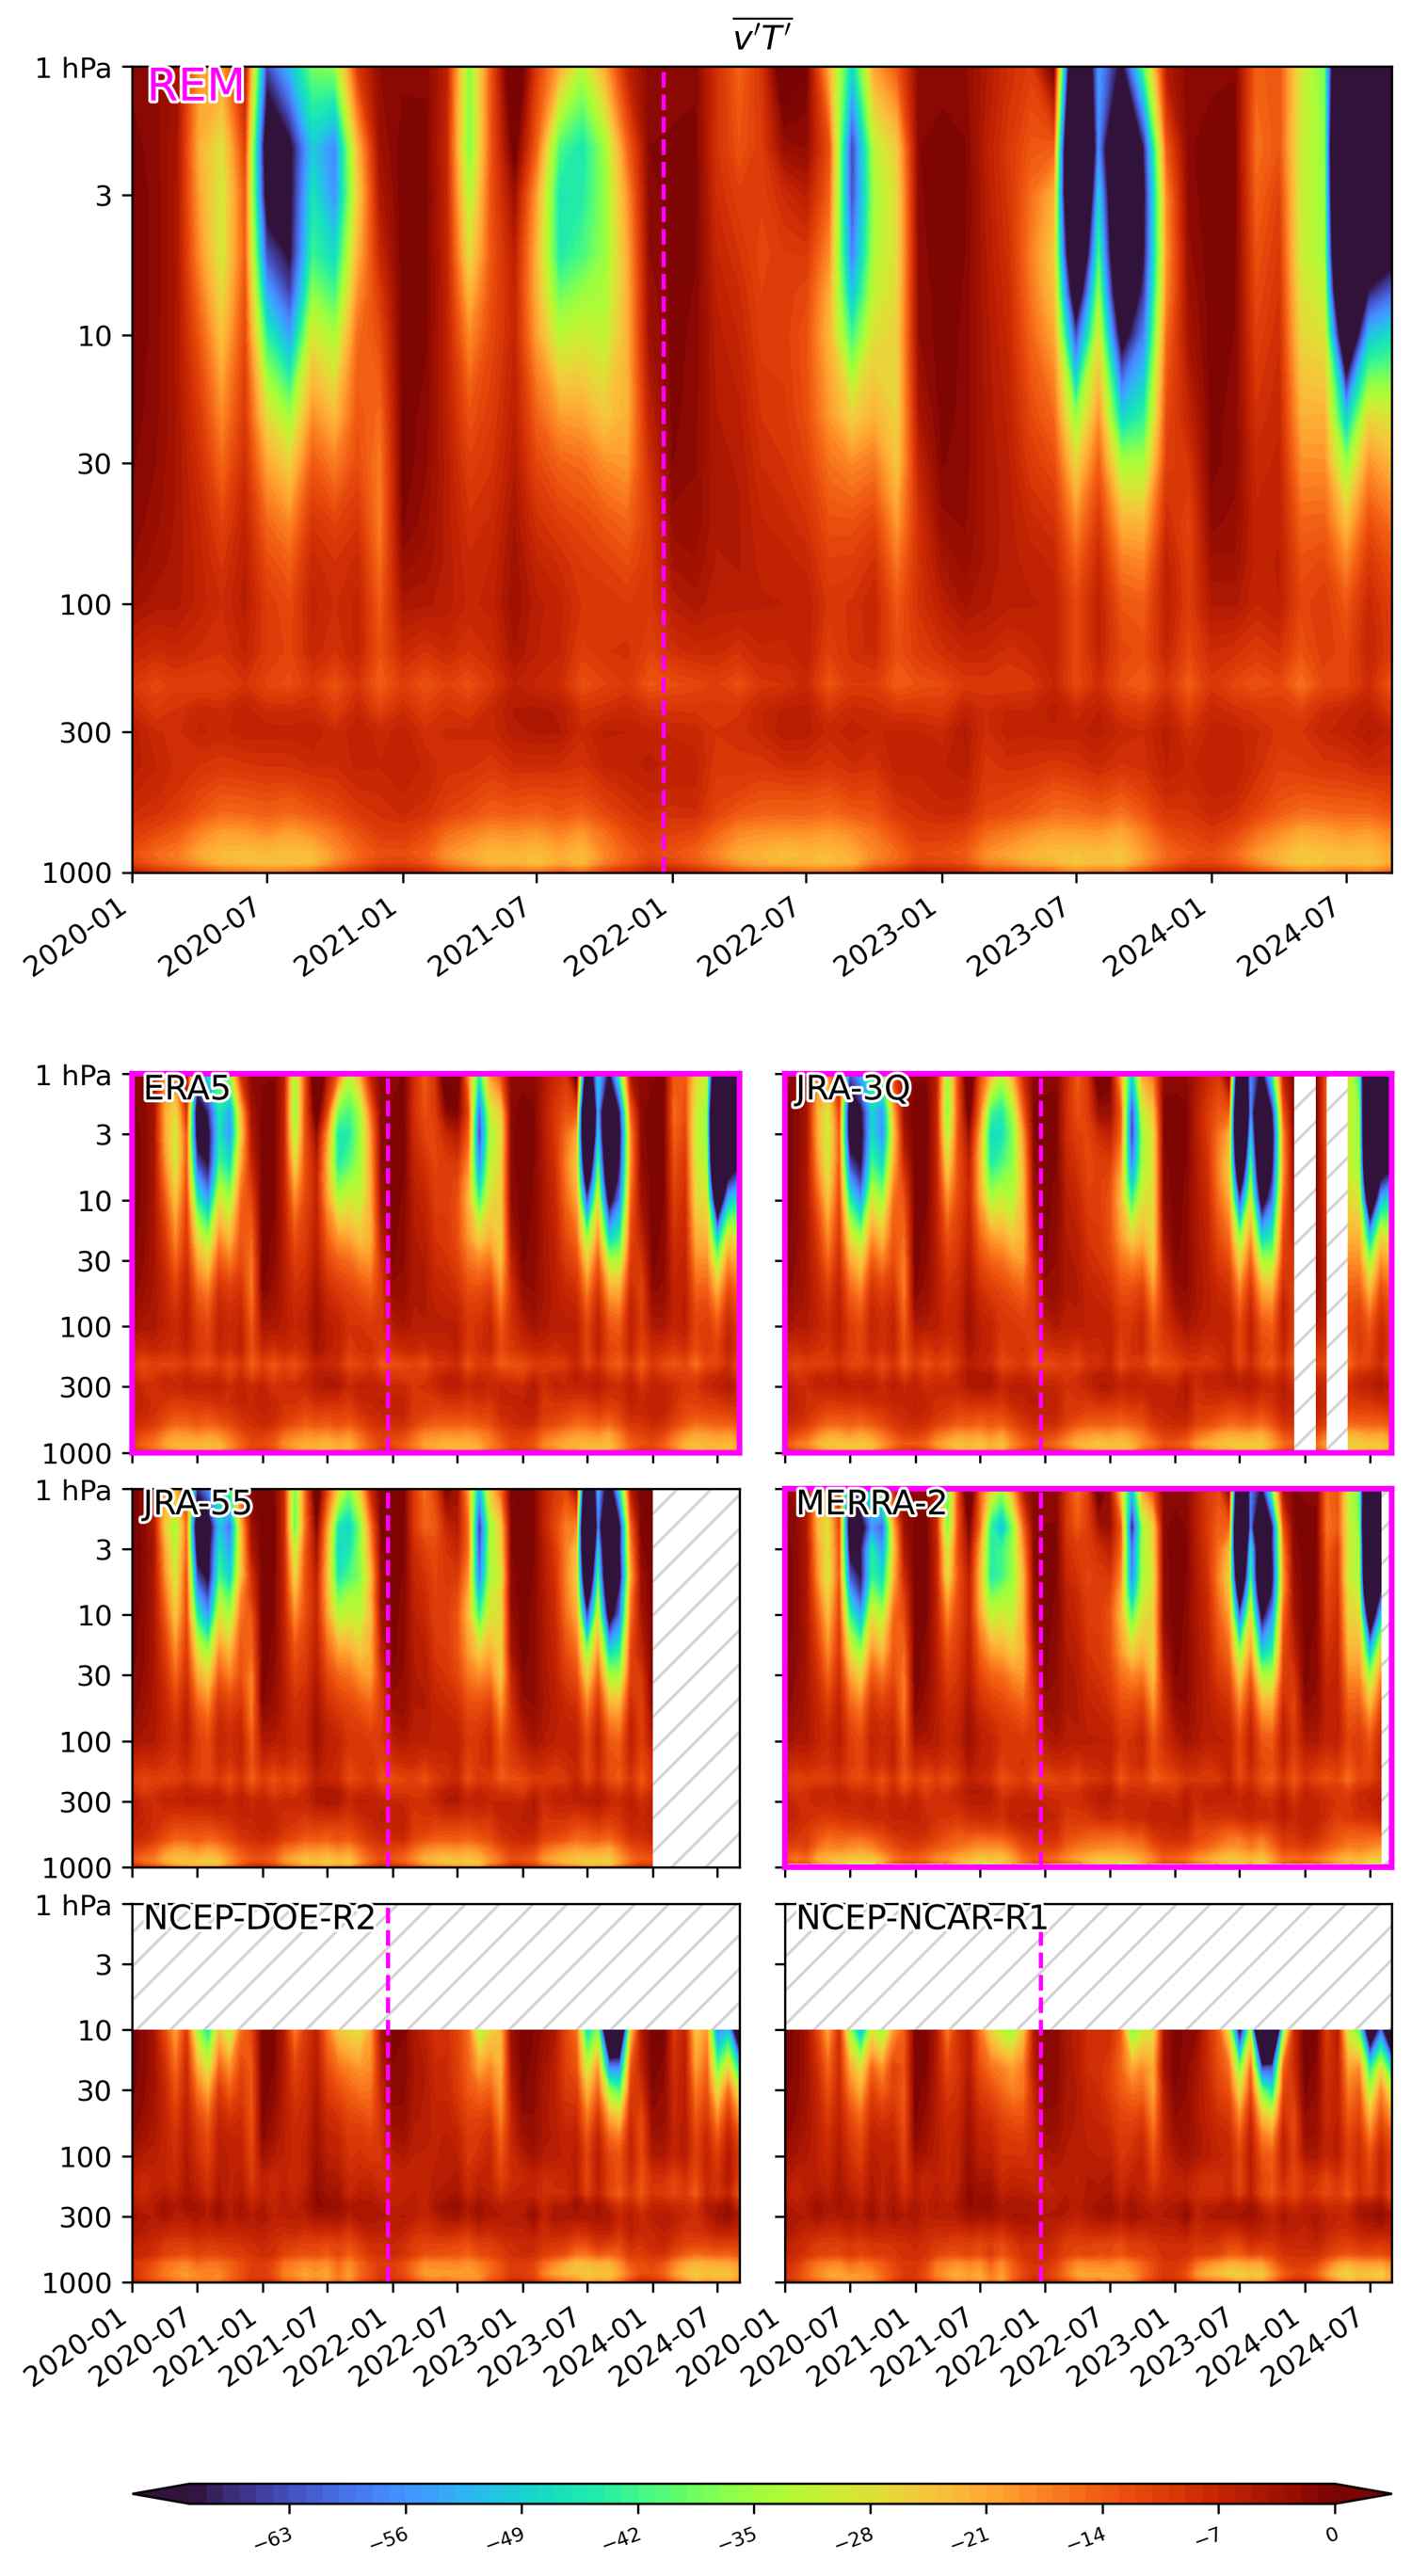
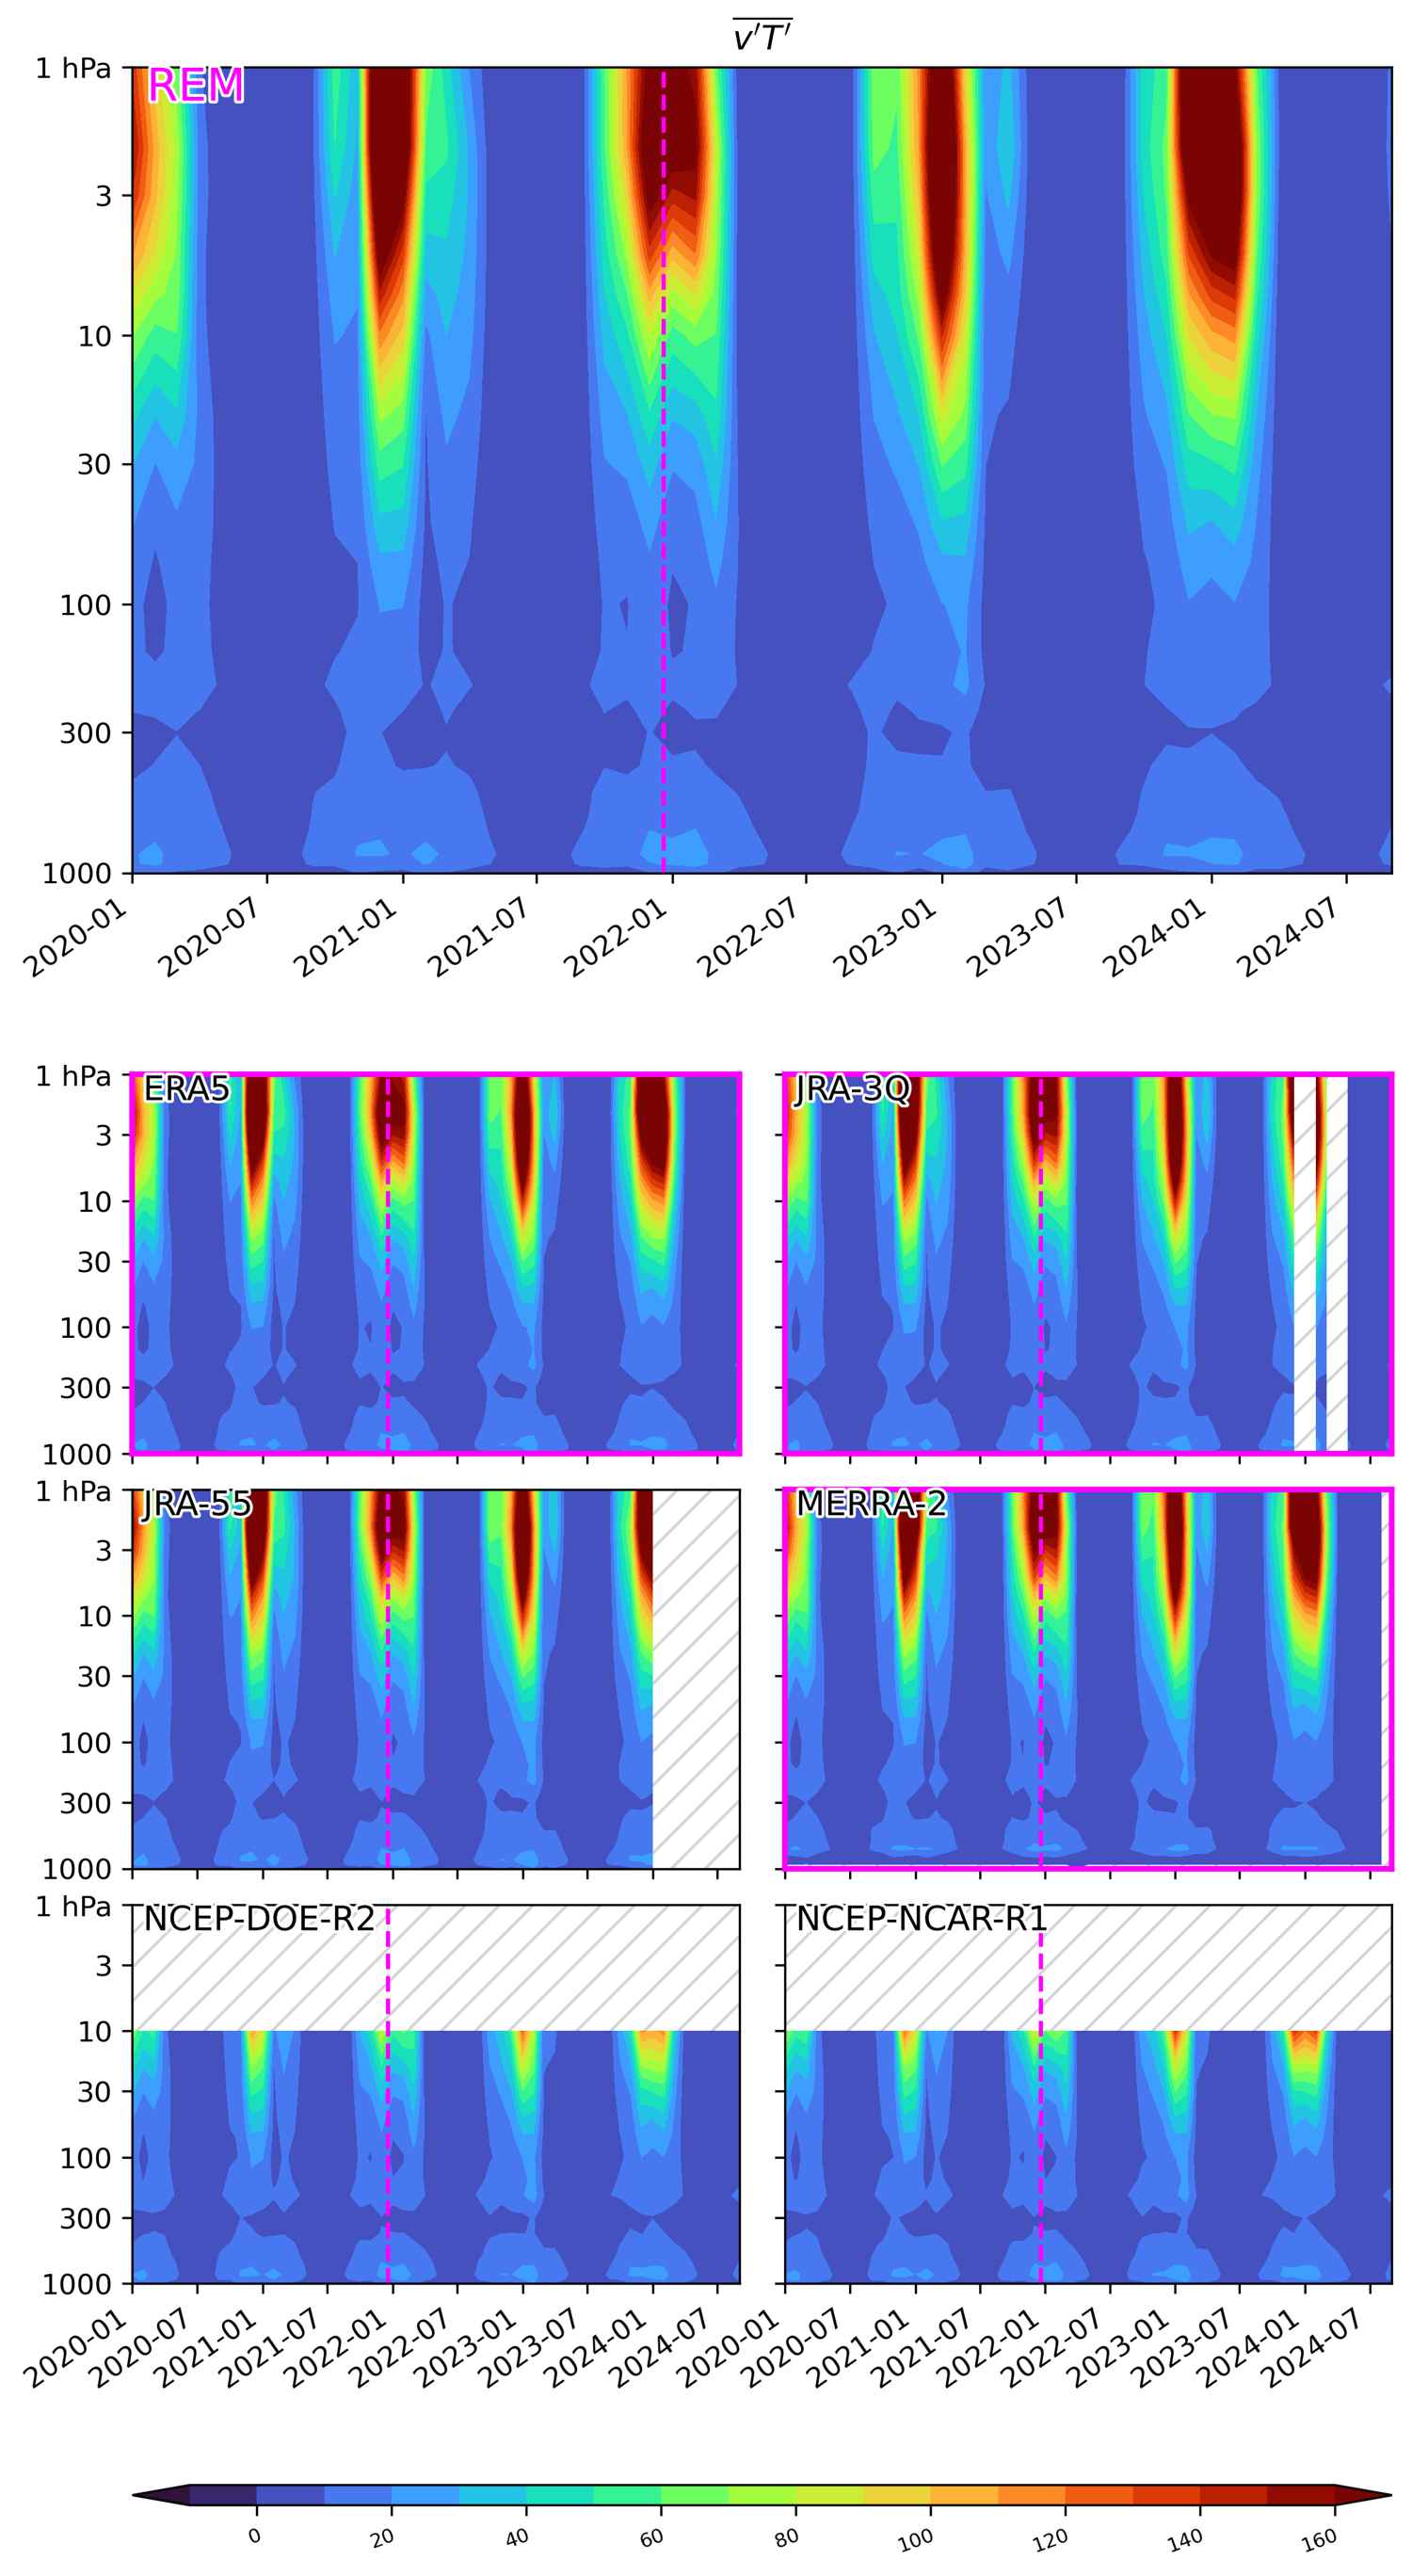
Absolute values (averaged over: 89S-60S)
(top) Reanalysis ensemble mean (REM) of “meridional heat flux” plotted as absolute values as a function of pressure and time. (below) Same but plotted for individual reanalyses. Reanalyses included in the REM are indicated with magenta borders. Unavailable data is hatched. The Hunga Tonga–Hunga Ha’apai eruption occured on 20 December 2021.
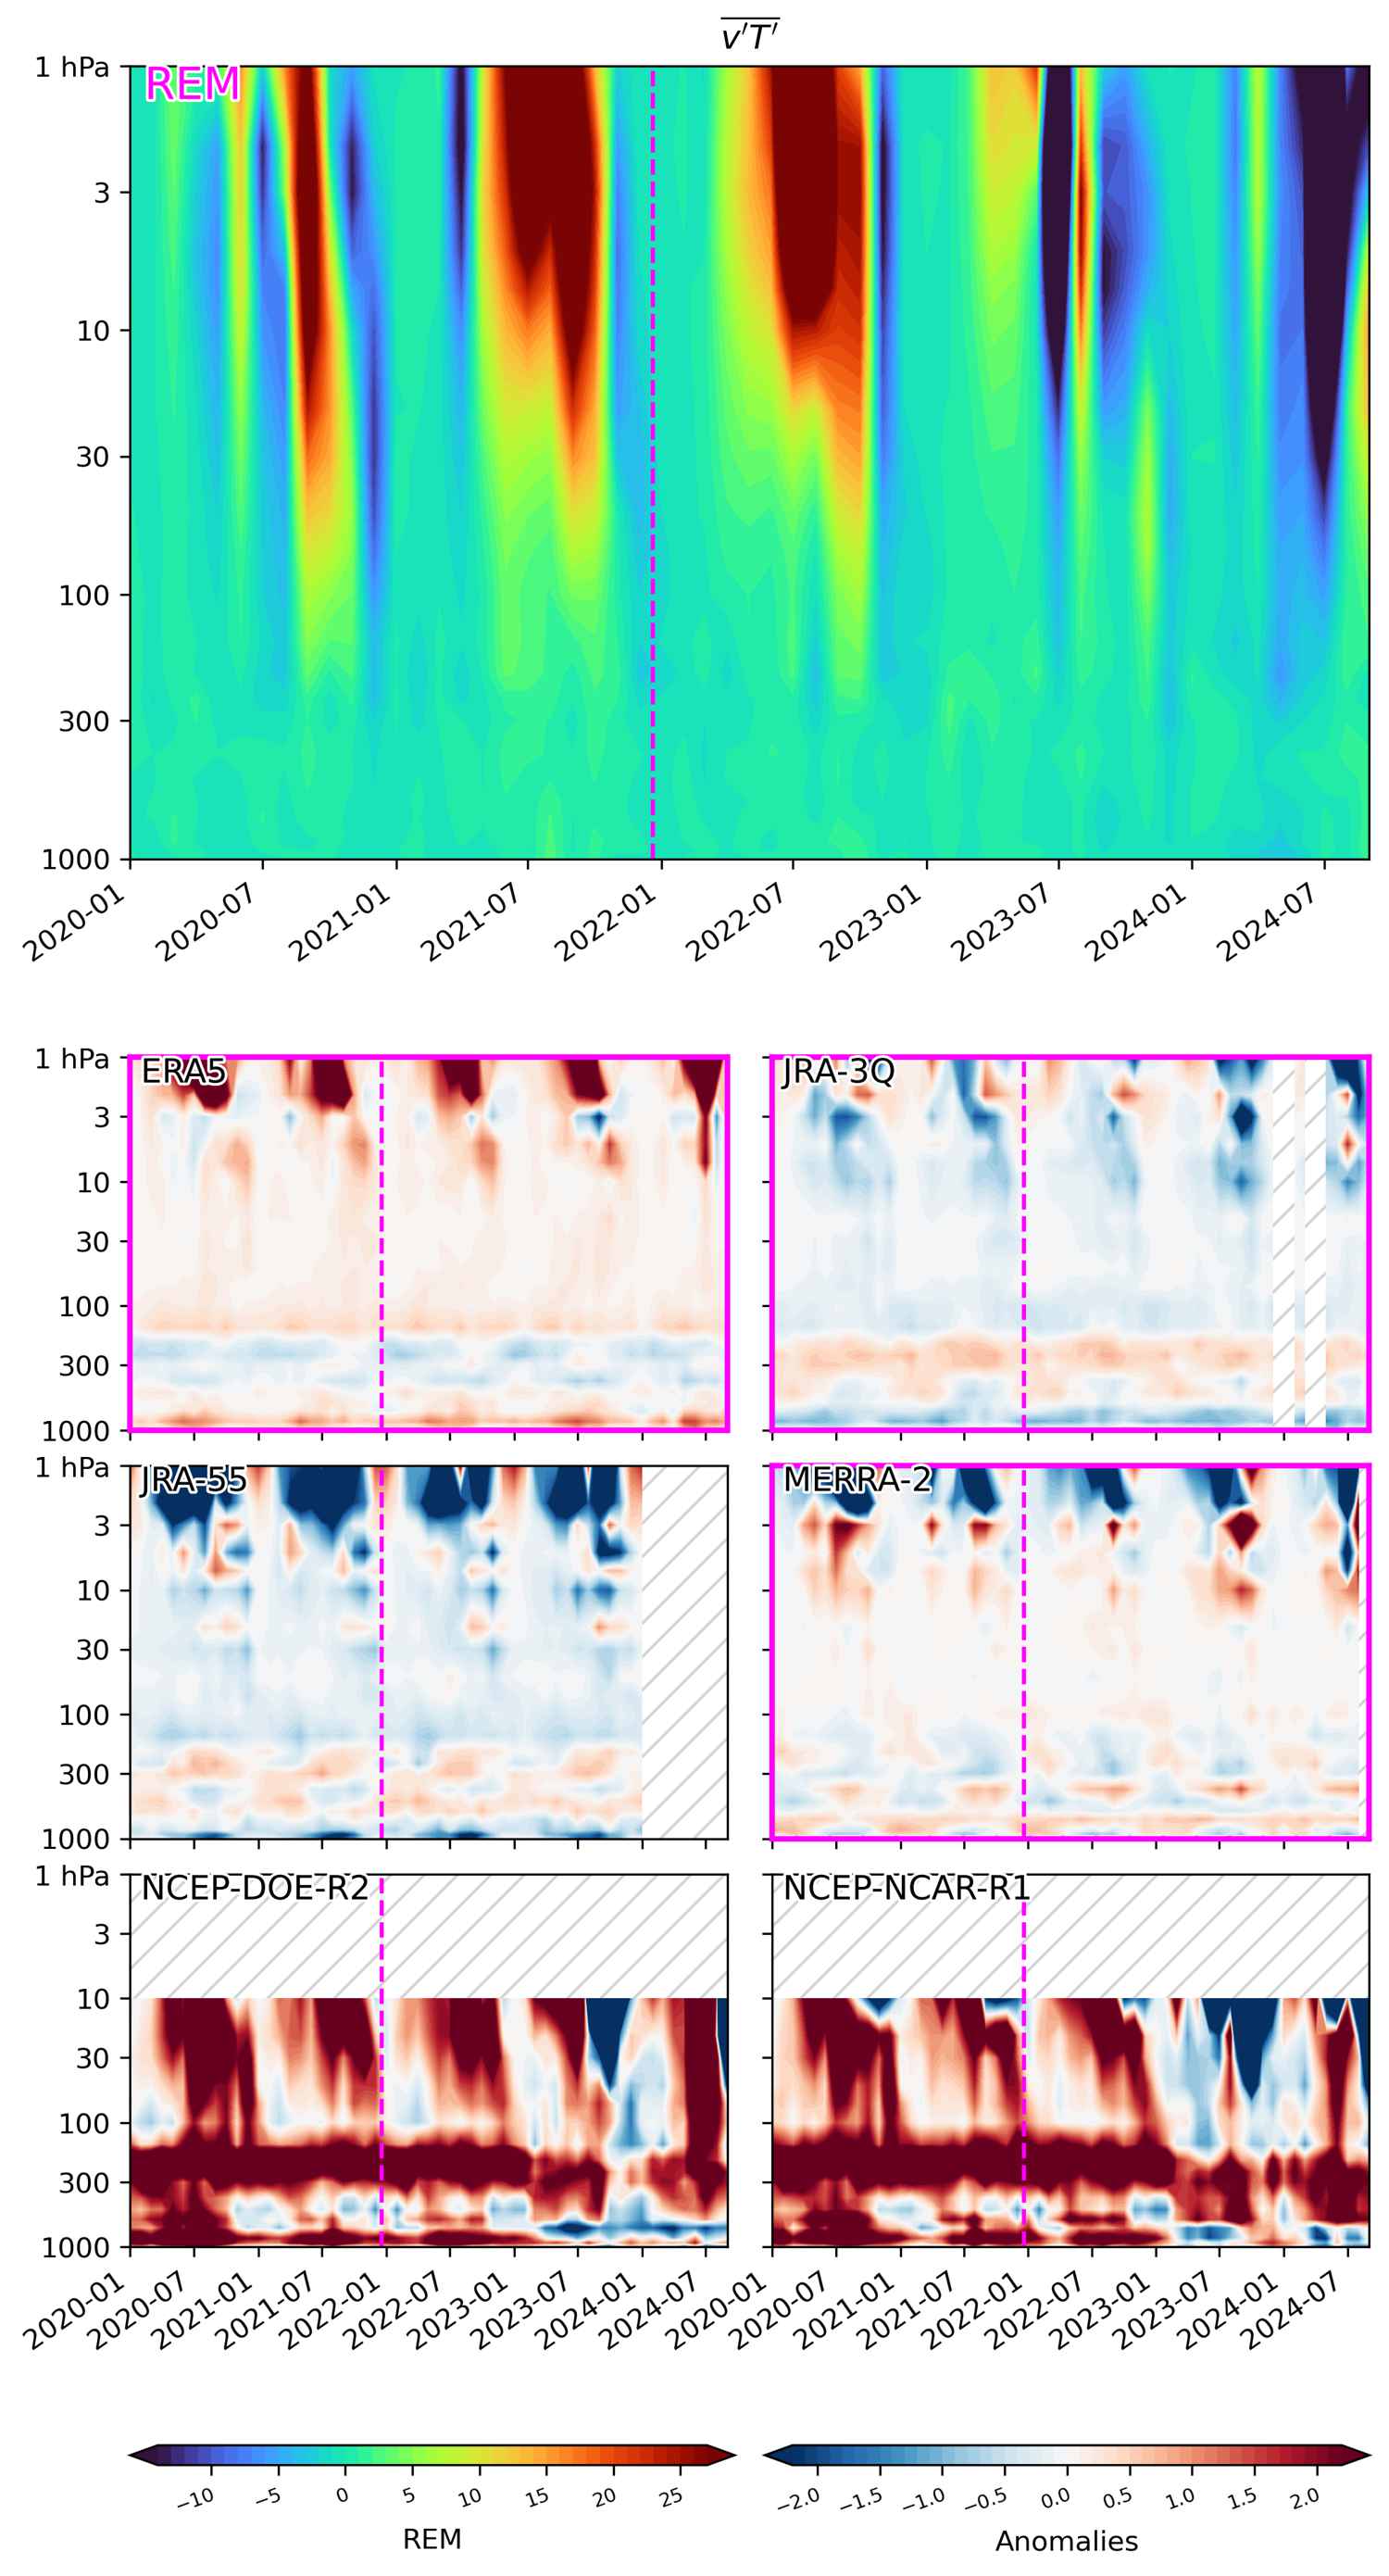
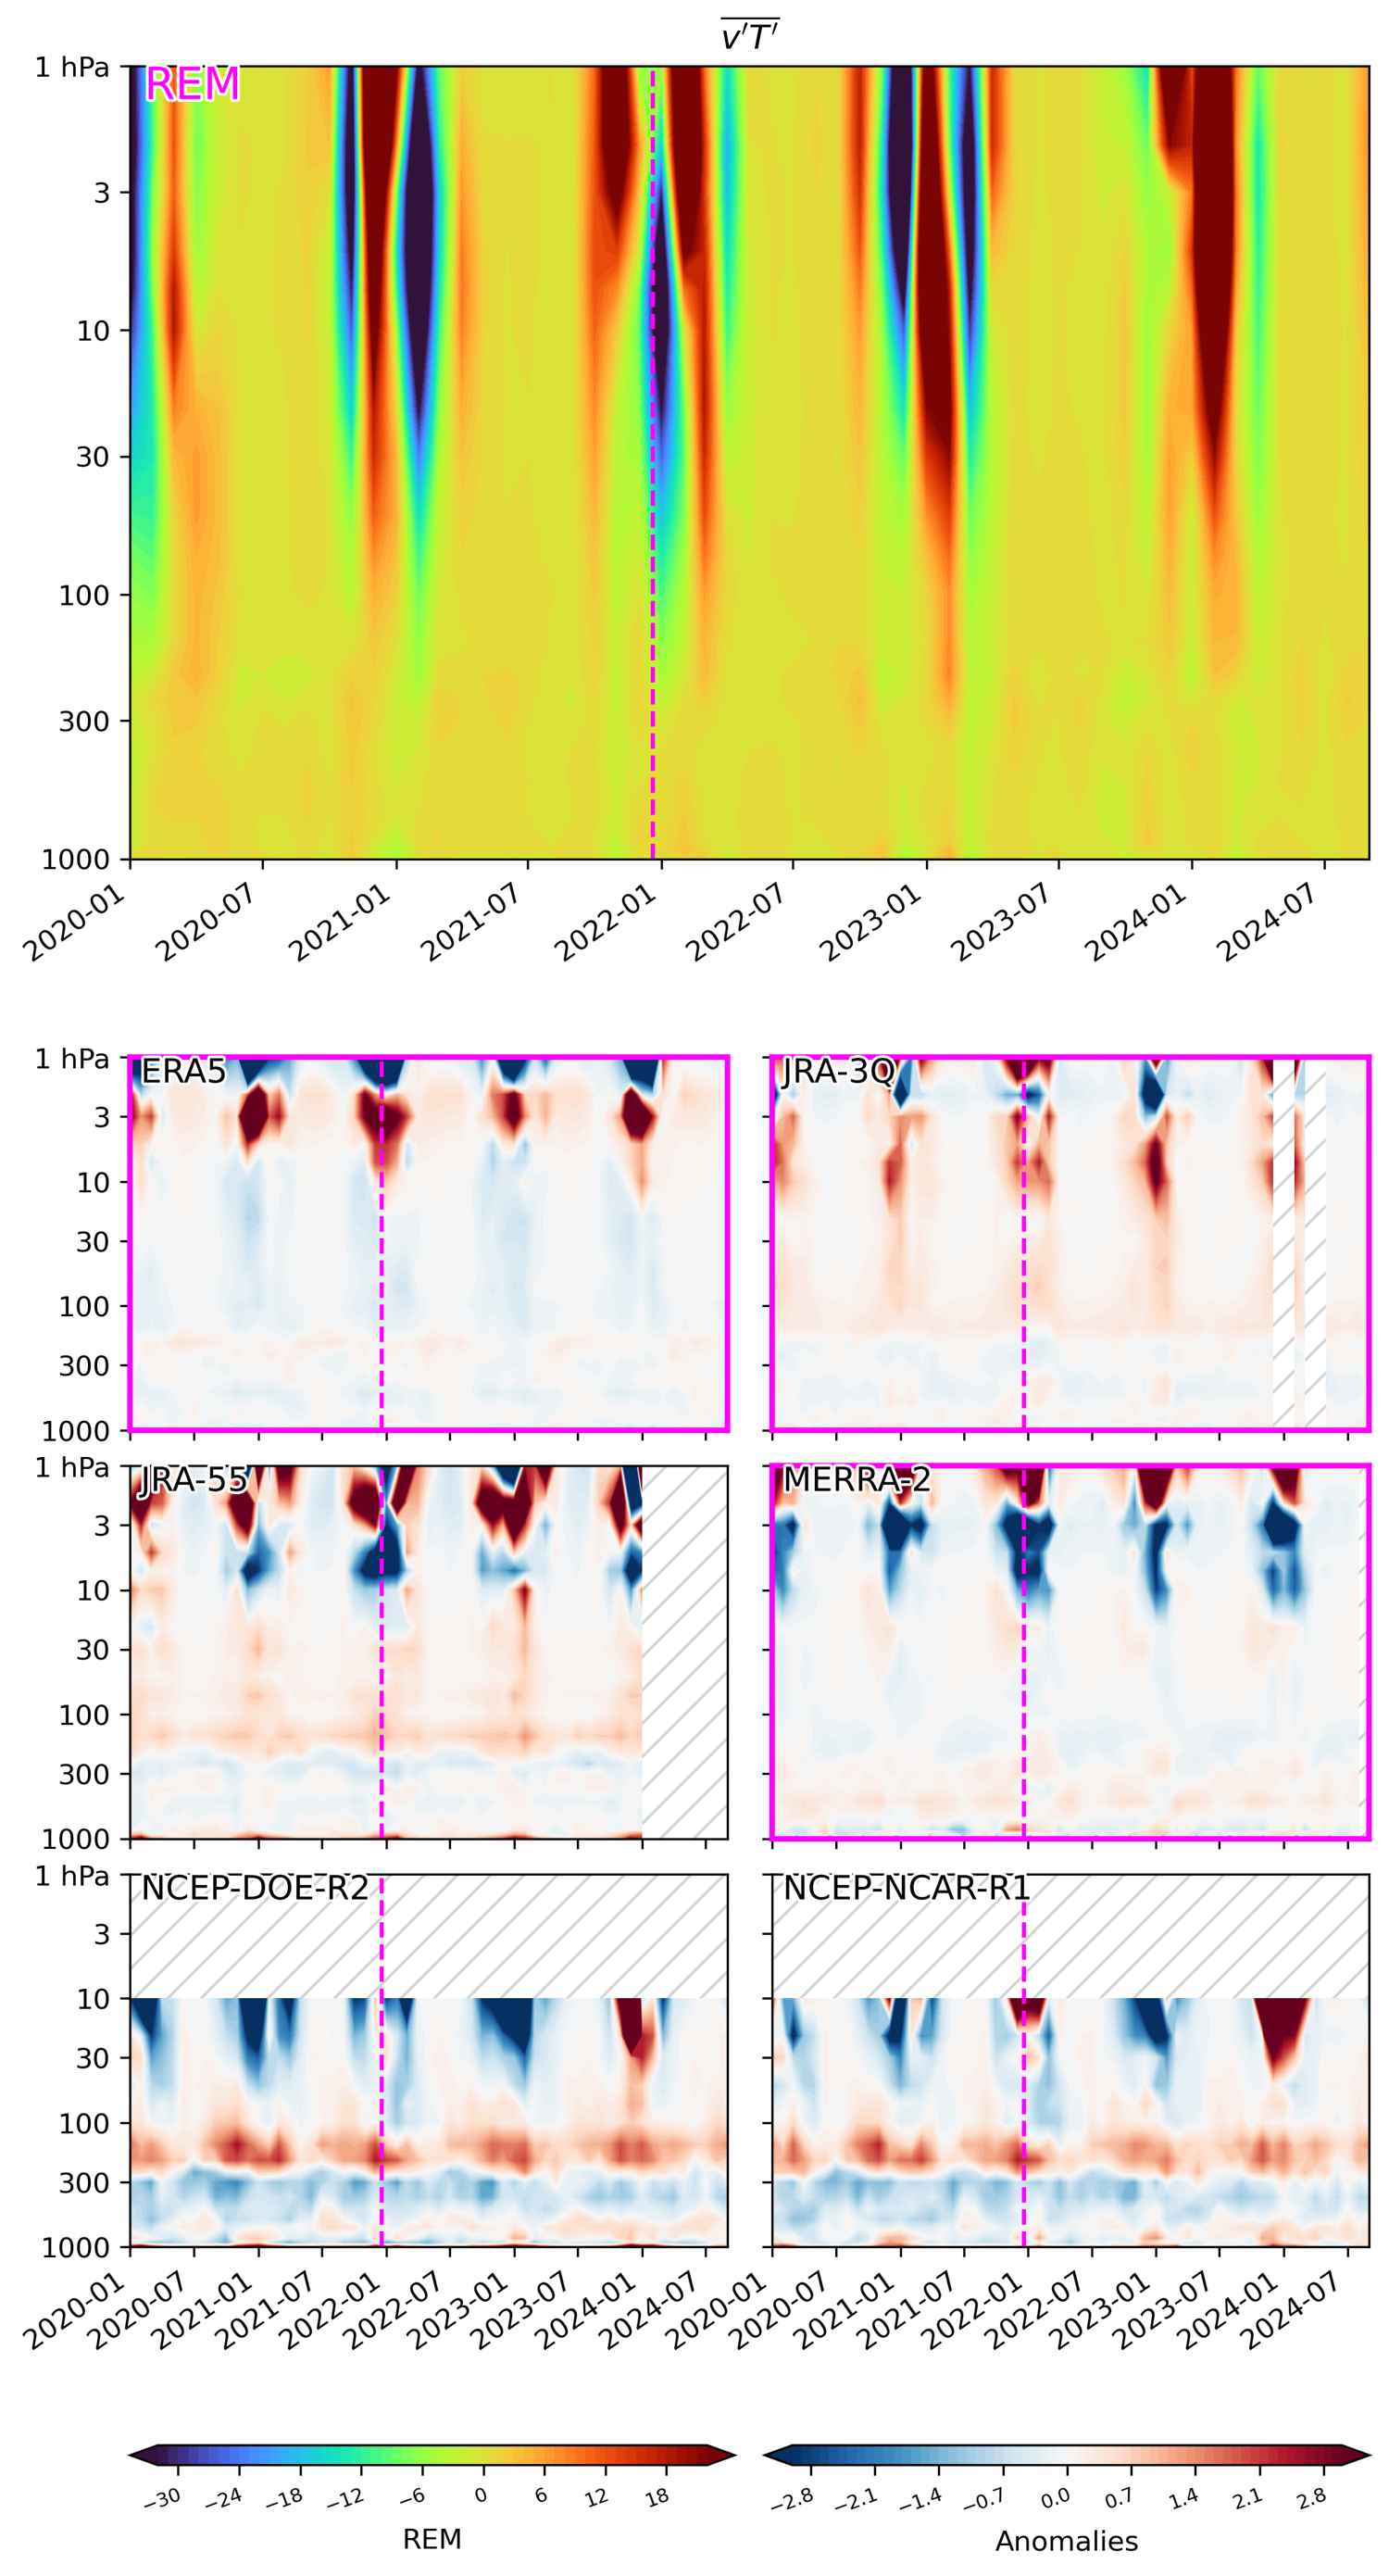
Anomalies as departure from the 2000-2022 monthly climatology (averaged over: 89S-60S)
(top) Reanalysis ensemble mean (REM) of “meridional heat flux” plotted as anomalies as a function of pressure and time. (below) The anomaly with respect to the REM is plotted for individual reanalyses. Reanalyses included in the REM are indicated with magenta borders. Unavailable data is hatched. The Hunga Tonga–Hunga Ha’apai eruption occured on 20 December 2021.
Absolute values (averaged over: 89S-45S)
(top) Reanalysis ensemble mean (REM) of “meridional heat flux” plotted as absolute values as a function of pressure and time. (below) Same but plotted for individual reanalyses. Reanalyses included in the REM are indicated with magenta borders. Unavailable data is hatched. The Hunga Tonga–Hunga Ha’apai eruption occured on 20 December 2021.
Anomalies as departure from the 2000-2022 monthly climatology (averaged over: 89S-45S)
(top) Reanalysis ensemble mean (REM) of “meridional heat flux” plotted as anomalies as a function of pressure and time. (below) The anomaly with respect to the REM is plotted for individual reanalyses. Reanalyses included in the REM are indicated with magenta borders. Unavailable data is hatched. The Hunga Tonga–Hunga Ha’apai eruption occured on 20 December 2021.
Absolute values (averaged over: 15S-15N)
(top) Reanalysis ensemble mean (REM) of “meridional heat flux” plotted as absolute values as a function of pressure and time. (below) Same but plotted for individual reanalyses. Reanalyses included in the REM are indicated with magenta borders. Unavailable data is hatched. The Hunga Tonga–Hunga Ha’apai eruption occured on 20 December 2021.
Anomalies as departure from the 2000-2022 monthly climatology (averaged over: 15S-15N)
(top) Reanalysis ensemble mean (REM) of “meridional heat flux” plotted as anomalies as a function of pressure and time. (below) The anomaly with respect to the REM is plotted for individual reanalyses. Reanalyses included in the REM are indicated with magenta borders. Unavailable data is hatched. The Hunga Tonga–Hunga Ha’apai eruption occured on 20 December 2021.
Absolute values (averaged over: 45N-89N)
(top) Reanalysis ensemble mean (REM) of “meridional heat flux” plotted as absolute values as a function of pressure and time. (below) Same but plotted for individual reanalyses. Reanalyses included in the REM are indicated with magenta borders. Unavailable data is hatched. The Hunga Tonga–Hunga Ha’apai eruption occured on 20 December 2021.
Anomalies as departure from the 2000-2022 monthly climatology (averaged over: 45N-89N)
(top) Reanalysis ensemble mean (REM) of “meridional heat flux” plotted as anomalies as a function of pressure and time. (below) The anomaly with respect to the REM is plotted for individual reanalyses. Reanalyses included in the REM are indicated with magenta borders. Unavailable data is hatched. The Hunga Tonga–Hunga Ha’apai eruption occured on 20 December 2021.
Absolute values (averaged over: 60S-30S)
(top) Reanalysis ensemble mean (REM) of “meridional heat flux” plotted as absolute values as a function of pressure and time. (below) Same but plotted for individual reanalyses. Reanalyses included in the REM are indicated with magenta borders. Unavailable data is hatched. The Hunga Tonga–Hunga Ha’apai eruption occured on 20 December 2021.
Anomalies as departure from the 2000-2022 monthly climatology (averaged over: 60S-30S)
(top) Reanalysis ensemble mean (REM) of “meridional heat flux” plotted as anomalies as a function of pressure and time. (below) The anomaly with respect to the REM is plotted for individual reanalyses. Reanalyses included in the REM are indicated with magenta borders. Unavailable data is hatched. The Hunga Tonga–Hunga Ha’apai eruption occured on 20 December 2021.
Absolute values (averaged over: 89S-60S)
(top) Reanalysis ensemble mean (REM) of “meridional heat flux” plotted as absolute values as a function of pressure and time. (below) Same but plotted for individual reanalyses. Reanalyses included in the REM are indicated with magenta borders. Unavailable data is hatched. The Hunga Tonga–Hunga Ha’apai eruption occured on 20 December 2021.
Anomalies as departure from the 2000-2022 monthly climatology (averaged over: 89S-60S)
(top) Reanalysis ensemble mean (REM) of “meridional heat flux” plotted as anomalies as a function of pressure and time. (below) The anomaly with respect to the REM is plotted for individual reanalyses. Reanalyses included in the REM are indicated with magenta borders. Unavailable data is hatched. The Hunga Tonga–Hunga Ha’apai eruption occured on 20 December 2021.
Absolute values (averaged over: 89S-45S)
(top) Reanalysis ensemble mean (REM) of “meridional heat flux” plotted as absolute values as a function of pressure and time. (below) Same but plotted for individual reanalyses. Reanalyses included in the REM are indicated with magenta borders. Unavailable data is hatched. The Hunga Tonga–Hunga Ha’apai eruption occured on 20 December 2021.
Anomalies as departure from the 2000-2022 monthly climatology (averaged over: 89S-45S)
(top) Reanalysis ensemble mean (REM) of “meridional heat flux” plotted as anomalies as a function of pressure and time. (below) The anomaly with respect to the REM is plotted for individual reanalyses. Reanalyses included in the REM are indicated with magenta borders. Unavailable data is hatched. The Hunga Tonga–Hunga Ha’apai eruption occured on 20 December 2021.
Absolute values (averaged over: 15S-15N)
(top) Reanalysis ensemble mean (REM) of “meridional heat flux” plotted as absolute values as a function of pressure and time. (below) Same but plotted for individual reanalyses. Reanalyses included in the REM are indicated with magenta borders. Unavailable data is hatched. The Hunga Tonga–Hunga Ha’apai eruption occured on 20 December 2021.
Anomalies as departure from the 2000-2022 monthly climatology (averaged over: 15S-15N)
(top) Reanalysis ensemble mean (REM) of “meridional heat flux” plotted as anomalies as a function of pressure and time. (below) The anomaly with respect to the REM is plotted for individual reanalyses. Reanalyses included in the REM are indicated with magenta borders. Unavailable data is hatched. The Hunga Tonga–Hunga Ha’apai eruption occured on 20 December 2021.
Absolute values (averaged over: 45N-89N)
(top) Reanalysis ensemble mean (REM) of “meridional heat flux” plotted as absolute values as a function of pressure and time. (below) Same but plotted for individual reanalyses. Reanalyses included in the REM are indicated with magenta borders. Unavailable data is hatched. The Hunga Tonga–Hunga Ha’apai eruption occured on 20 December 2021.
Anomalies as departure from the 2000-2022 monthly climatology (averaged over: 45N-89N)
(top) Reanalysis ensemble mean (REM) of “meridional heat flux” plotted as anomalies as a function of pressure and time. (below) The anomaly with respect to the REM is plotted for individual reanalyses. Reanalyses included in the REM are indicated with magenta borders. Unavailable data is hatched. The Hunga Tonga–Hunga Ha’apai eruption occured on 20 December 2021.
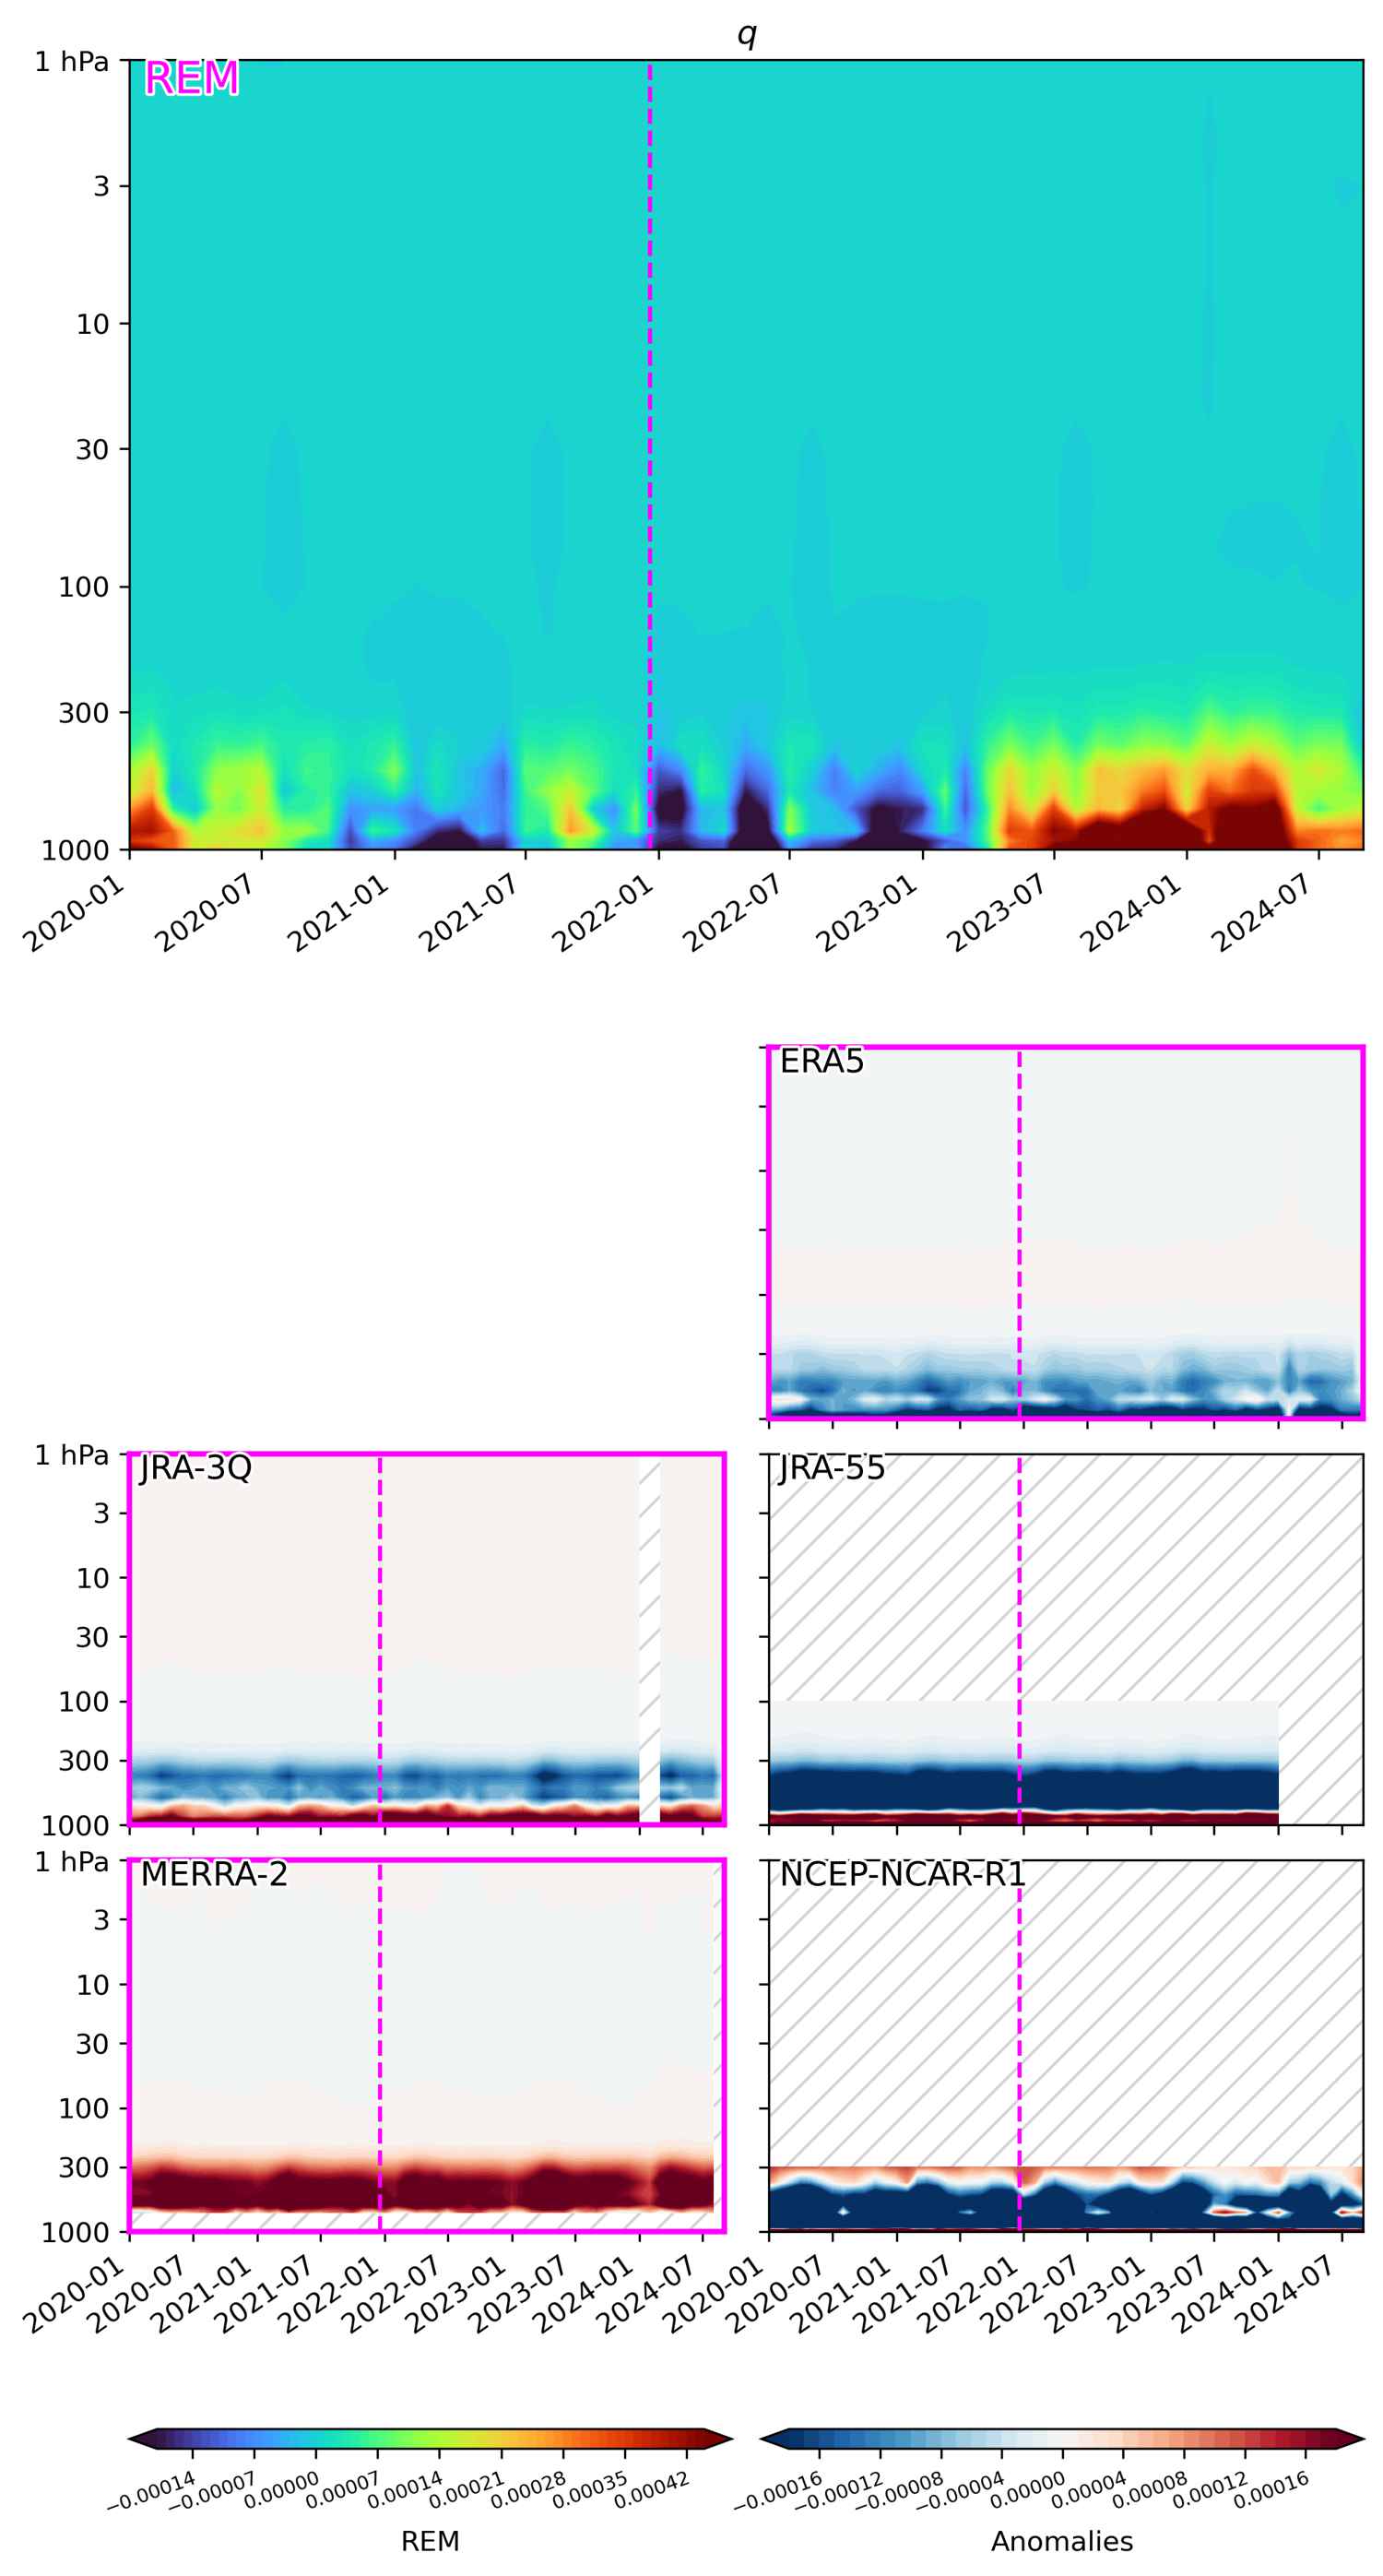
Specific humidity
[latex] q[/latex]
Anomalies as departure from the 2000-2022 monthly climatology (averaged over: 60S-30S)
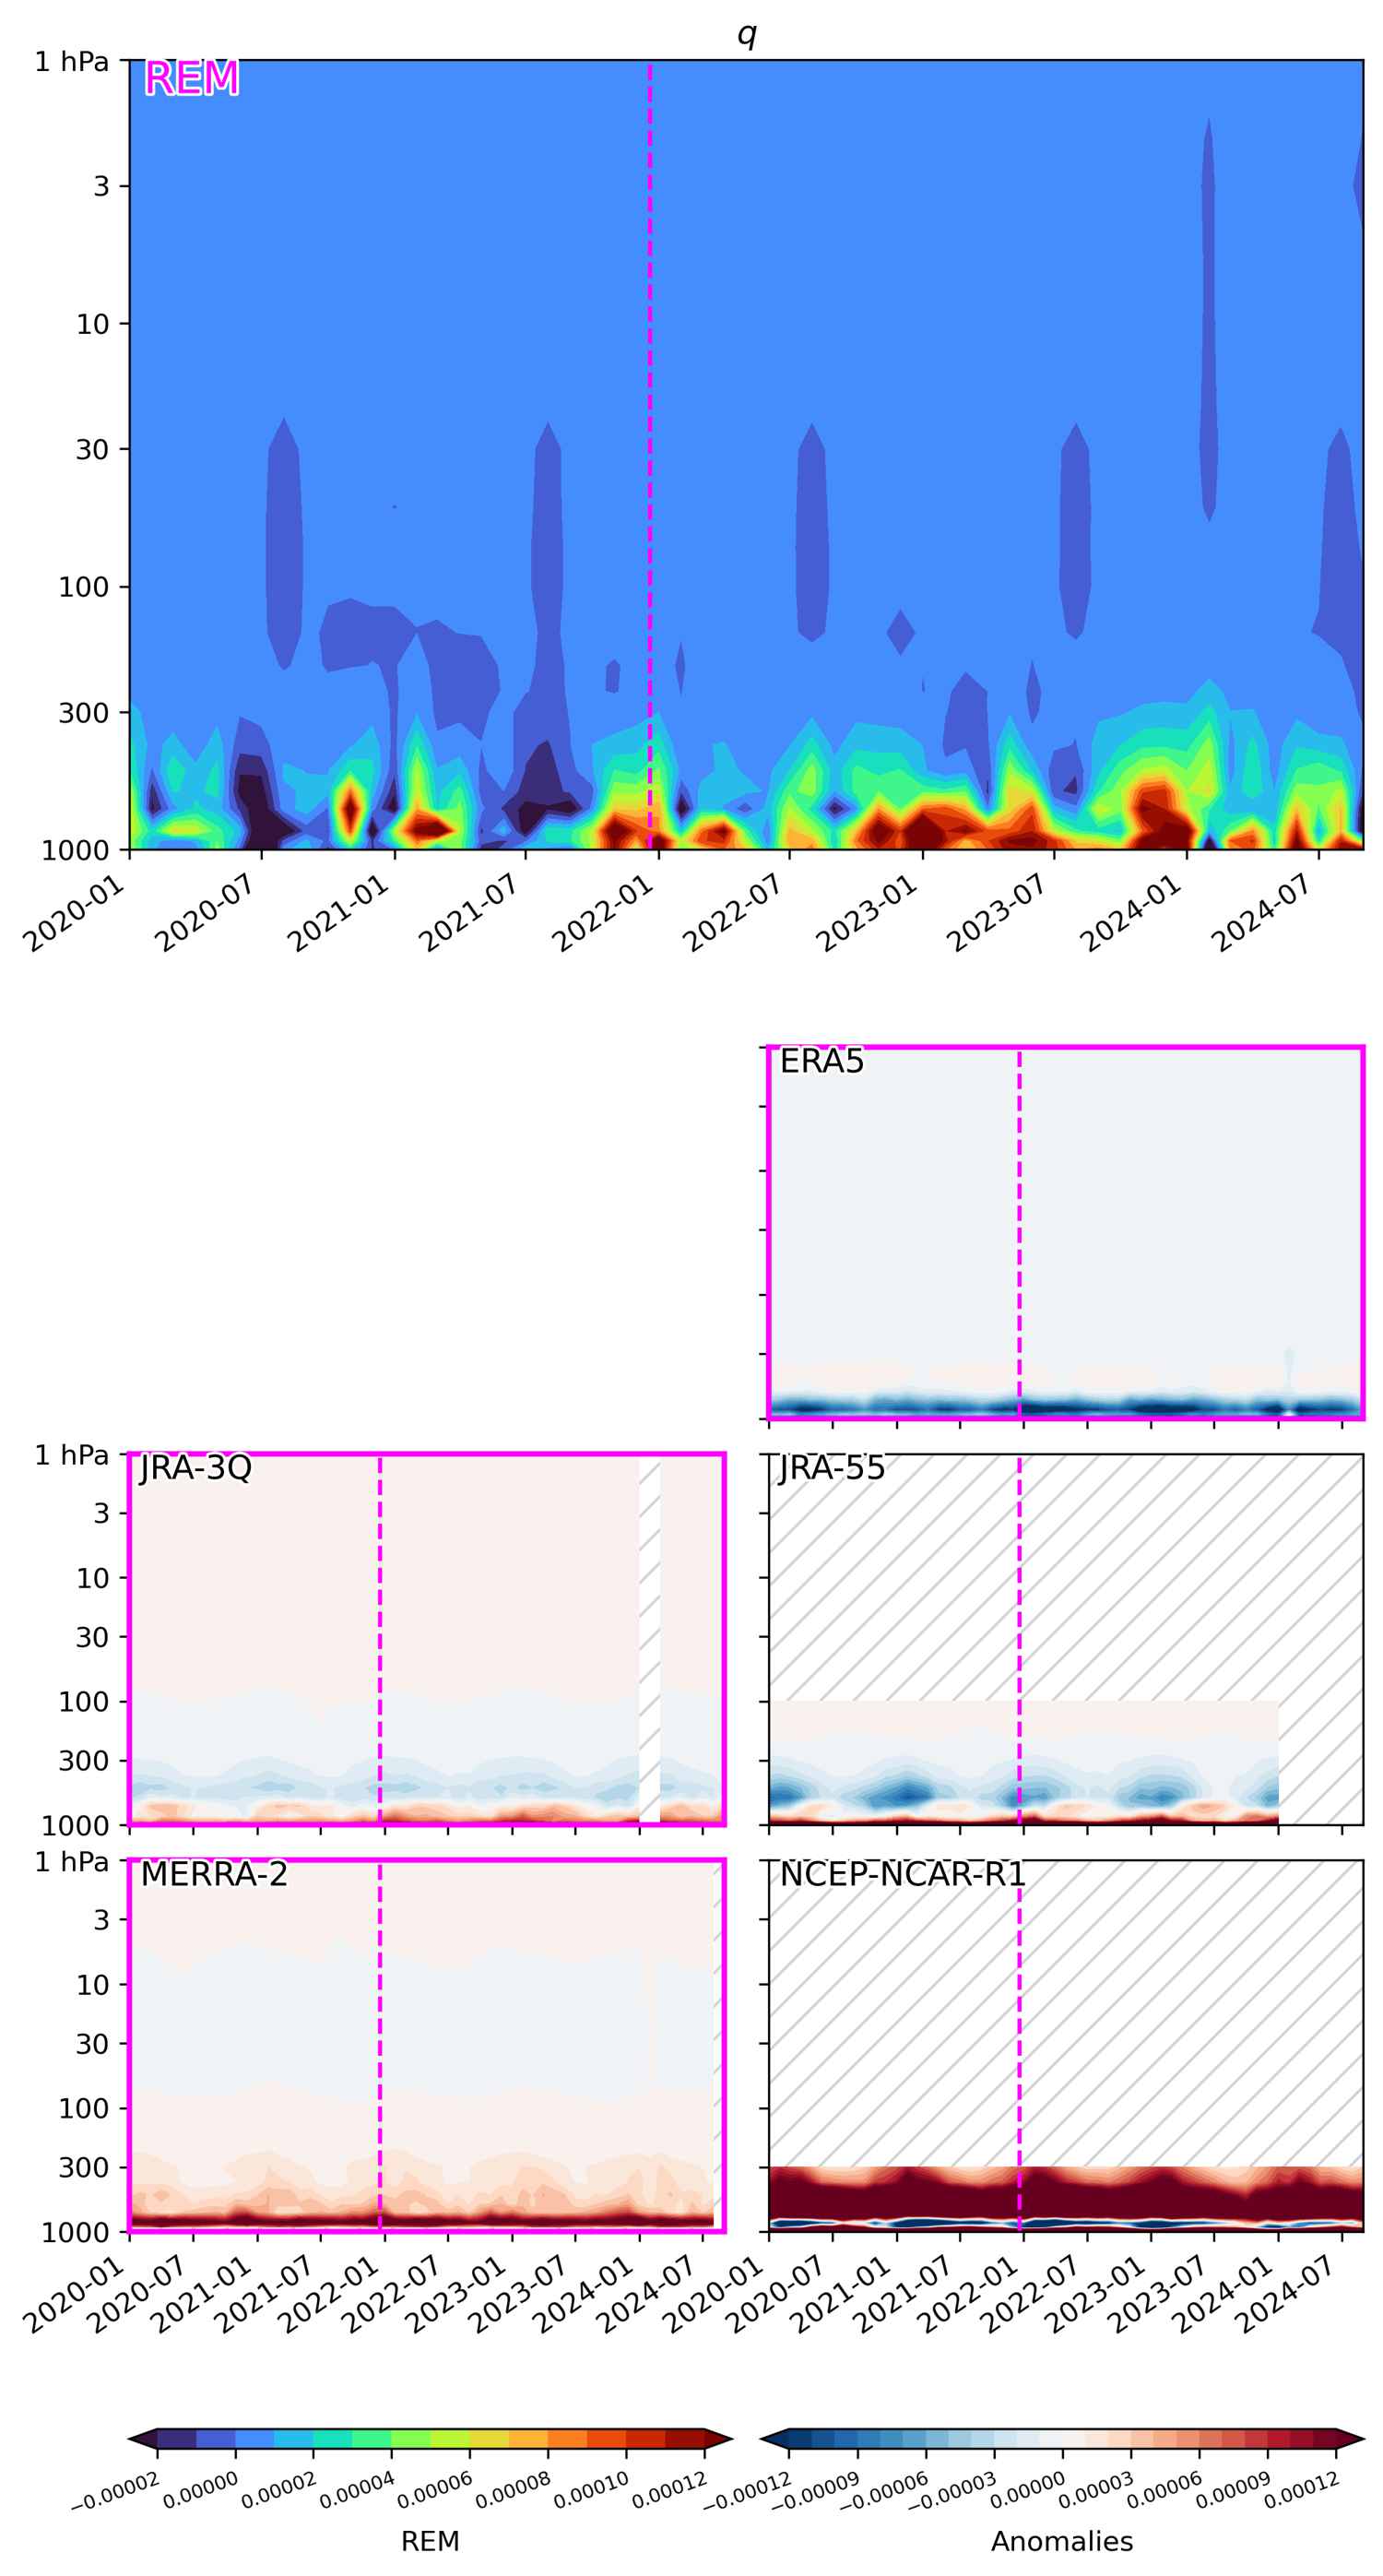
(top) Reanalysis ensemble mean (REM) of “specific humidity” plotted as anomalies as a function of pressure and time. (below) The anomaly with respect to the REM is plotted for individual reanalyses. Reanalyses included in the REM are indicated with magenta borders. Unavailable data is hatched. The Hunga Tonga–Hunga Ha’apai eruption occured on 20 December 2021.
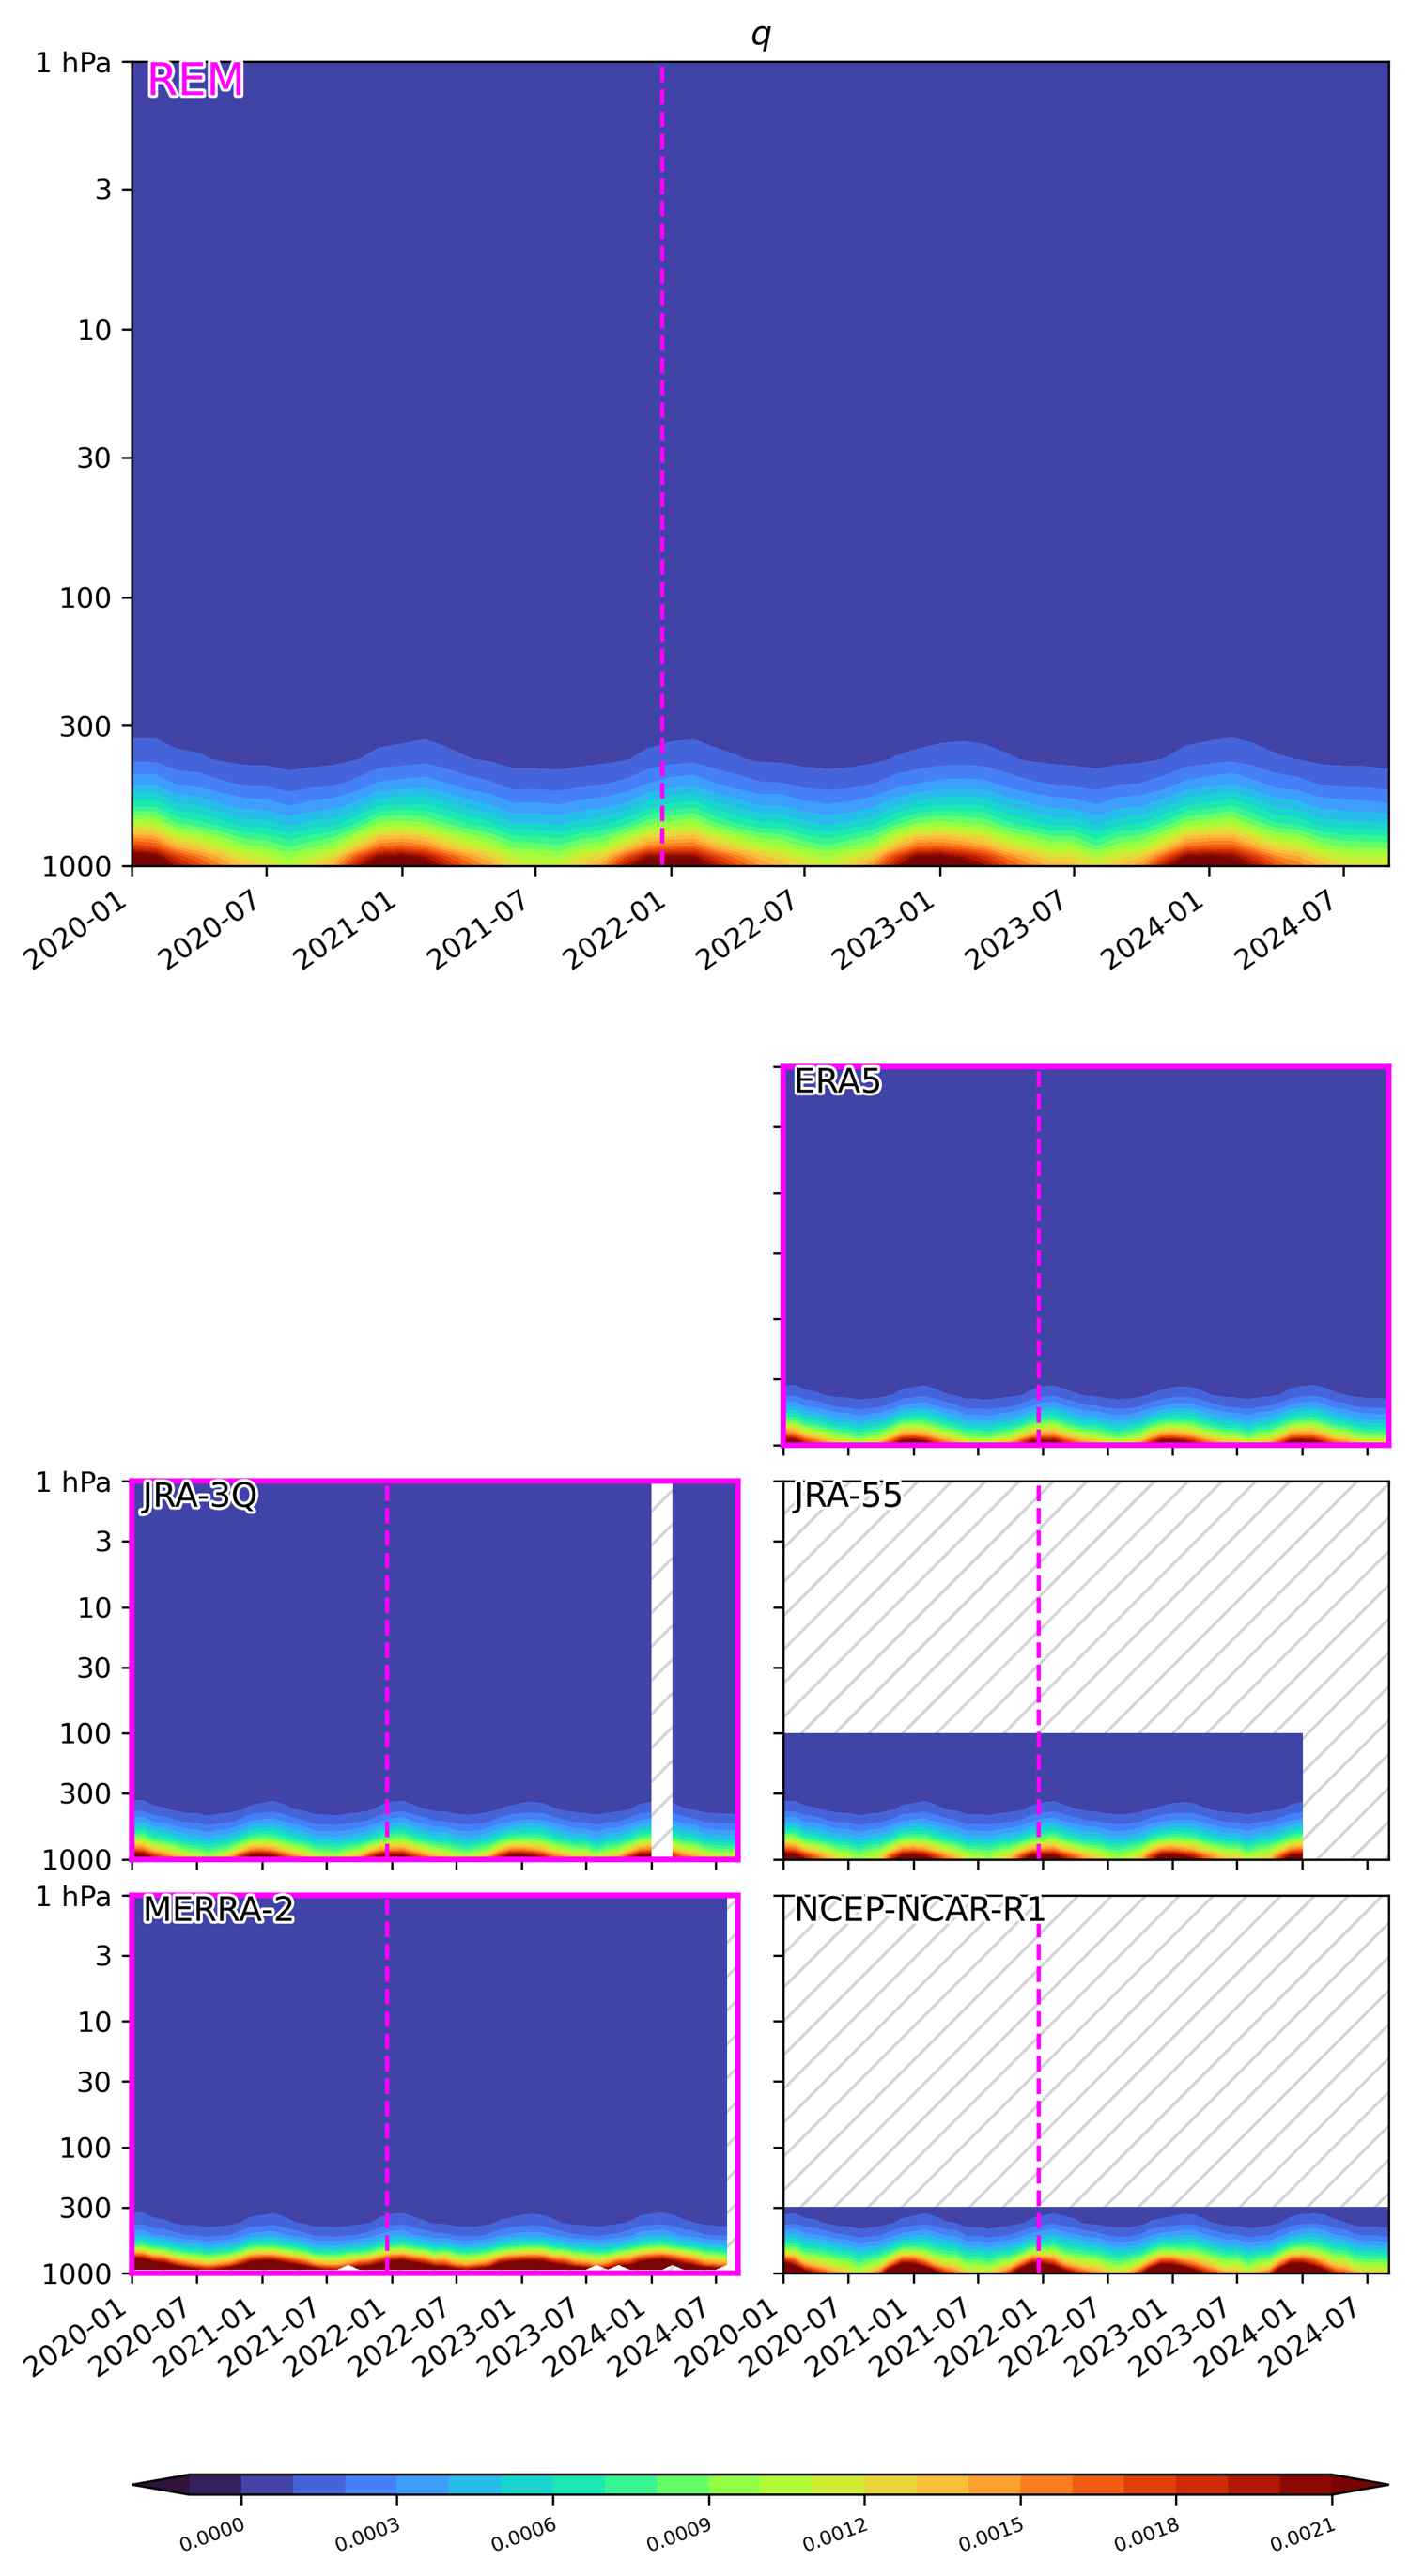
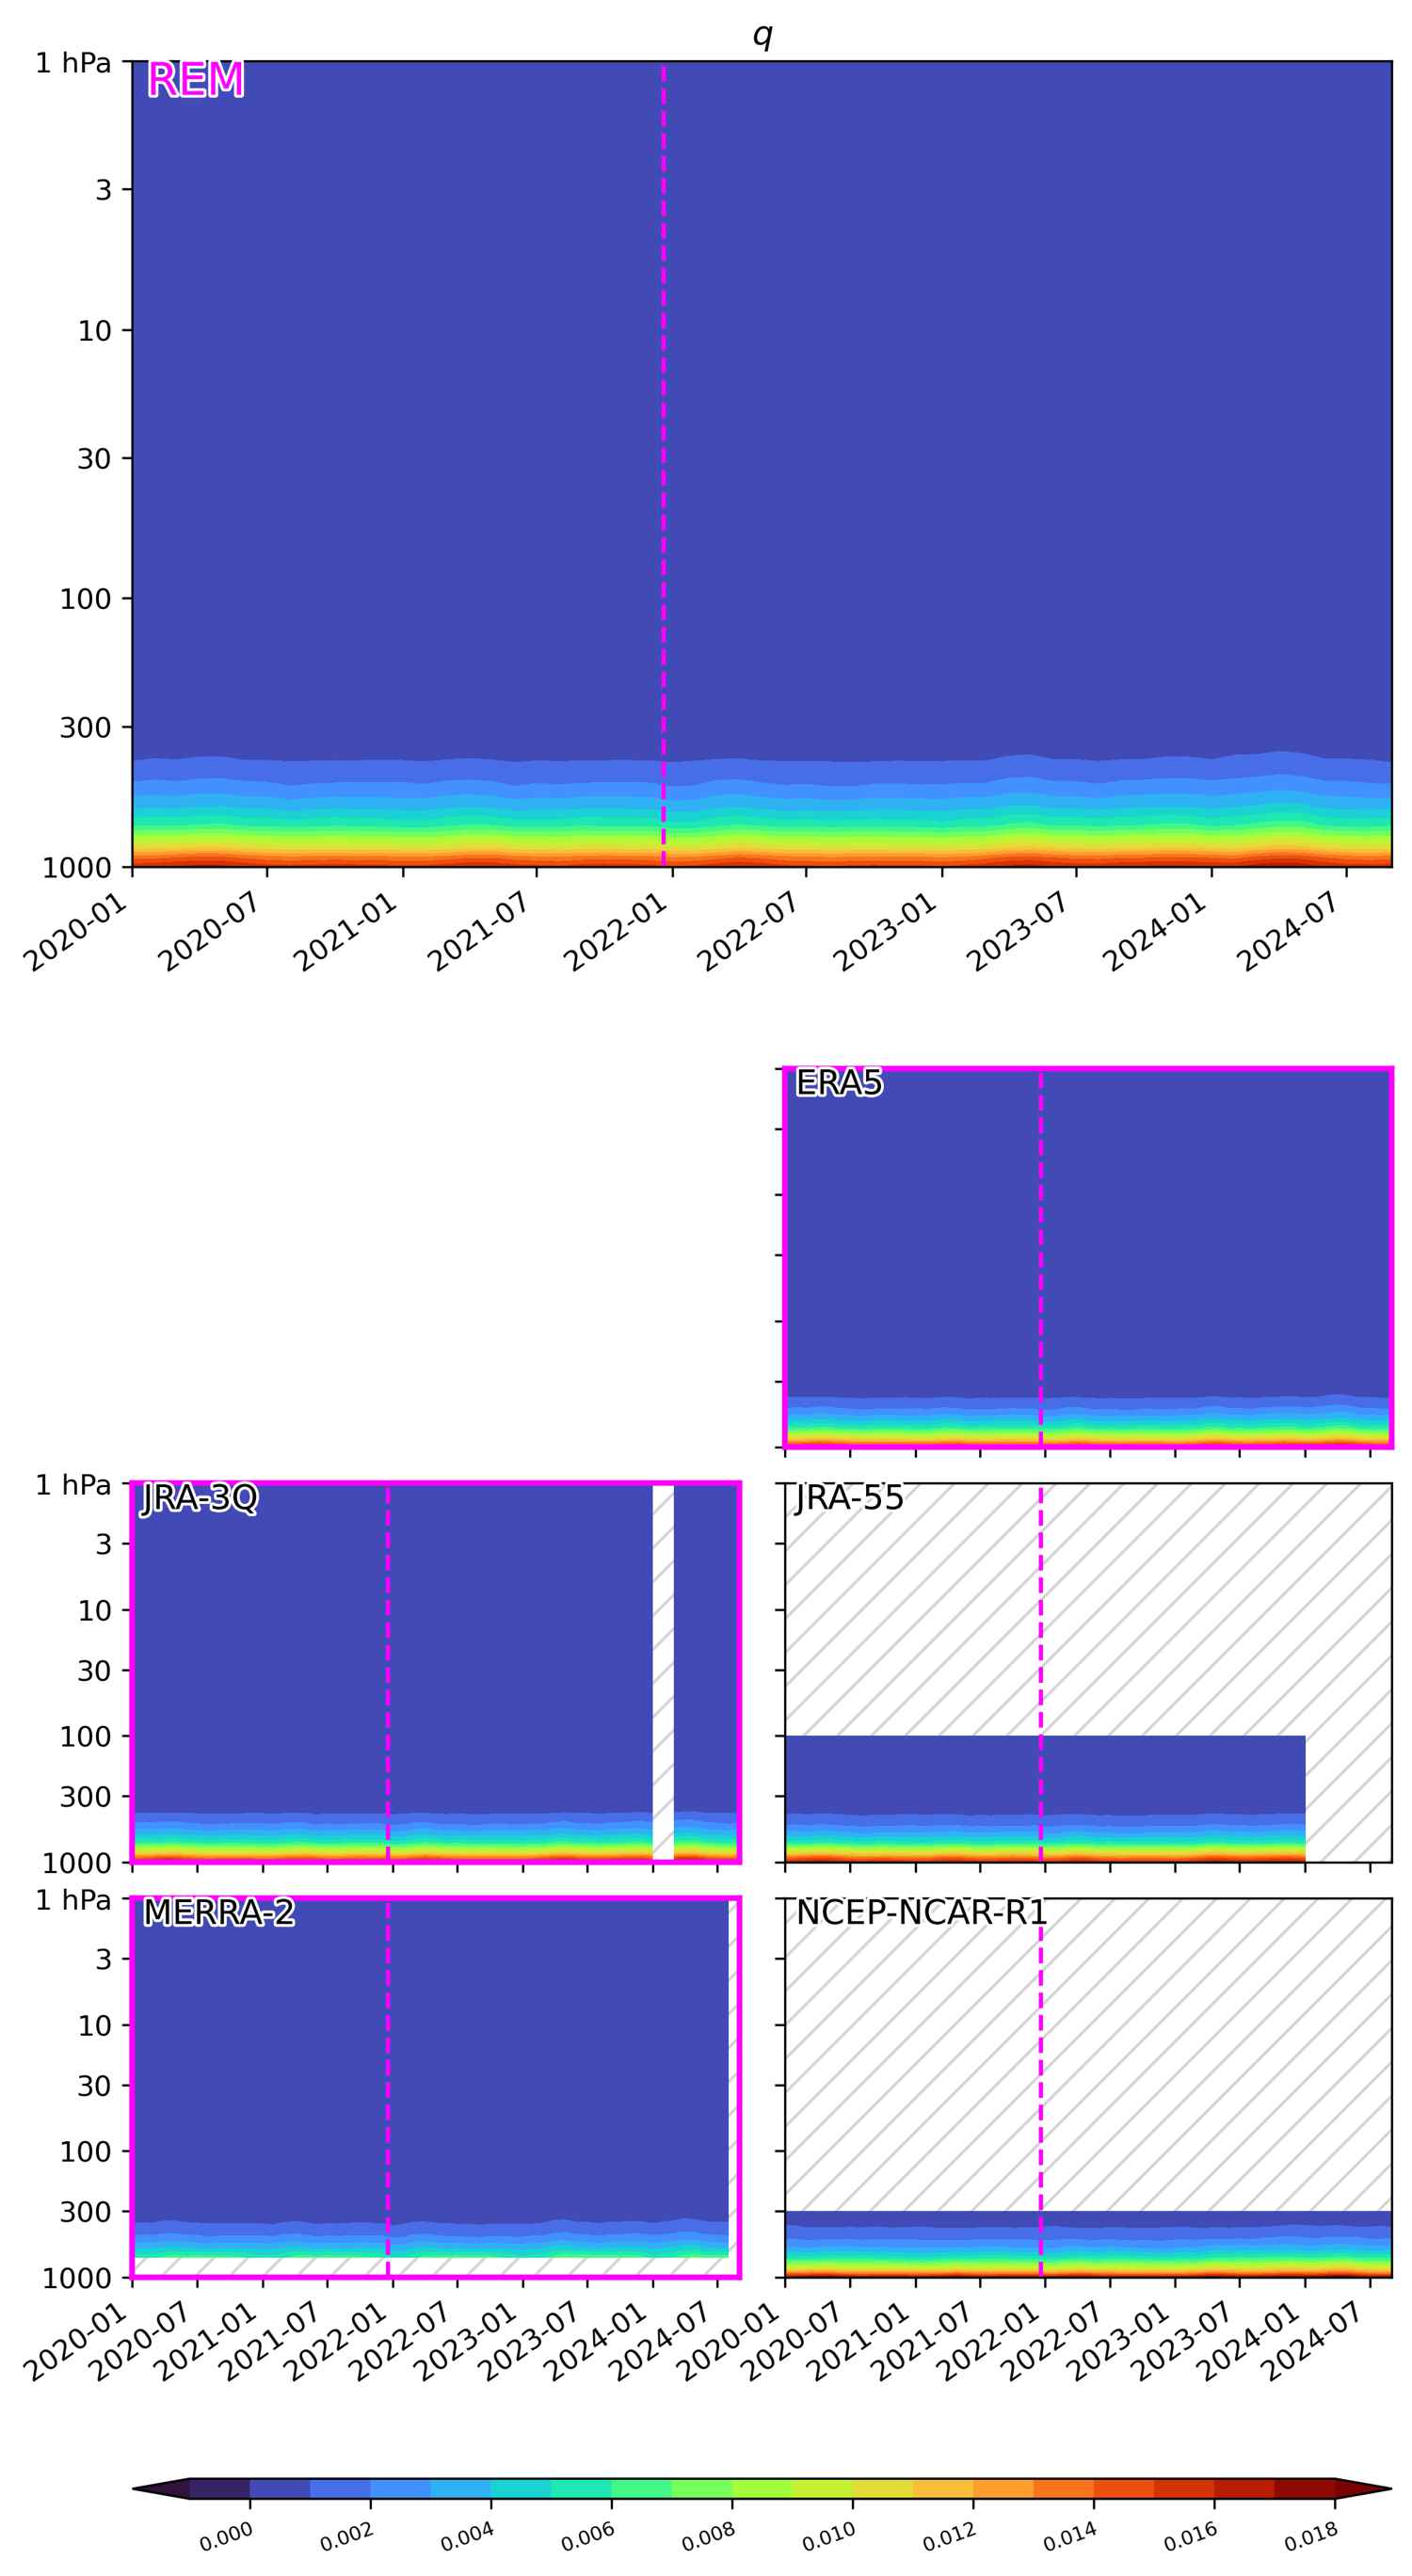
Absolute values (averaged over: 45N-89N)

(top) Reanalysis ensemble mean (REM) of “specific humidity” plotted as absolute values as a function of pressure and time. (below) Same but plotted for individual reanalyses. Reanalyses included in the REM are indicated with magenta borders. Unavailable data is hatched. The Hunga Tonga–Hunga Ha’apai eruption occured on 20 December 2021.
Anomalies as departure from the 2000-2022 monthly climatology (averaged over: 45N-89N)
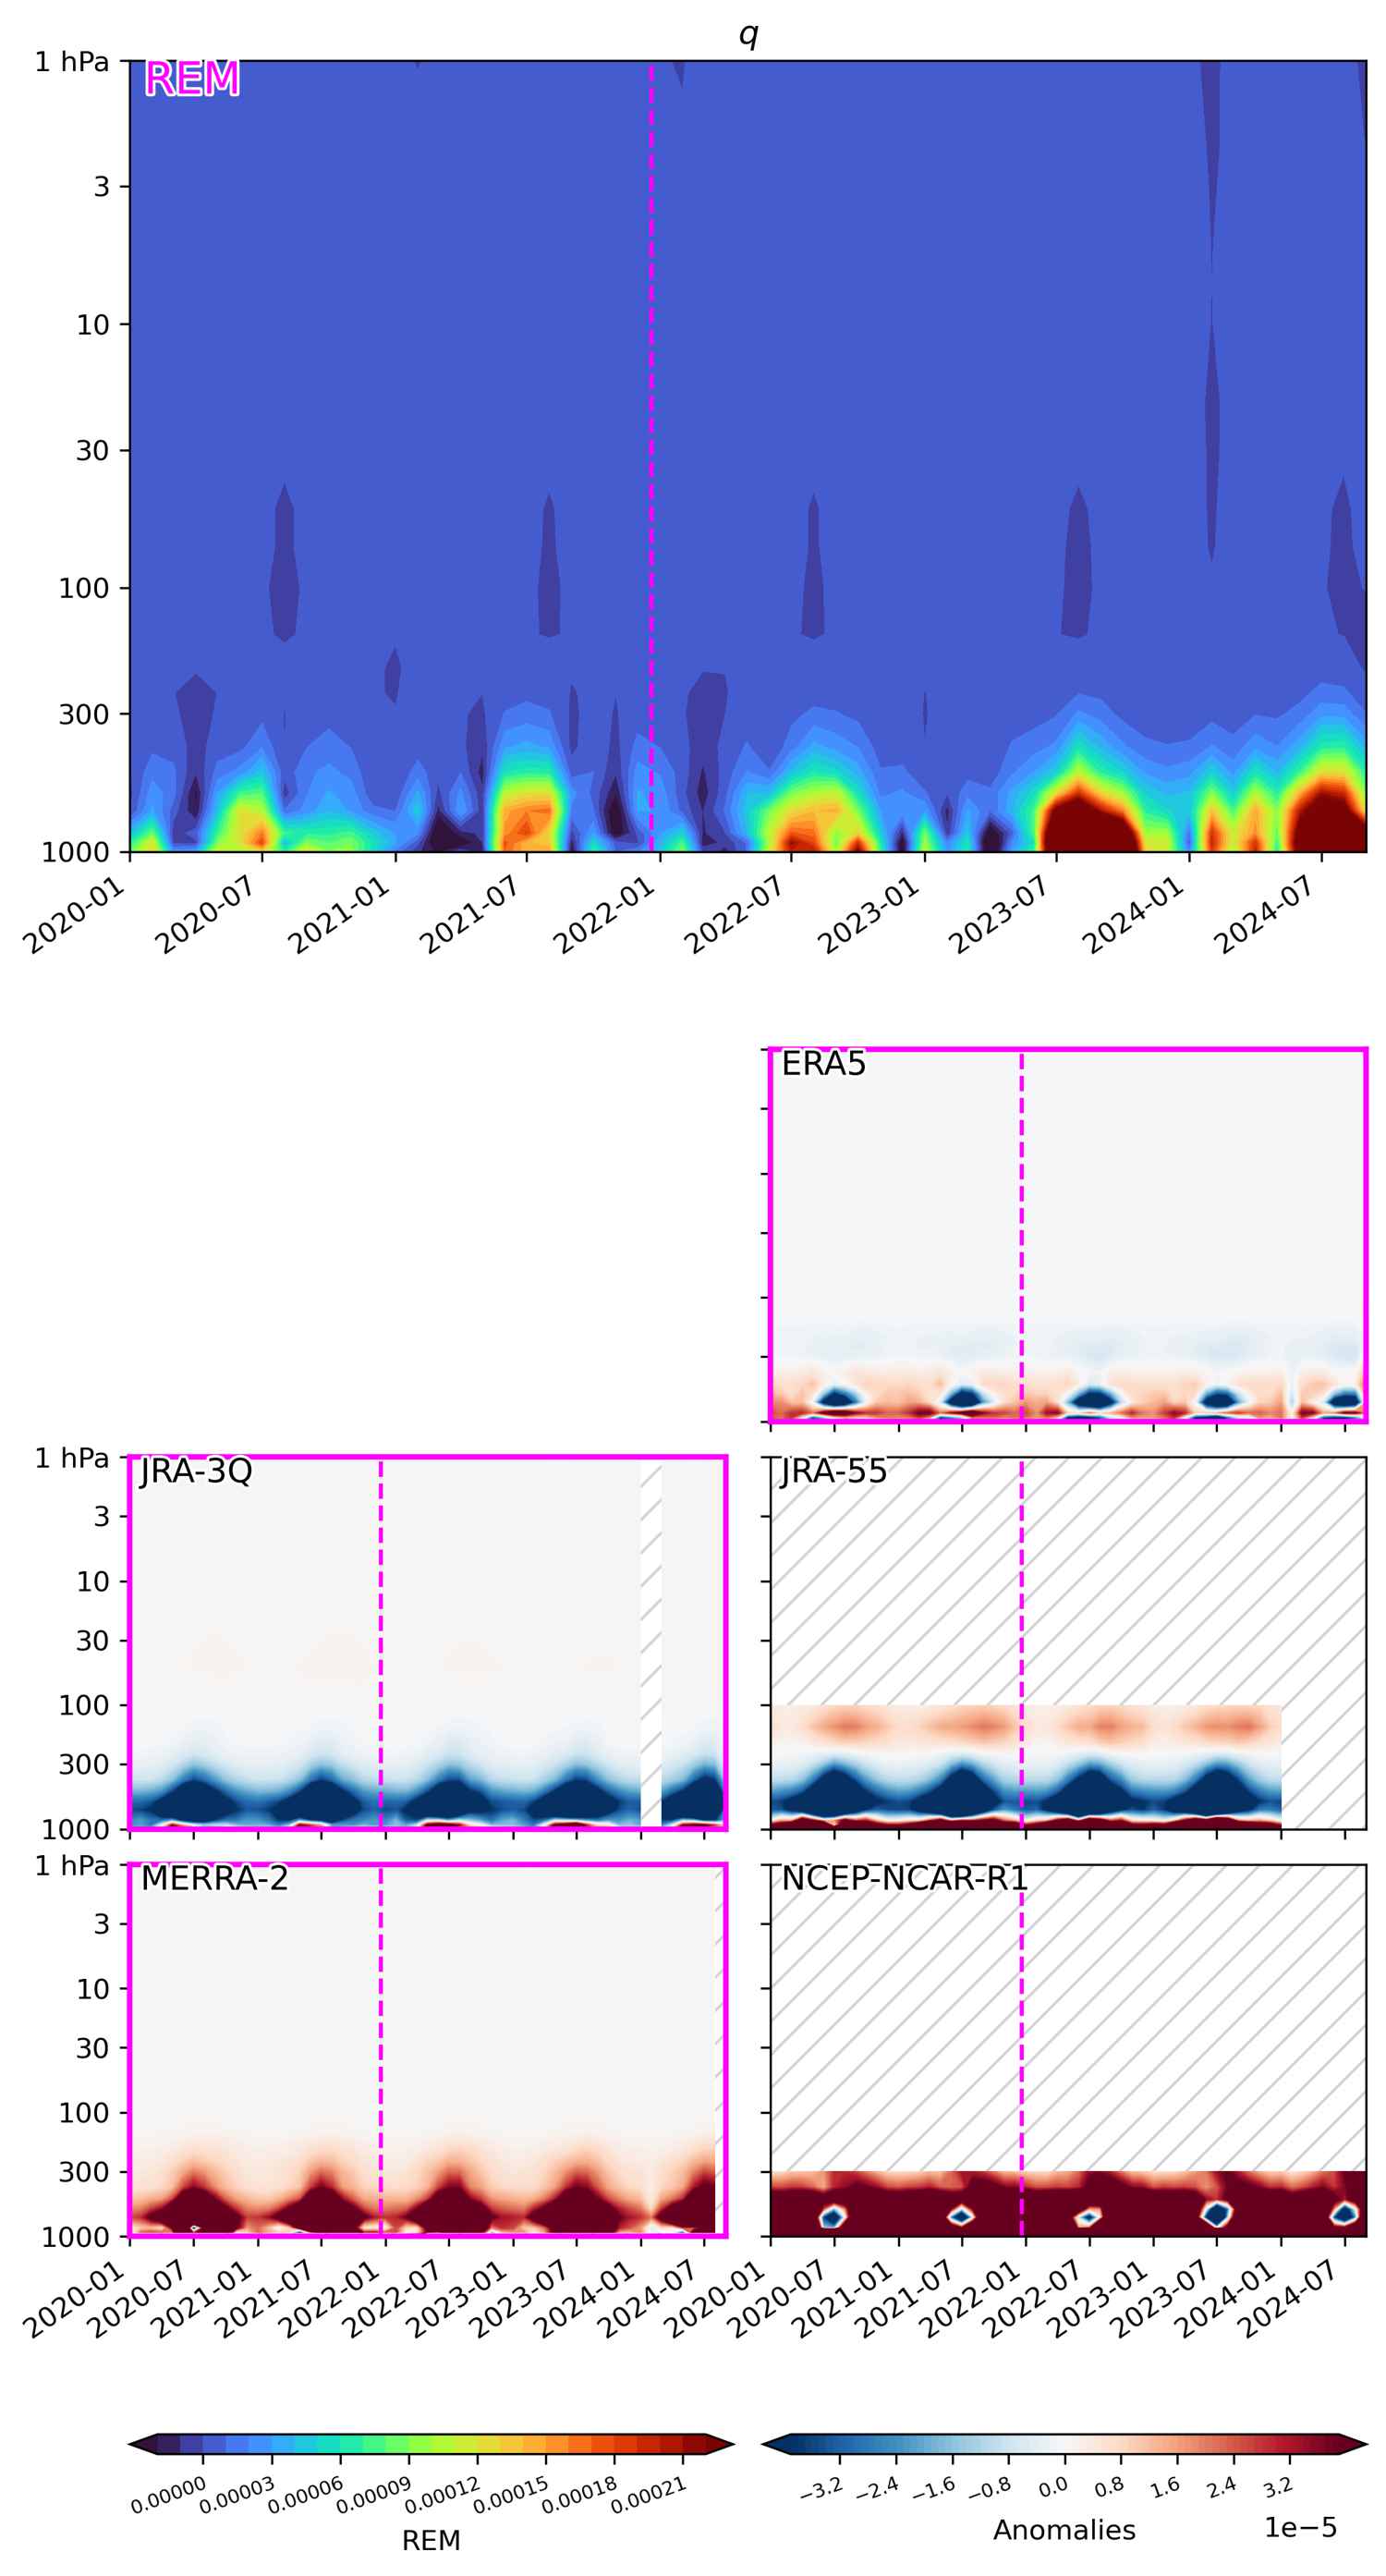
(top) Reanalysis ensemble mean (REM) of “specific humidity” plotted as anomalies as a function of pressure and time. (below) The anomaly with respect to the REM is plotted for individual reanalyses. Reanalyses included in the REM are indicated with magenta borders. Unavailable data is hatched. The Hunga Tonga–Hunga Ha’apai eruption occured on 20 December 2021.
Absolute values (averaged over: 89S-60S)
(top) Reanalysis ensemble mean (REM) of “specific humidity” plotted as absolute values as a function of pressure and time. (below) Same but plotted for individual reanalyses. Reanalyses included in the REM are indicated with magenta borders. Unavailable data is hatched. The Hunga Tonga–Hunga Ha’apai eruption occured on 20 December 2021.
Anomalies as departure from the 2000-2022 monthly climatology (averaged over: 89S-60S)
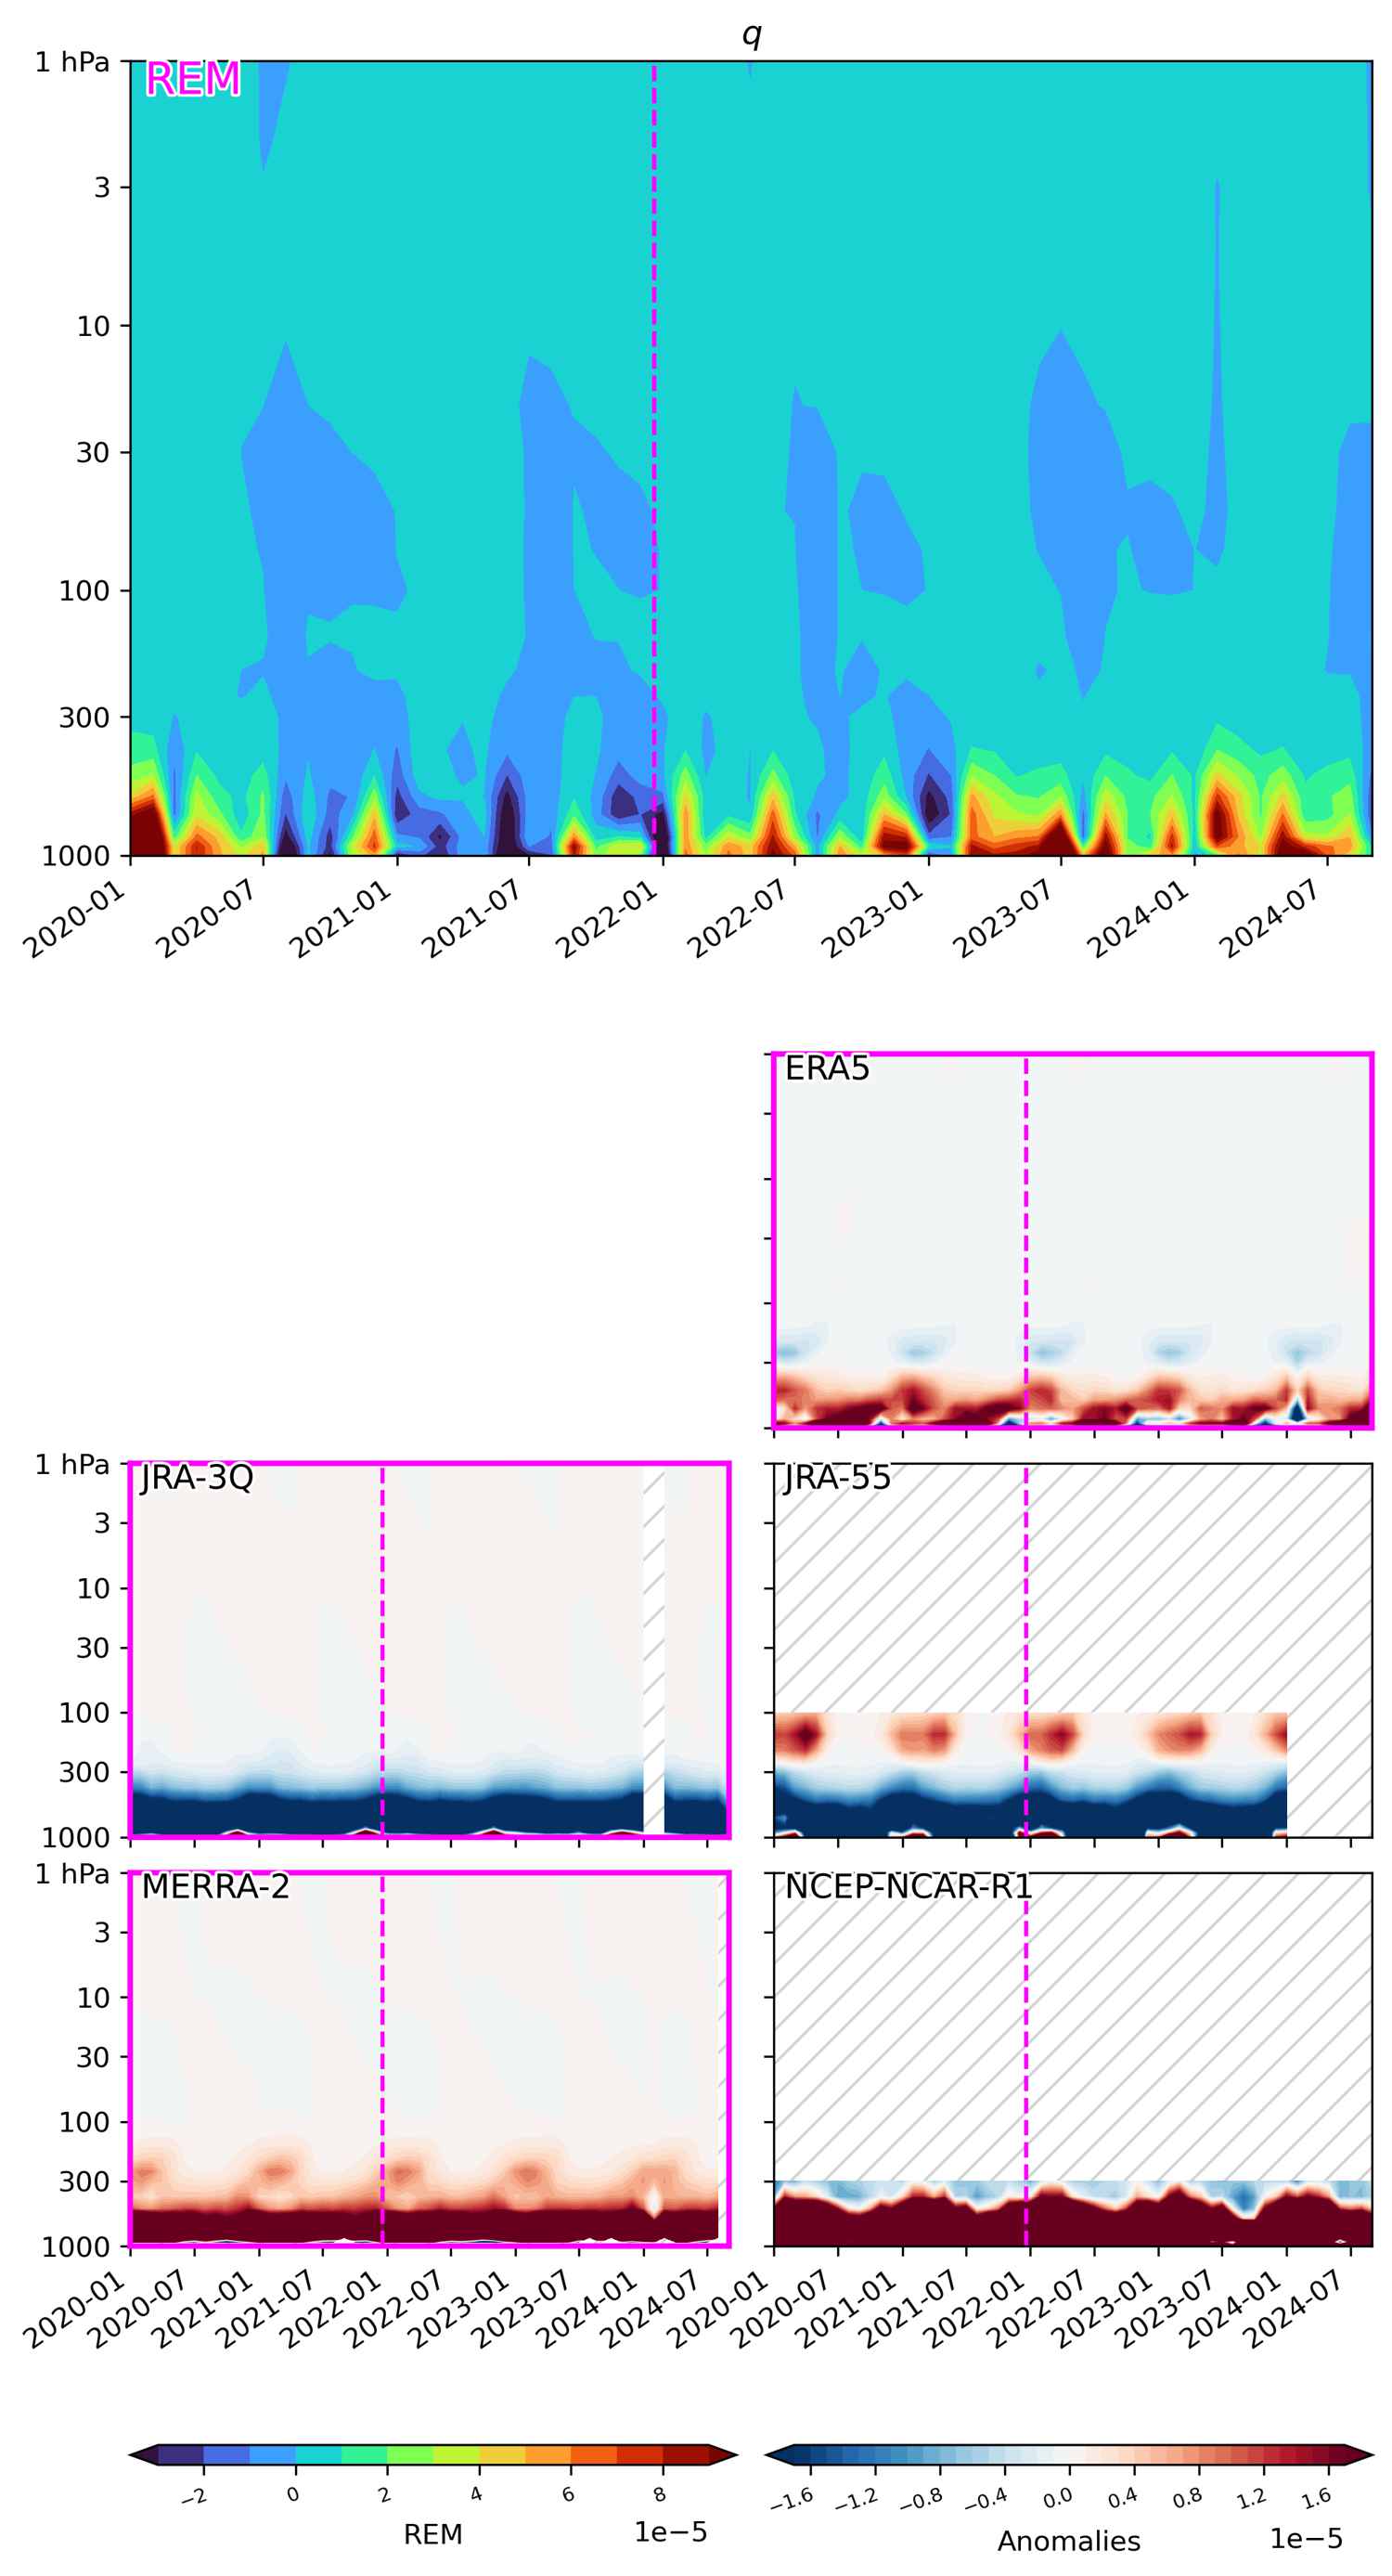
(top) Reanalysis ensemble mean (REM) of “specific humidity” plotted as anomalies as a function of pressure and time. (below) The anomaly with respect to the REM is plotted for individual reanalyses. Reanalyses included in the REM are indicated with magenta borders. Unavailable data is hatched. The Hunga Tonga–Hunga Ha’apai eruption occured on 20 December 2021.
Absolute values (averaged over: 89S-45S)
(top) Reanalysis ensemble mean (REM) of “specific humidity” plotted as absolute values as a function of pressure and time. (below) Same but plotted for individual reanalyses. Reanalyses included in the REM are indicated with magenta borders. Unavailable data is hatched. The Hunga Tonga–Hunga Ha’apai eruption occured on 20 December 2021.
Absolute values (averaged over: 45N-89N)
(top) Reanalysis ensemble mean (REM) of “specific humidity” plotted as absolute values as a function of pressure and time. (below) Same but plotted for individual reanalyses. Reanalyses included in the REM are indicated with magenta borders. Unavailable data is hatched. The Hunga Tonga–Hunga Ha’apai eruption occured on 20 December 2021.
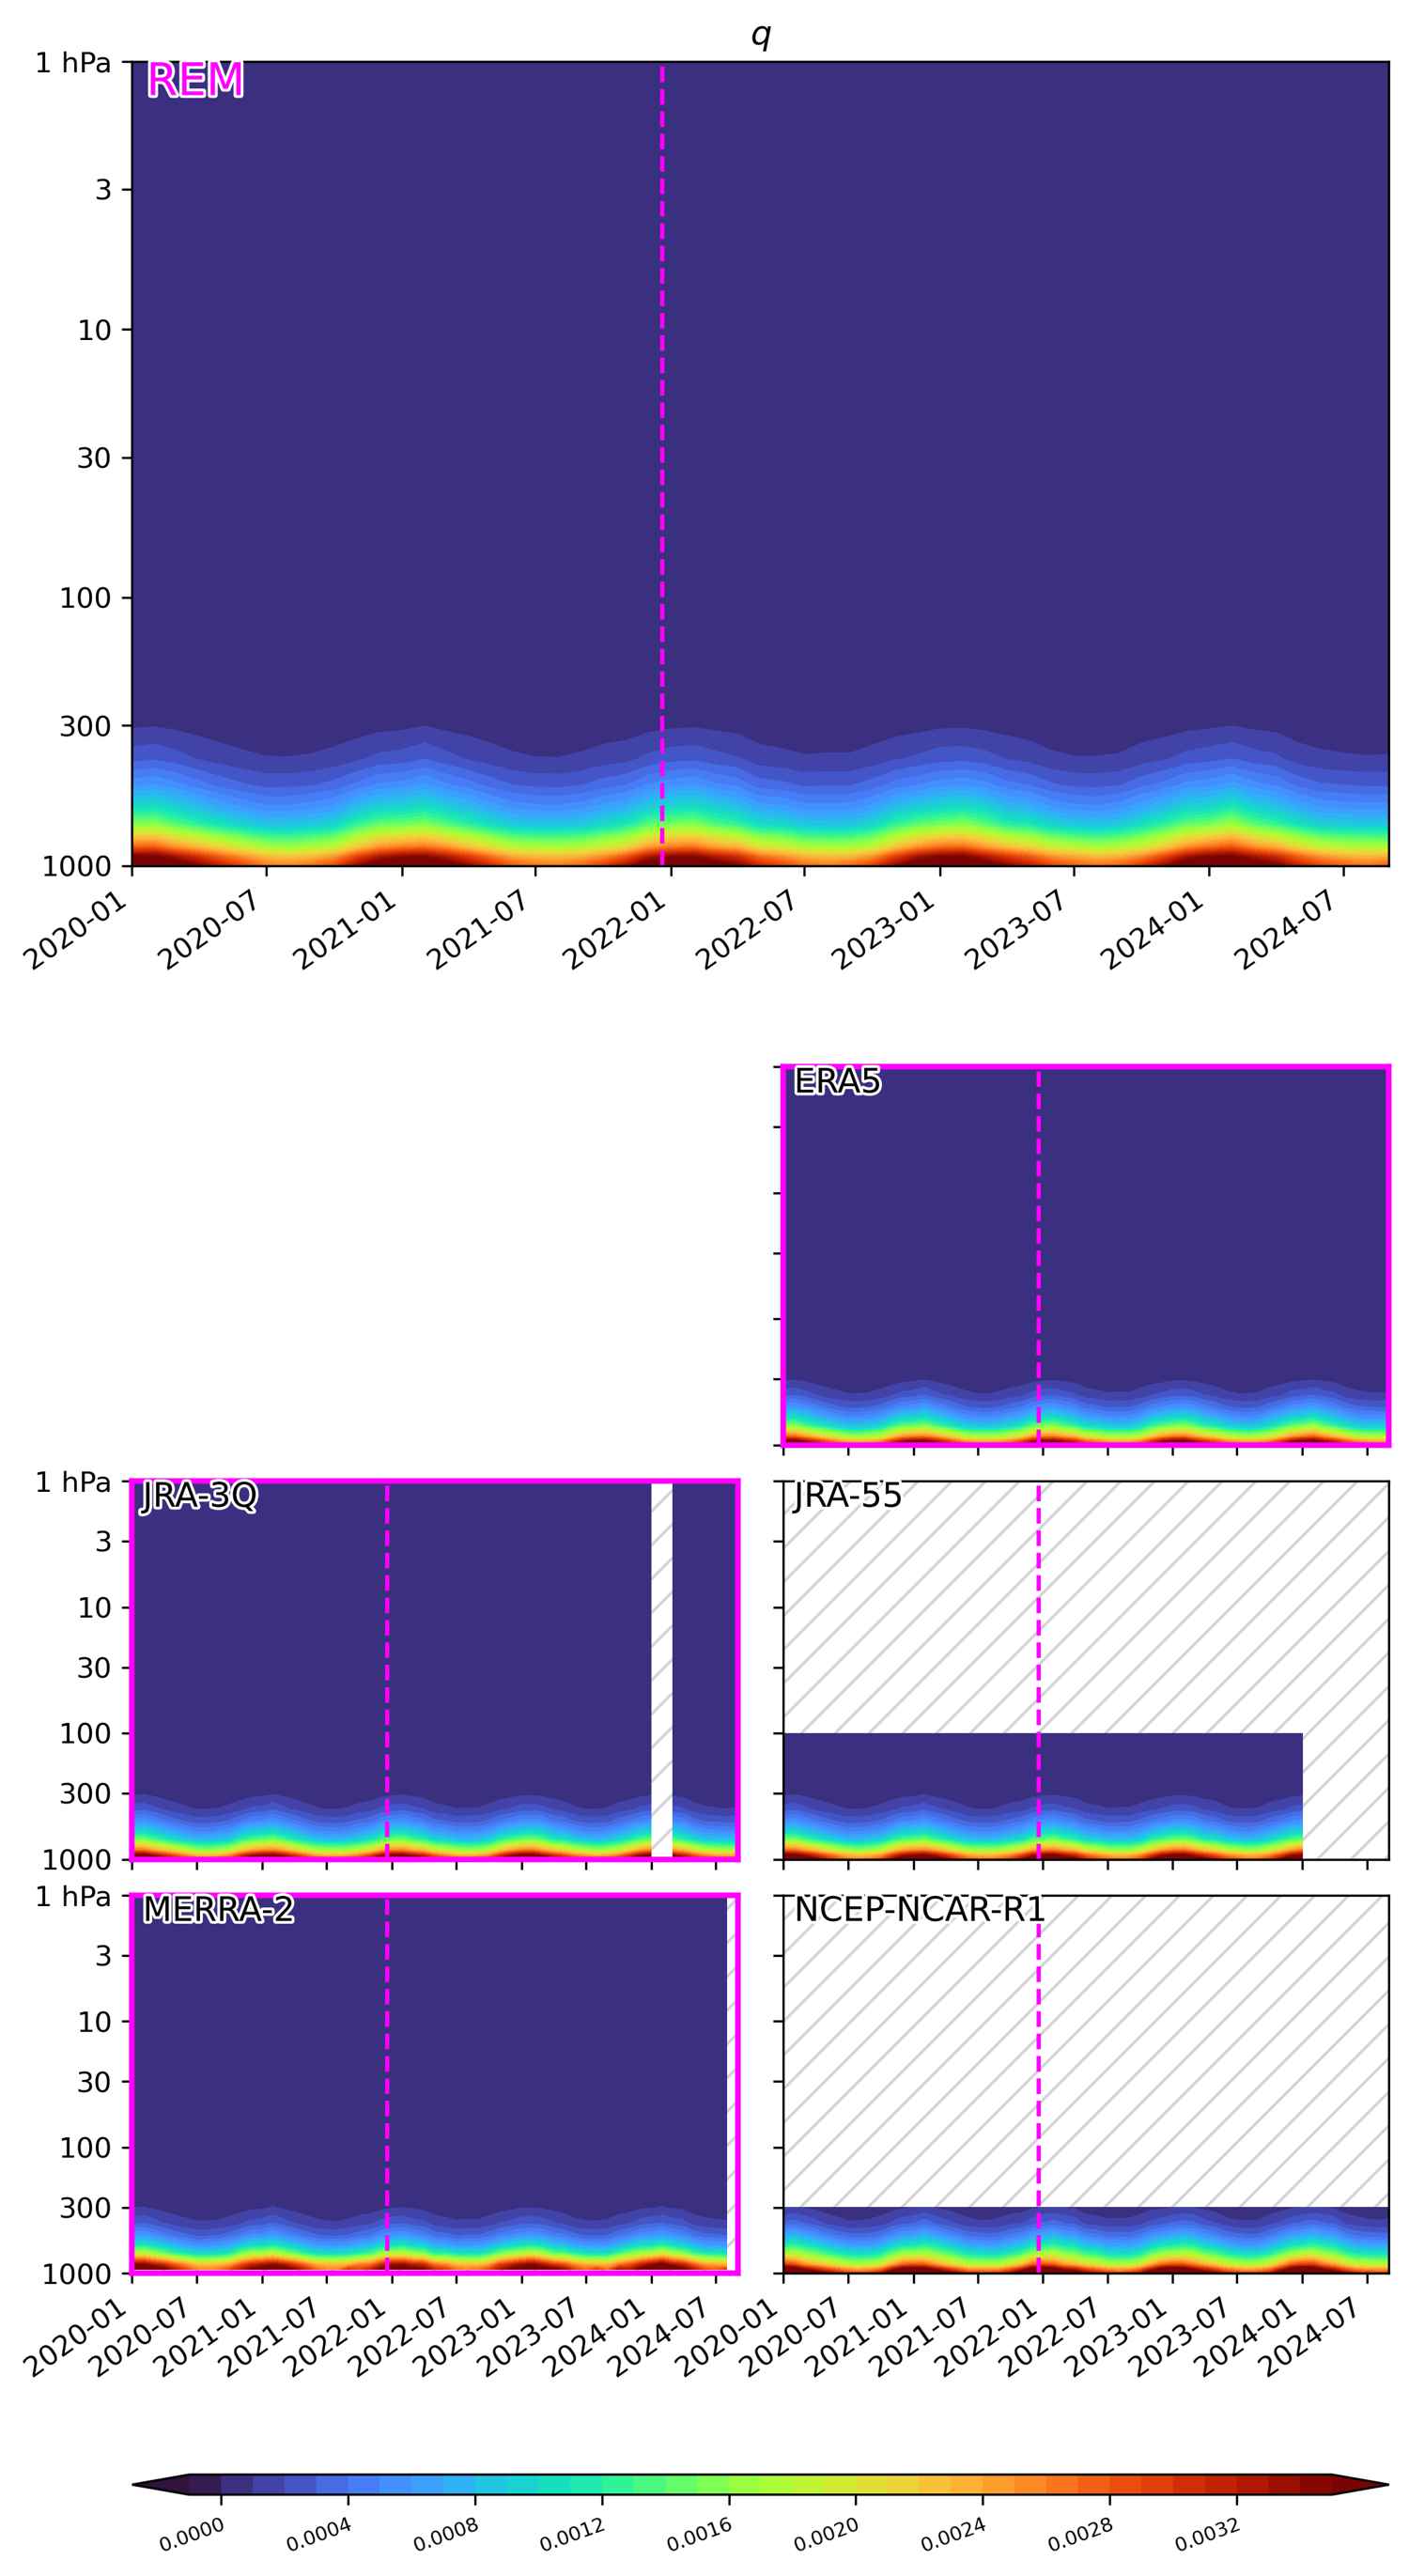
Absolute values (averaged over: 60S-30S)
(top) Reanalysis ensemble mean (REM) of “specific humidity” plotted as absolute values as a function of pressure and time. (below) Same but plotted for individual reanalyses. Reanalyses included in the REM are indicated with magenta borders. Unavailable data is hatched. The Hunga Tonga–Hunga Ha’apai eruption occured on 20 December 2021.
Anomalies as departure from the 2000-2022 monthly climatology (averaged over: 60S-30S)
(top) Reanalysis ensemble mean (REM) of “specific humidity” plotted as anomalies as a function of pressure and time. (below) The anomaly with respect to the REM is plotted for individual reanalyses. Reanalyses included in the REM are indicated with magenta borders. Unavailable data is hatched. The Hunga Tonga–Hunga Ha’apai eruption occured on 20 December 2021.
Anomalies as departure from the 2000-2022 monthly climatology (averaged over: 45N-89N)
(top) Reanalysis ensemble mean (REM) of “specific humidity” plotted as anomalies as a function of pressure and time. (below) The anomaly with respect to the REM is plotted for individual reanalyses. Reanalyses included in the REM are indicated with magenta borders. Unavailable data is hatched. The Hunga Tonga–Hunga Ha’apai eruption occured on 20 December 2021.
Absolute values (averaged over: 89S-60S)
(top) Reanalysis ensemble mean (REM) of “specific humidity” plotted as absolute values as a function of pressure and time. (below) Same but plotted for individual reanalyses. Reanalyses included in the REM are indicated with magenta borders. Unavailable data is hatched. The Hunga Tonga–Hunga Ha’apai eruption occured on 20 December 2021.
Anomalies as departure from the 2000-2022 monthly climatology (averaged over: 89S-60S)
(top) Reanalysis ensemble mean (REM) of “specific humidity” plotted as anomalies as a function of pressure and time. (below) The anomaly with respect to the REM is plotted for individual reanalyses. Reanalyses included in the REM are indicated with magenta borders. Unavailable data is hatched. The Hunga Tonga–Hunga Ha’apai eruption occured on 20 December 2021.
Absolute values (averaged over: 60S-30S)
(top) Reanalysis ensemble mean (REM) of “specific humidity” plotted as absolute values as a function of pressure and time. (below) Same but plotted for individual reanalyses. Reanalyses included in the REM are indicated with magenta borders. Unavailable data is hatched. The Hunga Tonga–Hunga Ha’apai eruption occured on 20 December 2021.
Absolute values (averaged over: 89S-45S)
(top) Reanalysis ensemble mean (REM) of “specific humidity” plotted as absolute values as a function of pressure and time. (below) Same but plotted for individual reanalyses. Reanalyses included in the REM are indicated with magenta borders. Unavailable data is hatched. The Hunga Tonga–Hunga Ha’apai eruption occured on 20 December 2021.
Anomalies as departure from the 2000-2022 monthly climatology (averaged over: 89S-45S)
(top) Reanalysis ensemble mean (REM) of “specific humidity” plotted as anomalies as a function of pressure and time. (below) The anomaly with respect to the REM is plotted for individual reanalyses. Reanalyses included in the REM are indicated with magenta borders. Unavailable data is hatched. The Hunga Tonga–Hunga Ha’apai eruption occured on 20 December 2021.
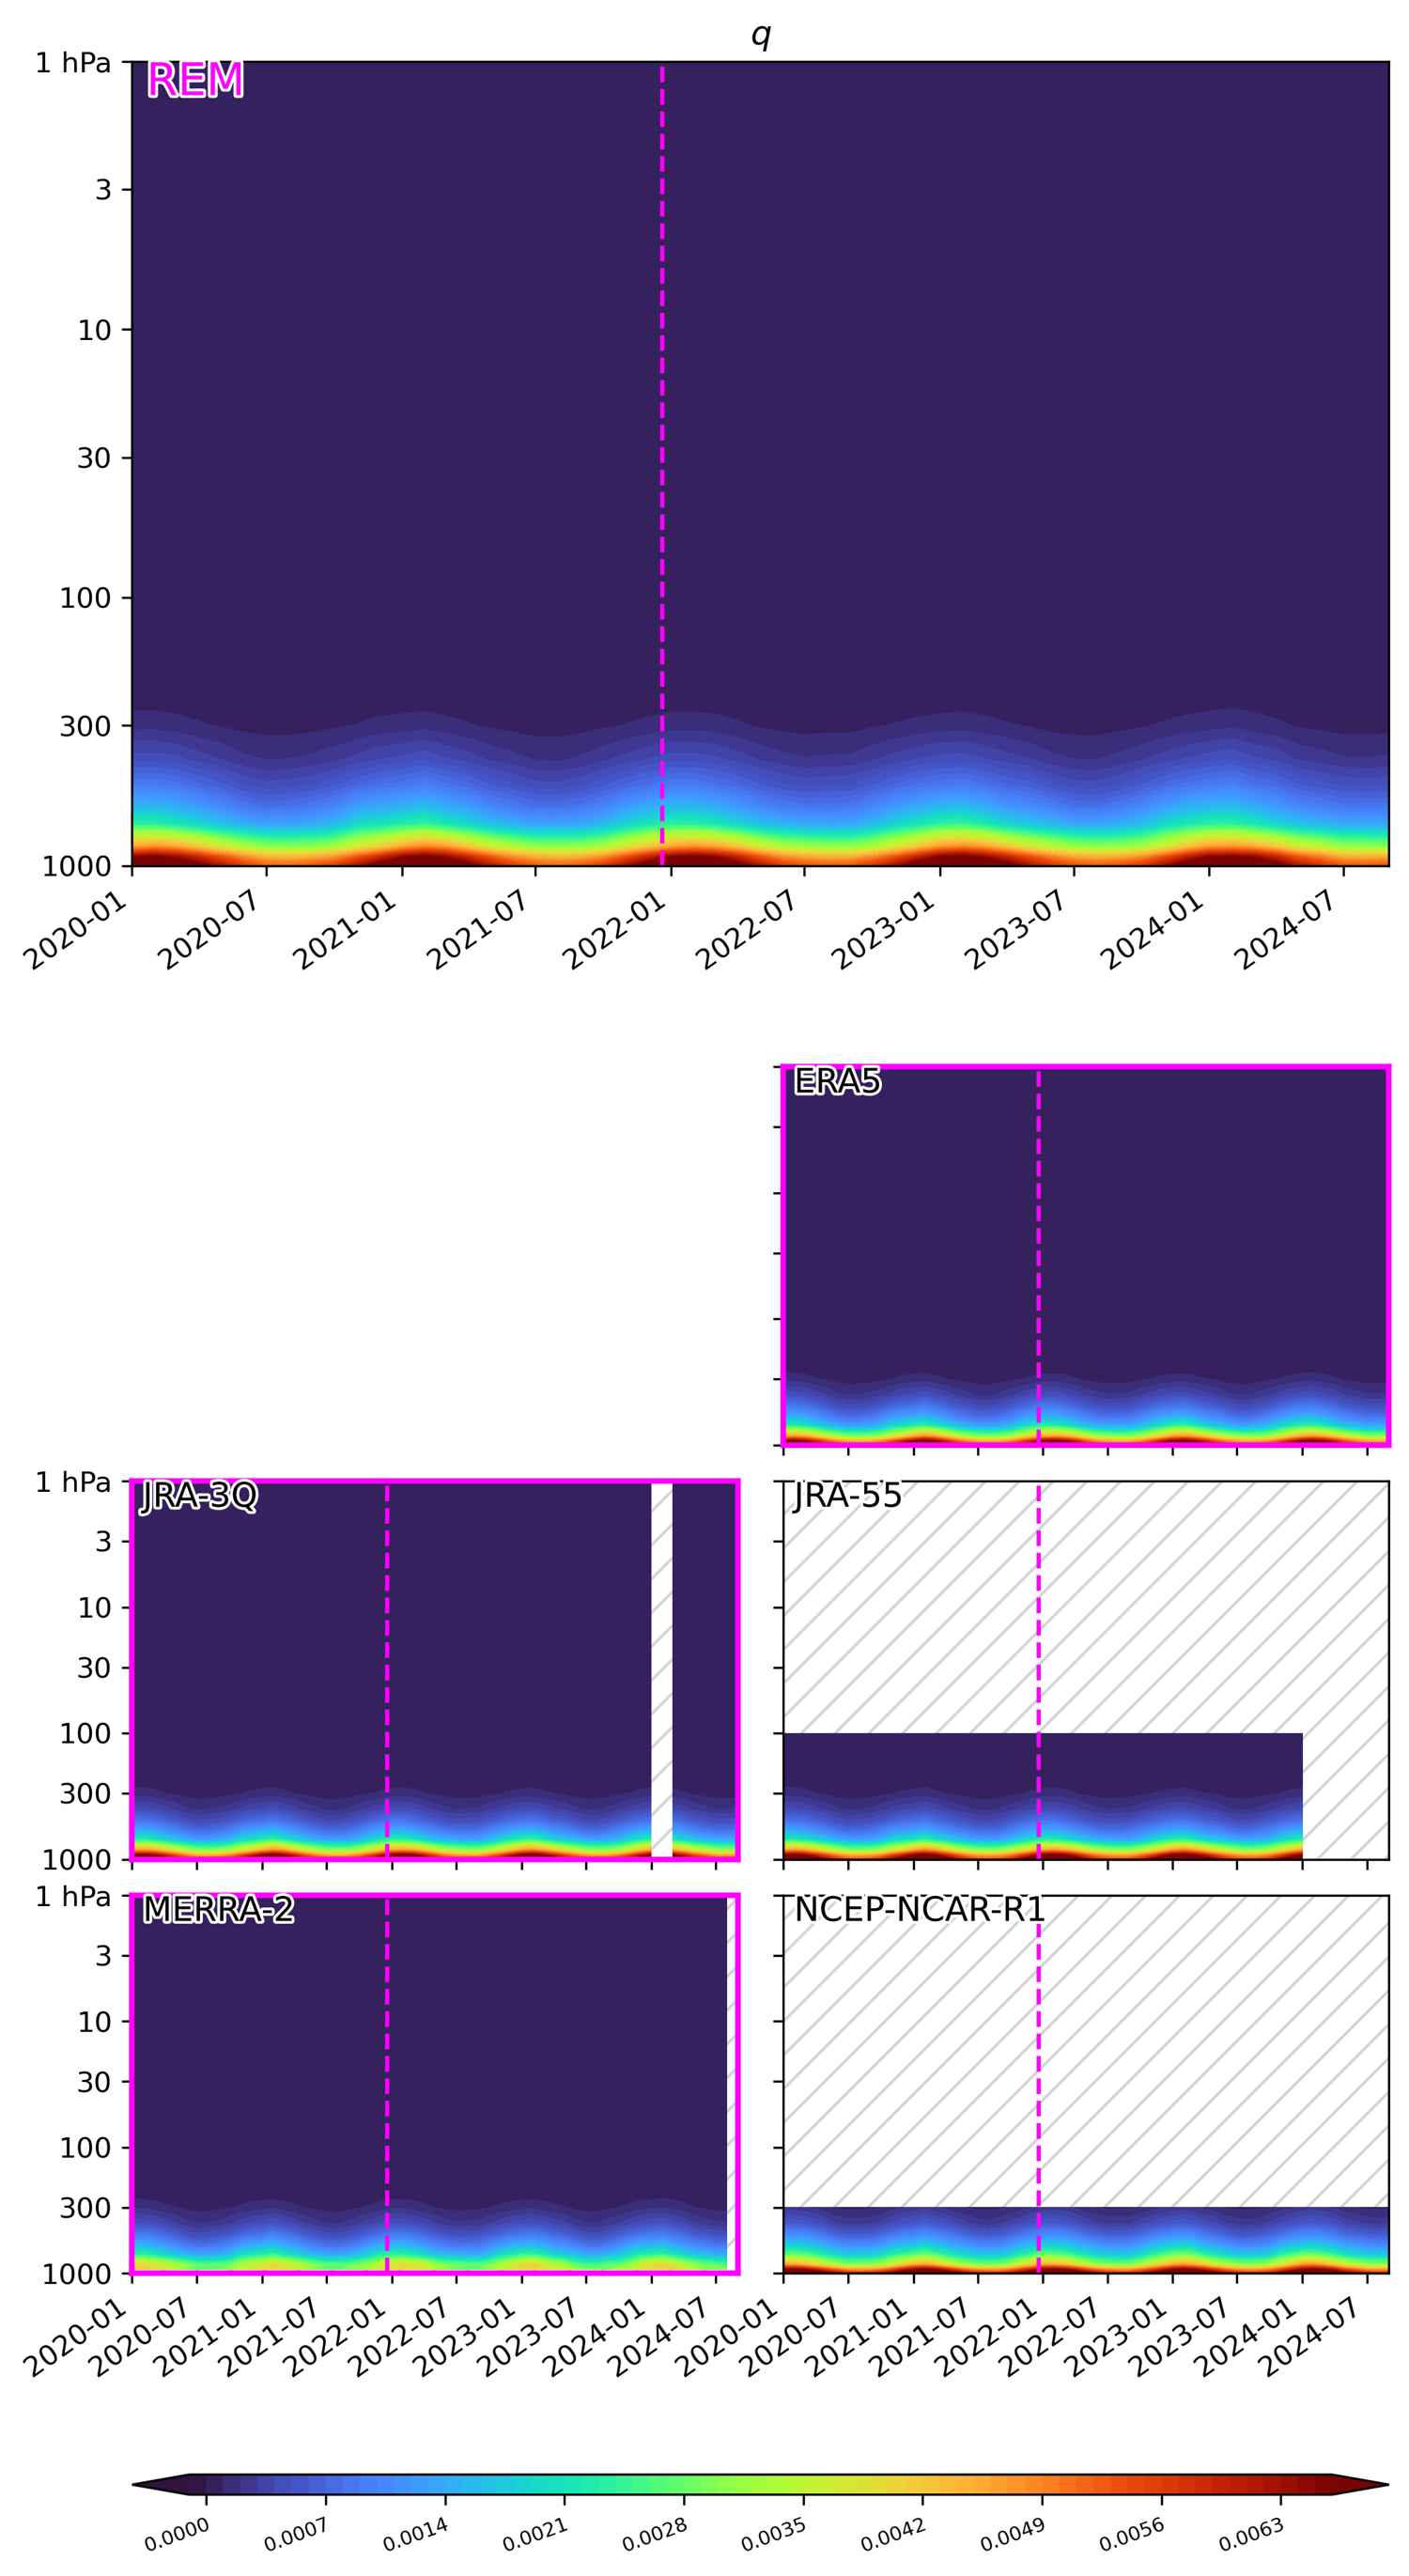
Absolute values (averaged over: 15S-15N)
(top) Reanalysis ensemble mean (REM) of “specific humidity” plotted as absolute values as a function of pressure and time. (below) Same but plotted for individual reanalyses. Reanalyses included in the REM are indicated with magenta borders. Unavailable data is hatched. The Hunga Tonga–Hunga Ha’apai eruption occured on 20 December 2021.
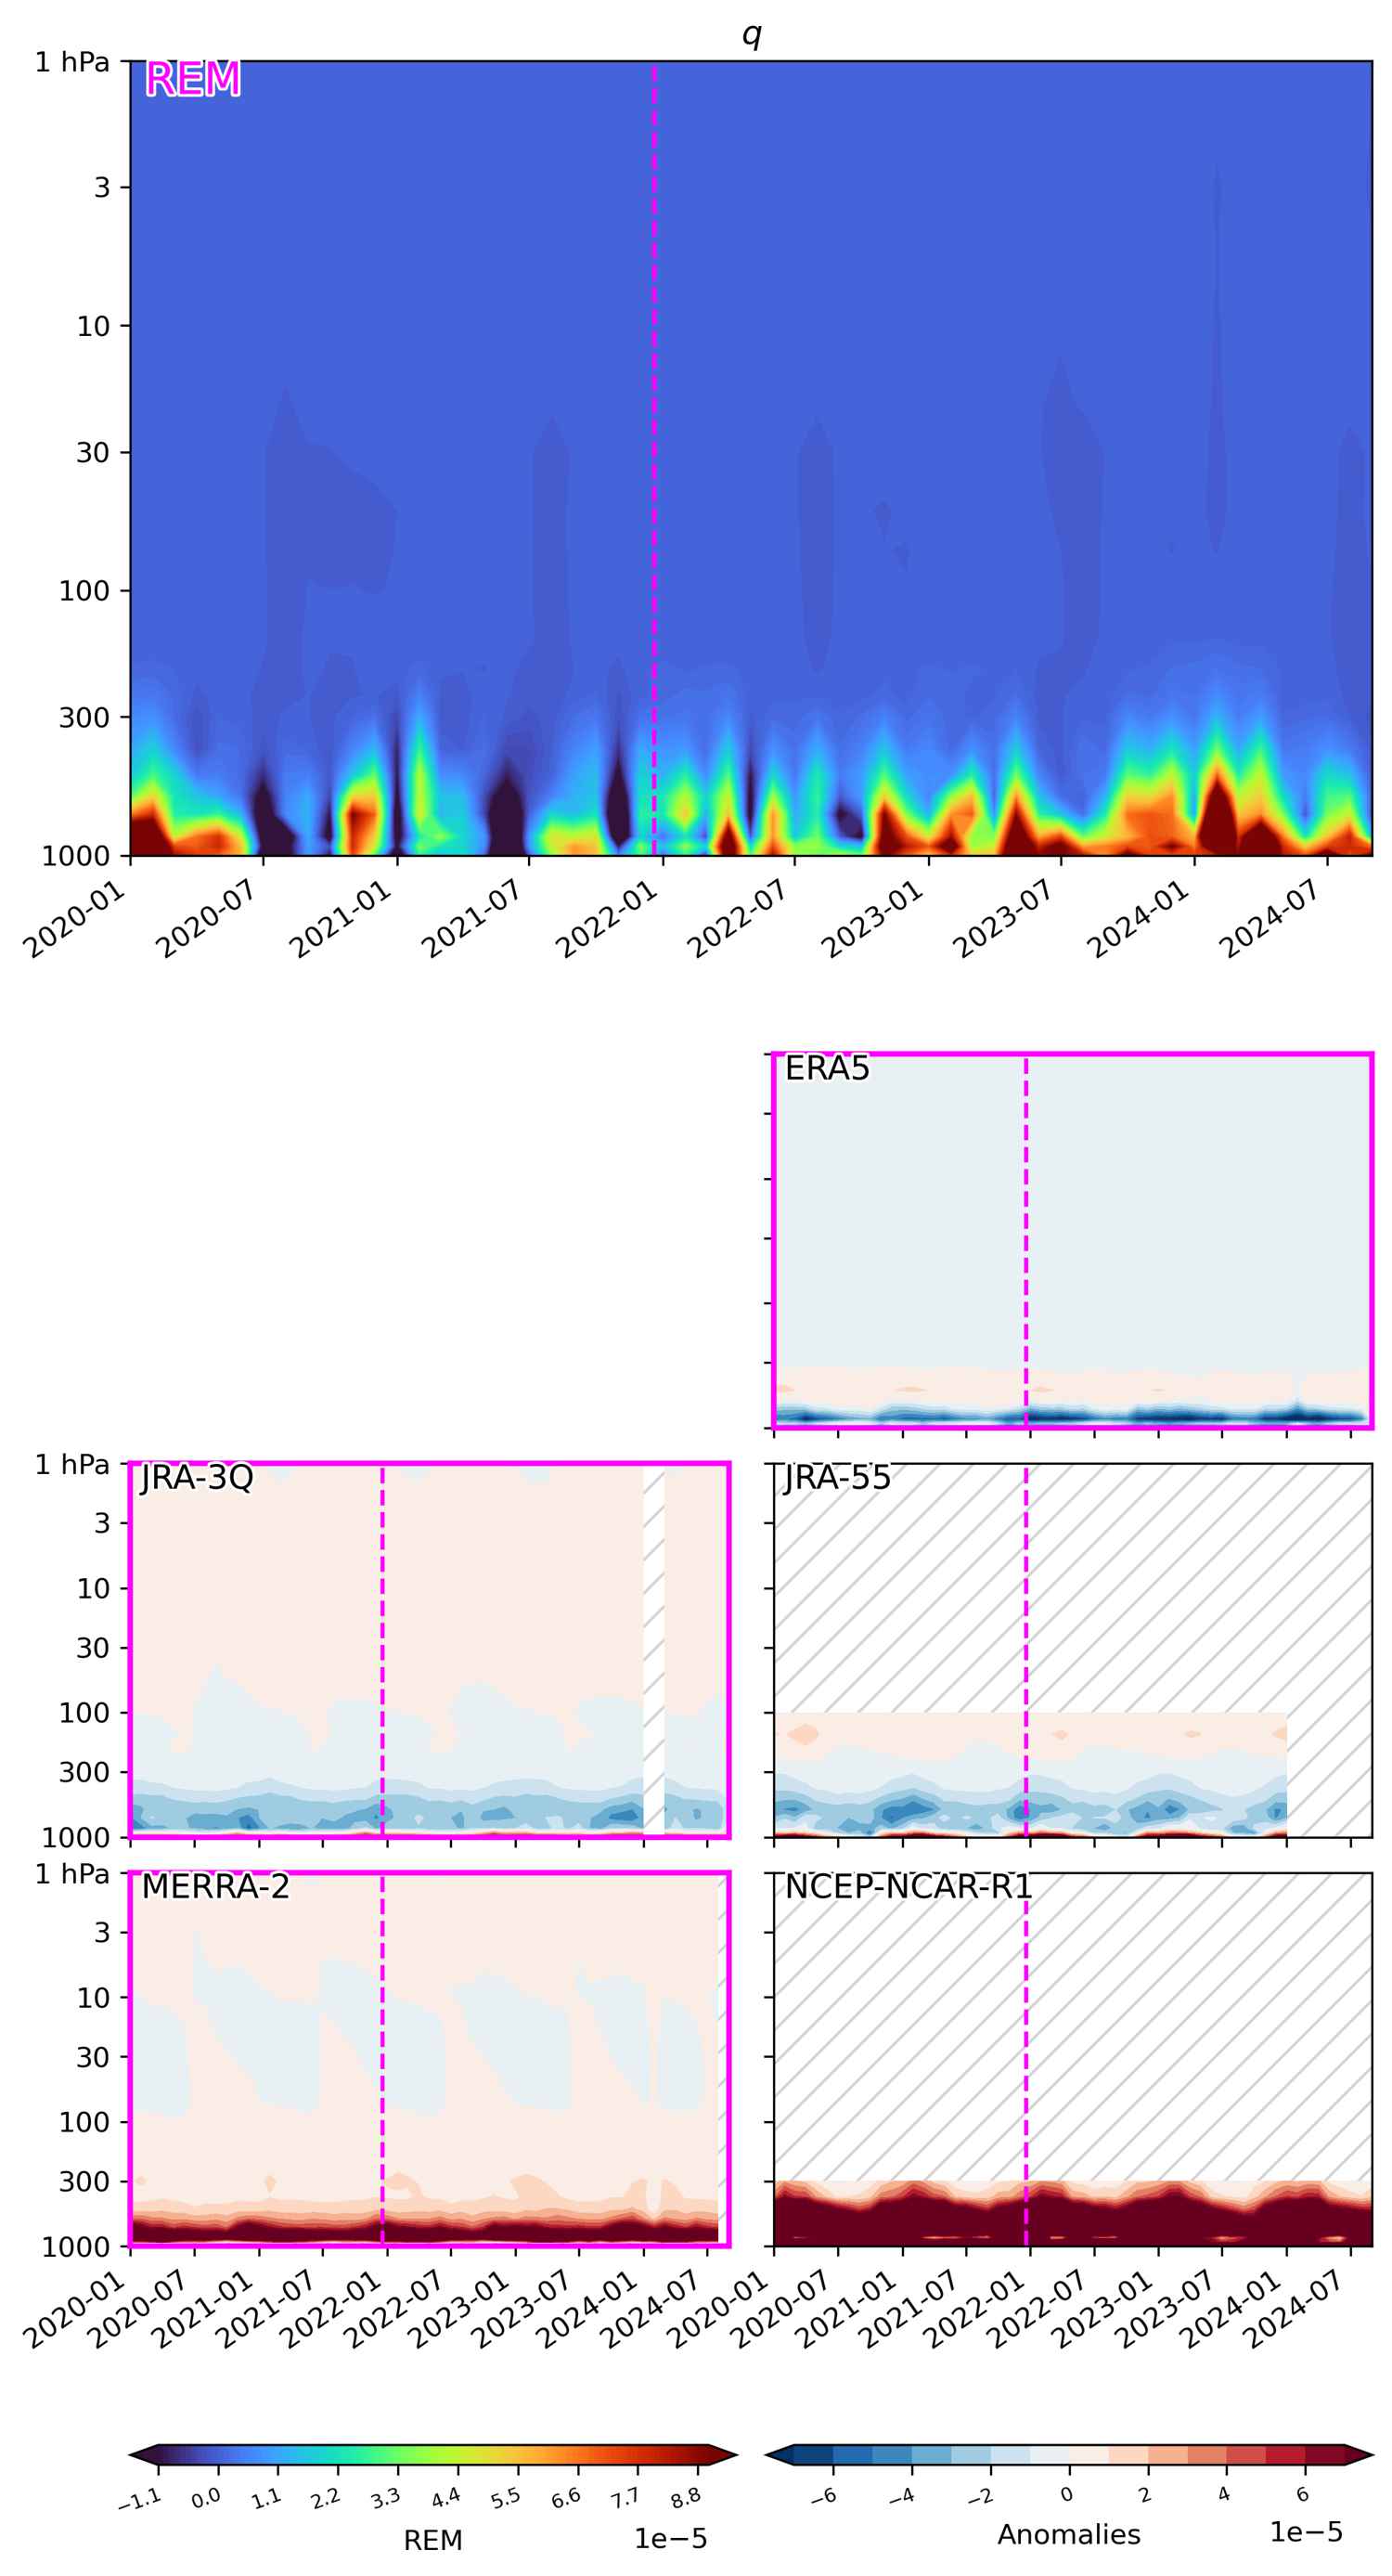
Anomalies as departure from the 2000-2022 monthly climatology (averaged over: 15S-15N)
(top) Reanalysis ensemble mean (REM) of “specific humidity” plotted as anomalies as a function of pressure and time. (below) The anomaly with respect to the REM is plotted for individual reanalyses. Reanalyses included in the REM are indicated with magenta borders. Unavailable data is hatched. The Hunga Tonga–Hunga Ha’apai eruption occured on 20 December 2021.
Anomalies as departure from the 2000-2022 monthly climatology (averaged over: 89S-45S)
(top) Reanalysis ensemble mean (REM) of “specific humidity” plotted as anomalies as a function of pressure and time. (below) The anomaly with respect to the REM is plotted for individual reanalyses. Reanalyses included in the REM are indicated with magenta borders. Unavailable data is hatched. The Hunga Tonga–Hunga Ha’apai eruption occured on 20 December 2021.
Absolute values (averaged over: 15S-15N)
(top) Reanalysis ensemble mean (REM) of “specific humidity” plotted as absolute values as a function of pressure and time. (below) Same but plotted for individual reanalyses. Reanalyses included in the REM are indicated with magenta borders. Unavailable data is hatched. The Hunga Tonga–Hunga Ha’apai eruption occured on 20 December 2021.
Anomalies as departure from the 2000-2022 monthly climatology (averaged over: 15S-15N)
(top) Reanalysis ensemble mean (REM) of “specific humidity” plotted as anomalies as a function of pressure and time. (below) The anomaly with respect to the REM is plotted for individual reanalyses. Reanalyses included in the REM are indicated with magenta borders. Unavailable data is hatched. The Hunga Tonga–Hunga Ha’apai eruption occured on 20 December 2021.