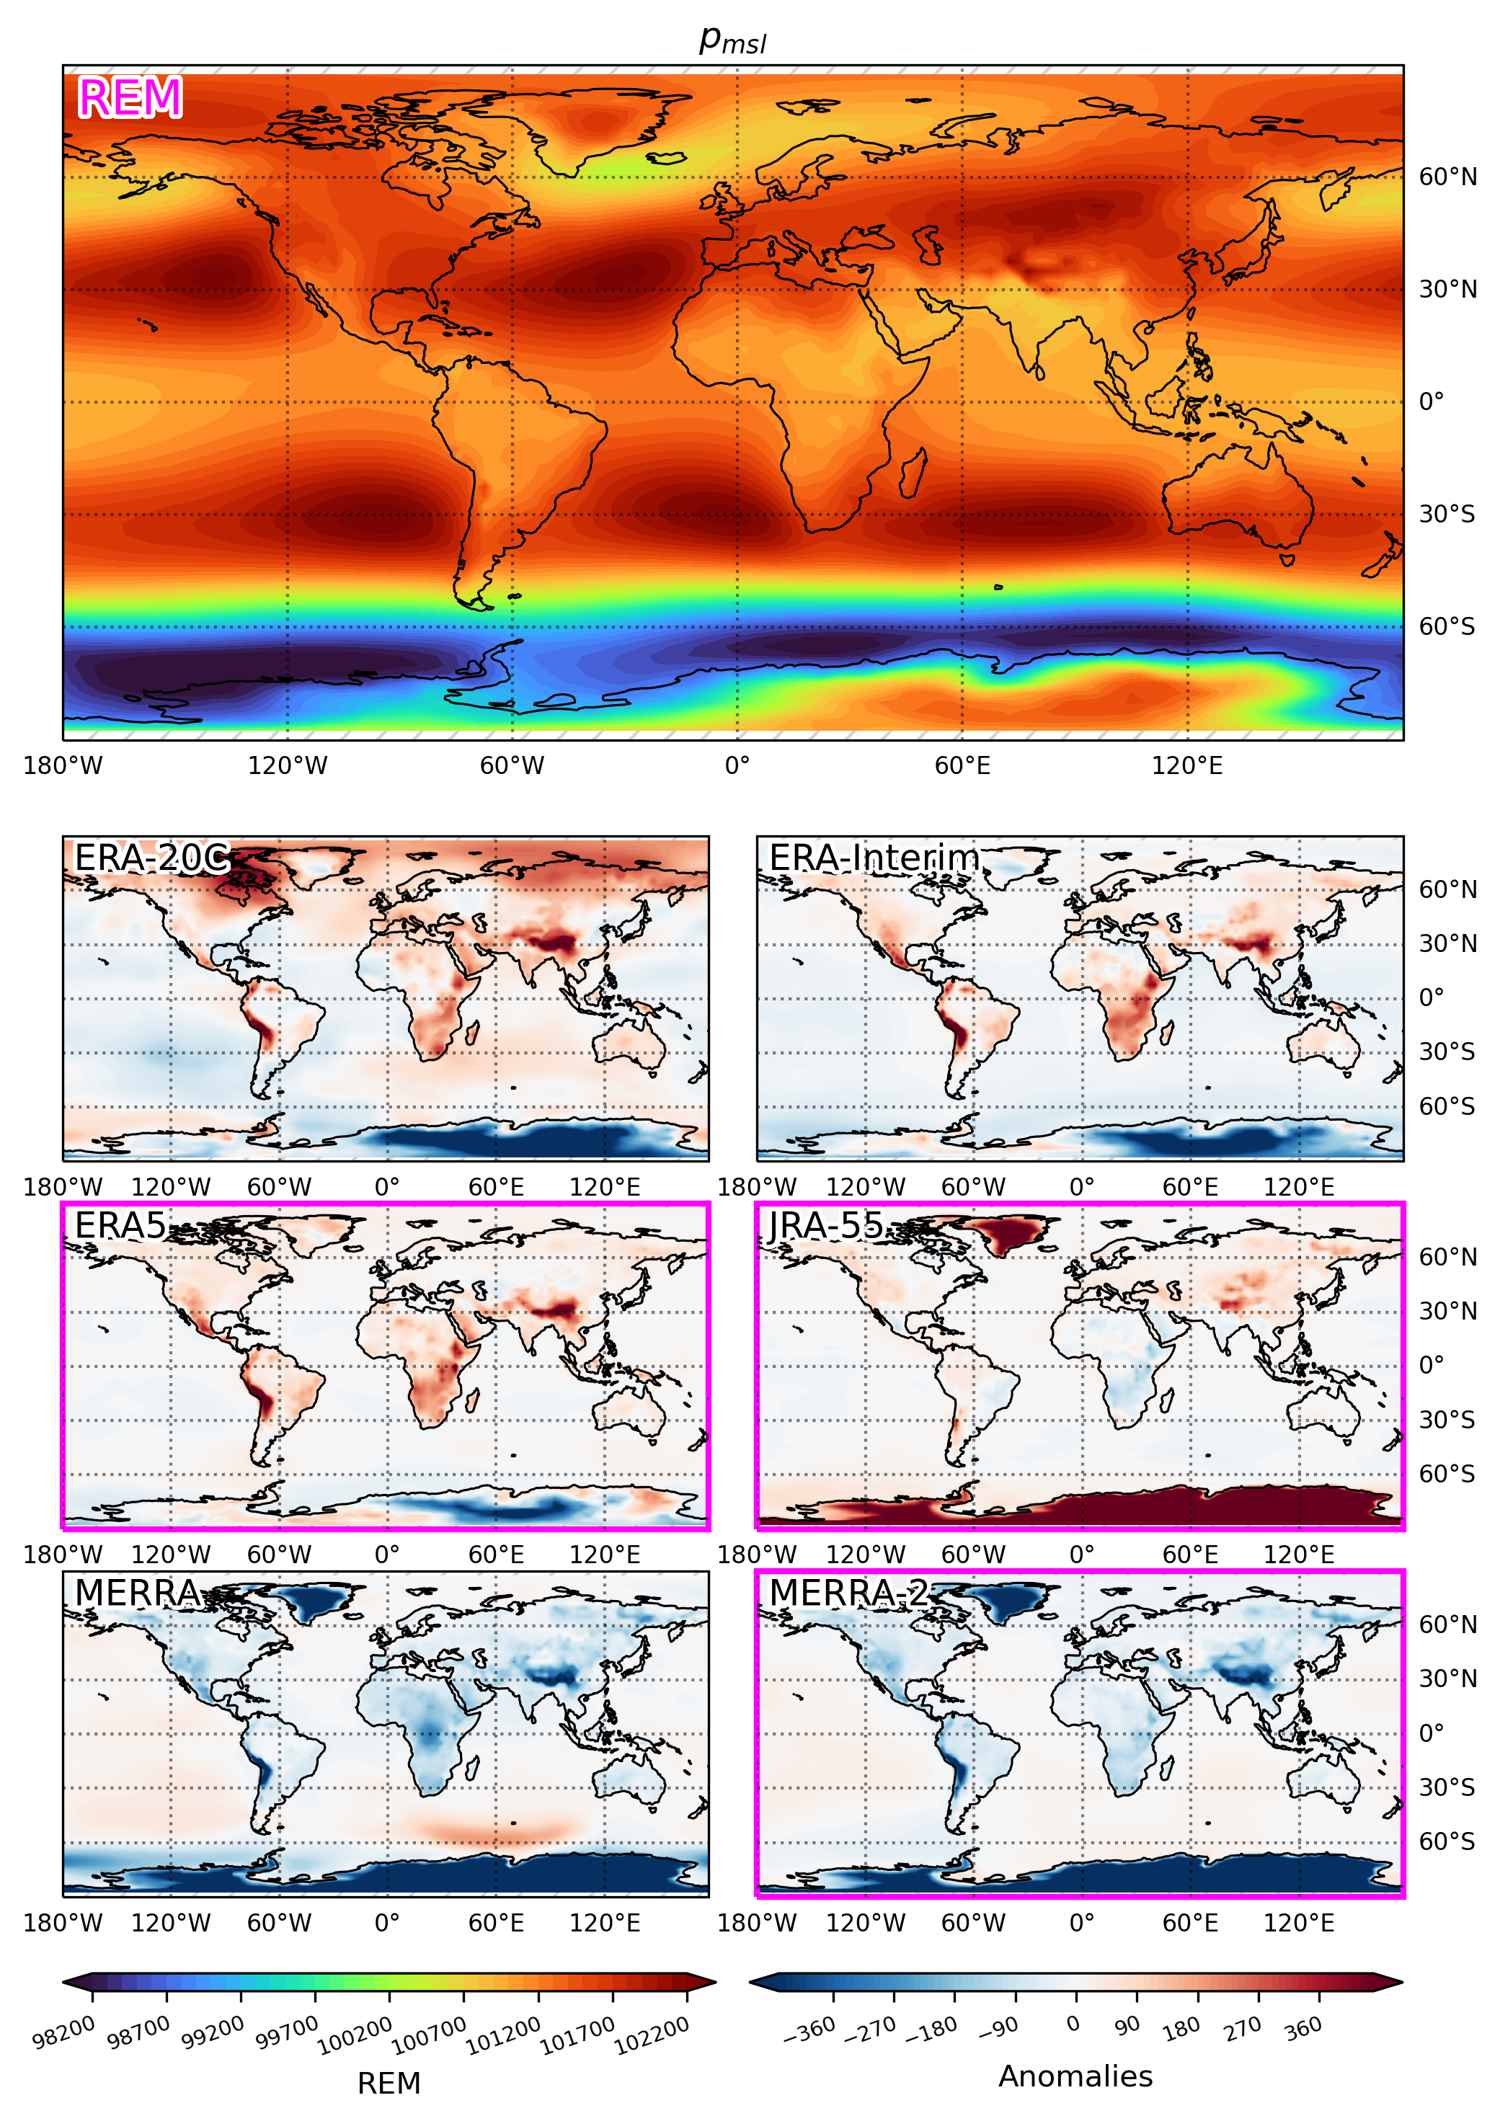
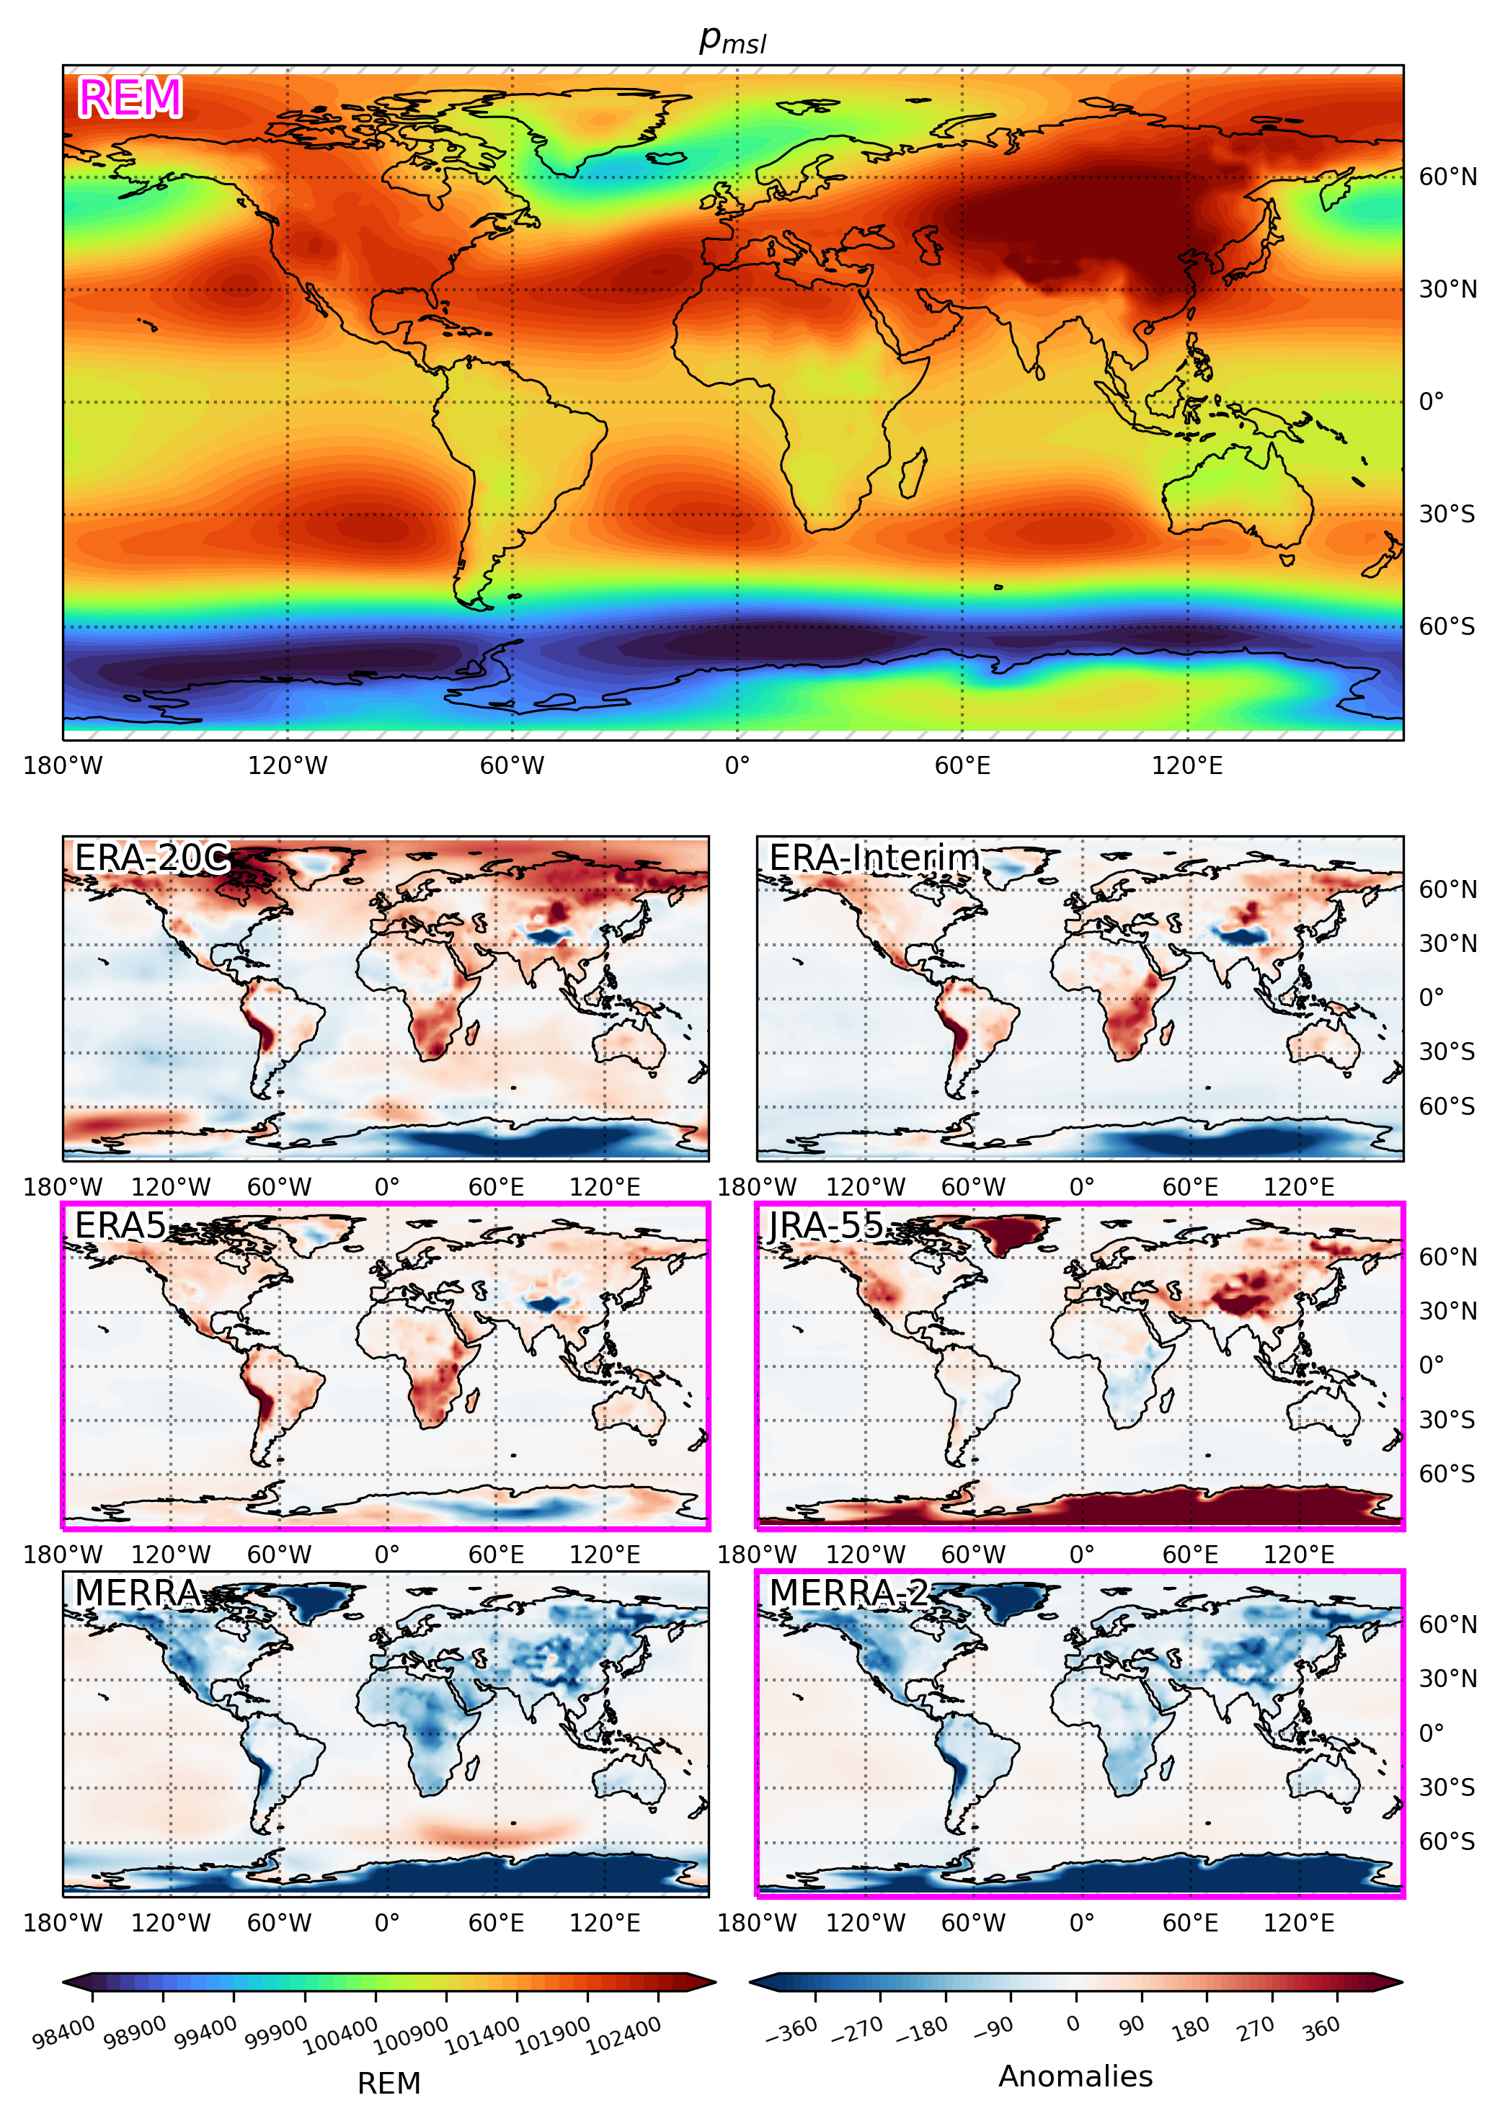
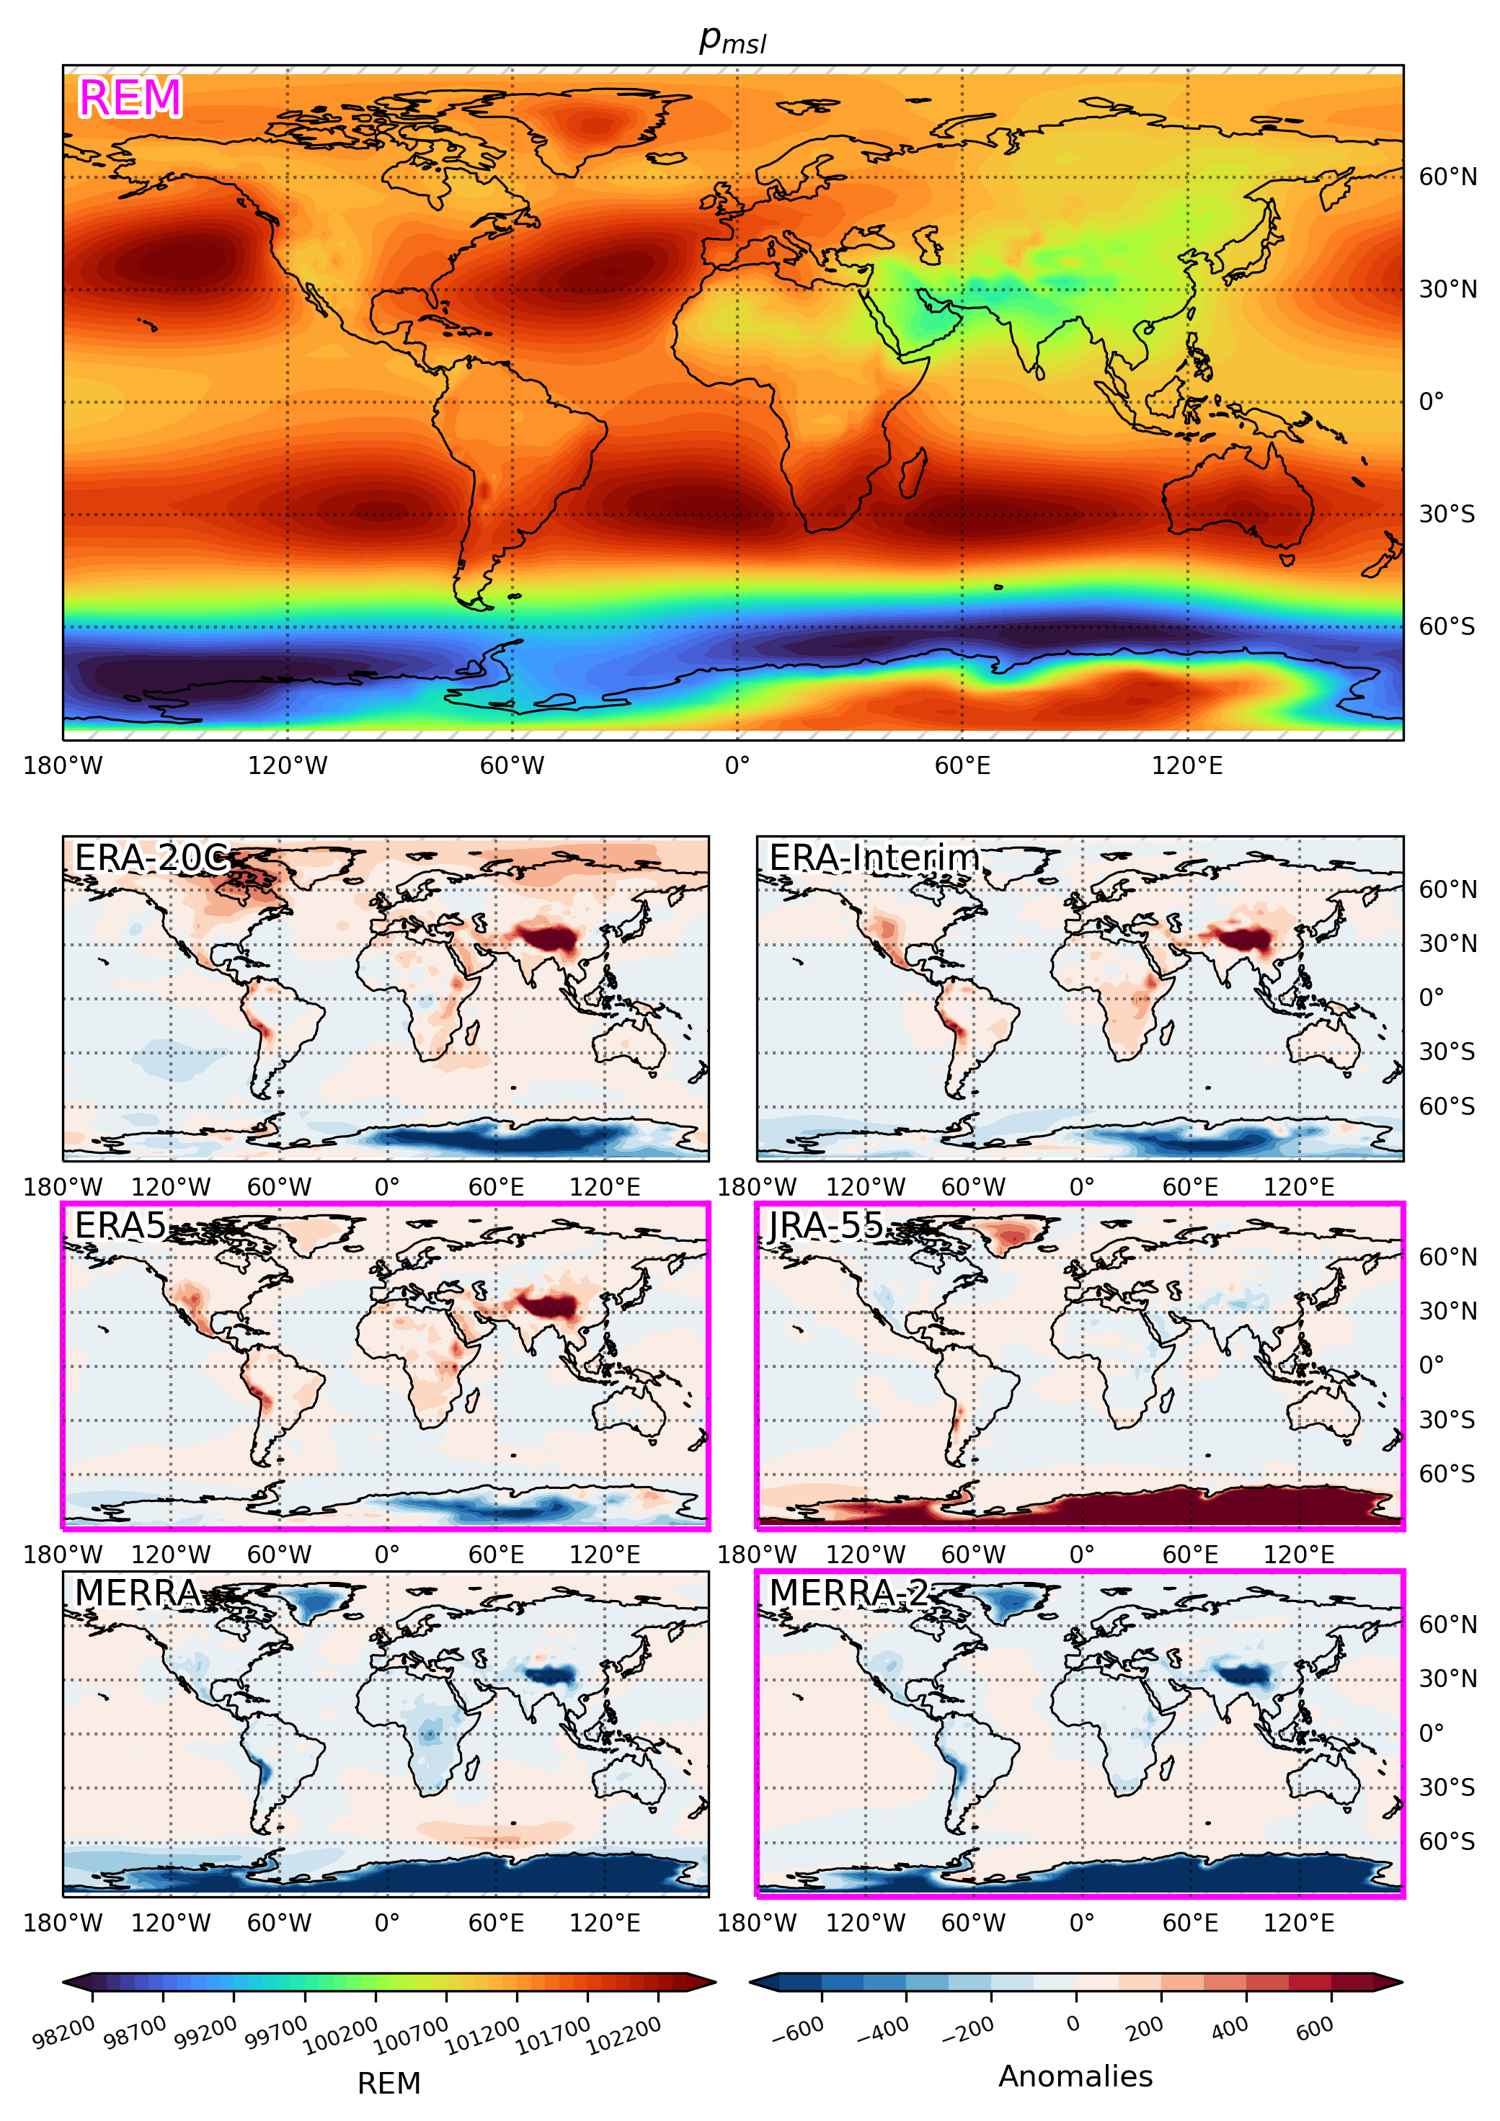
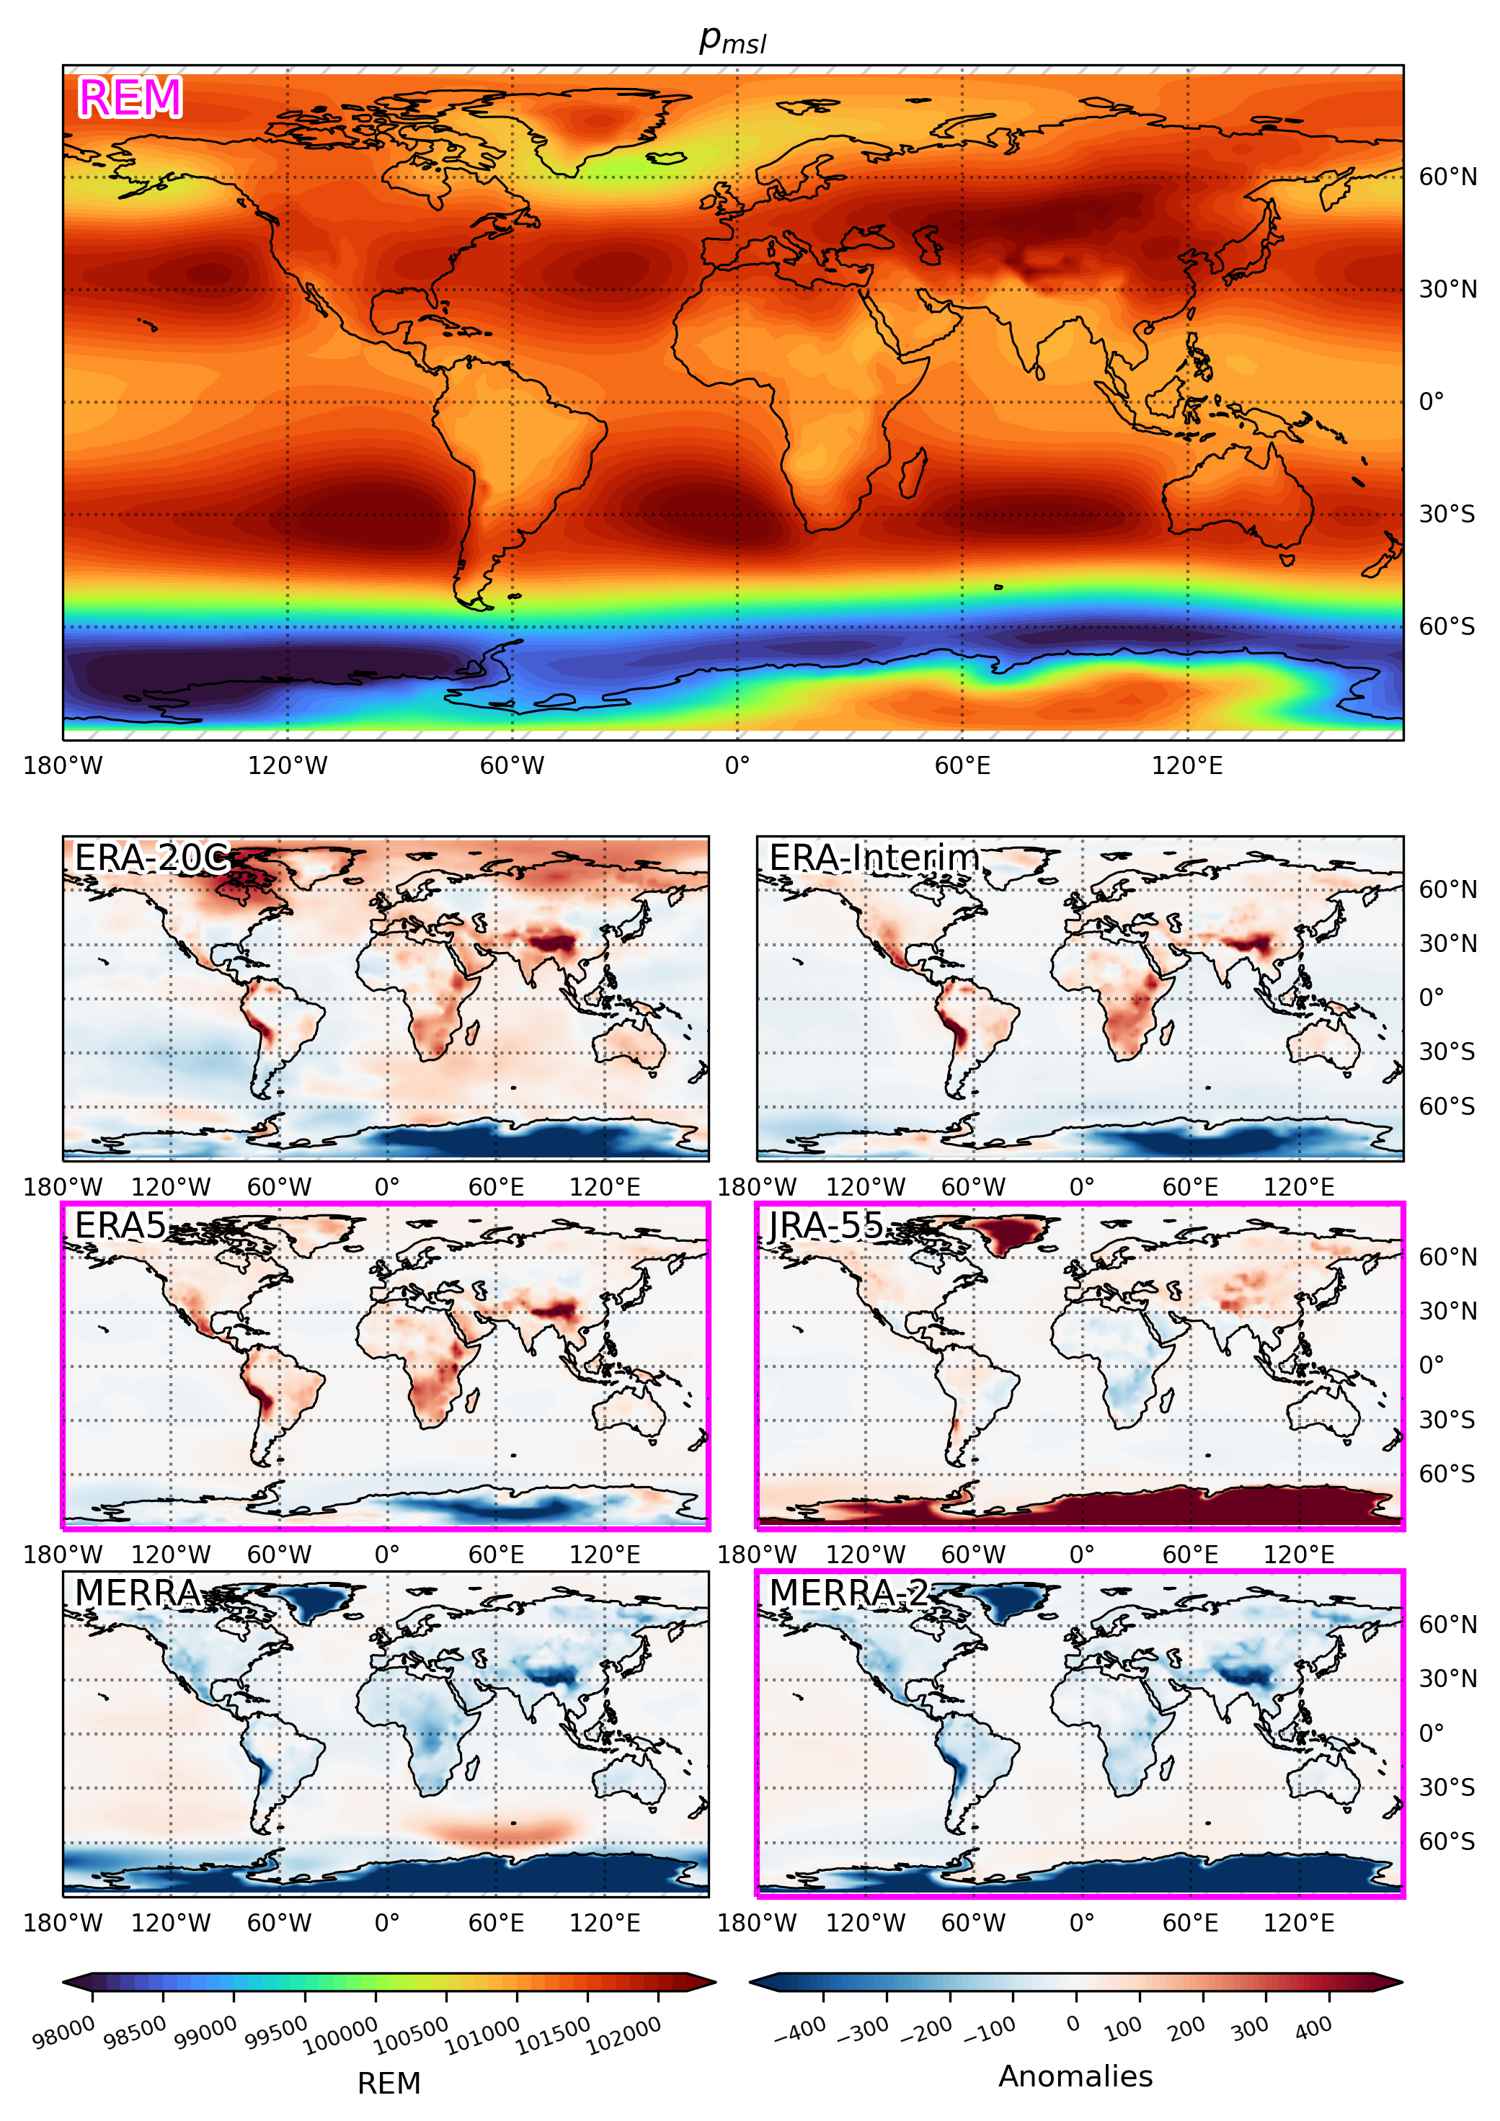
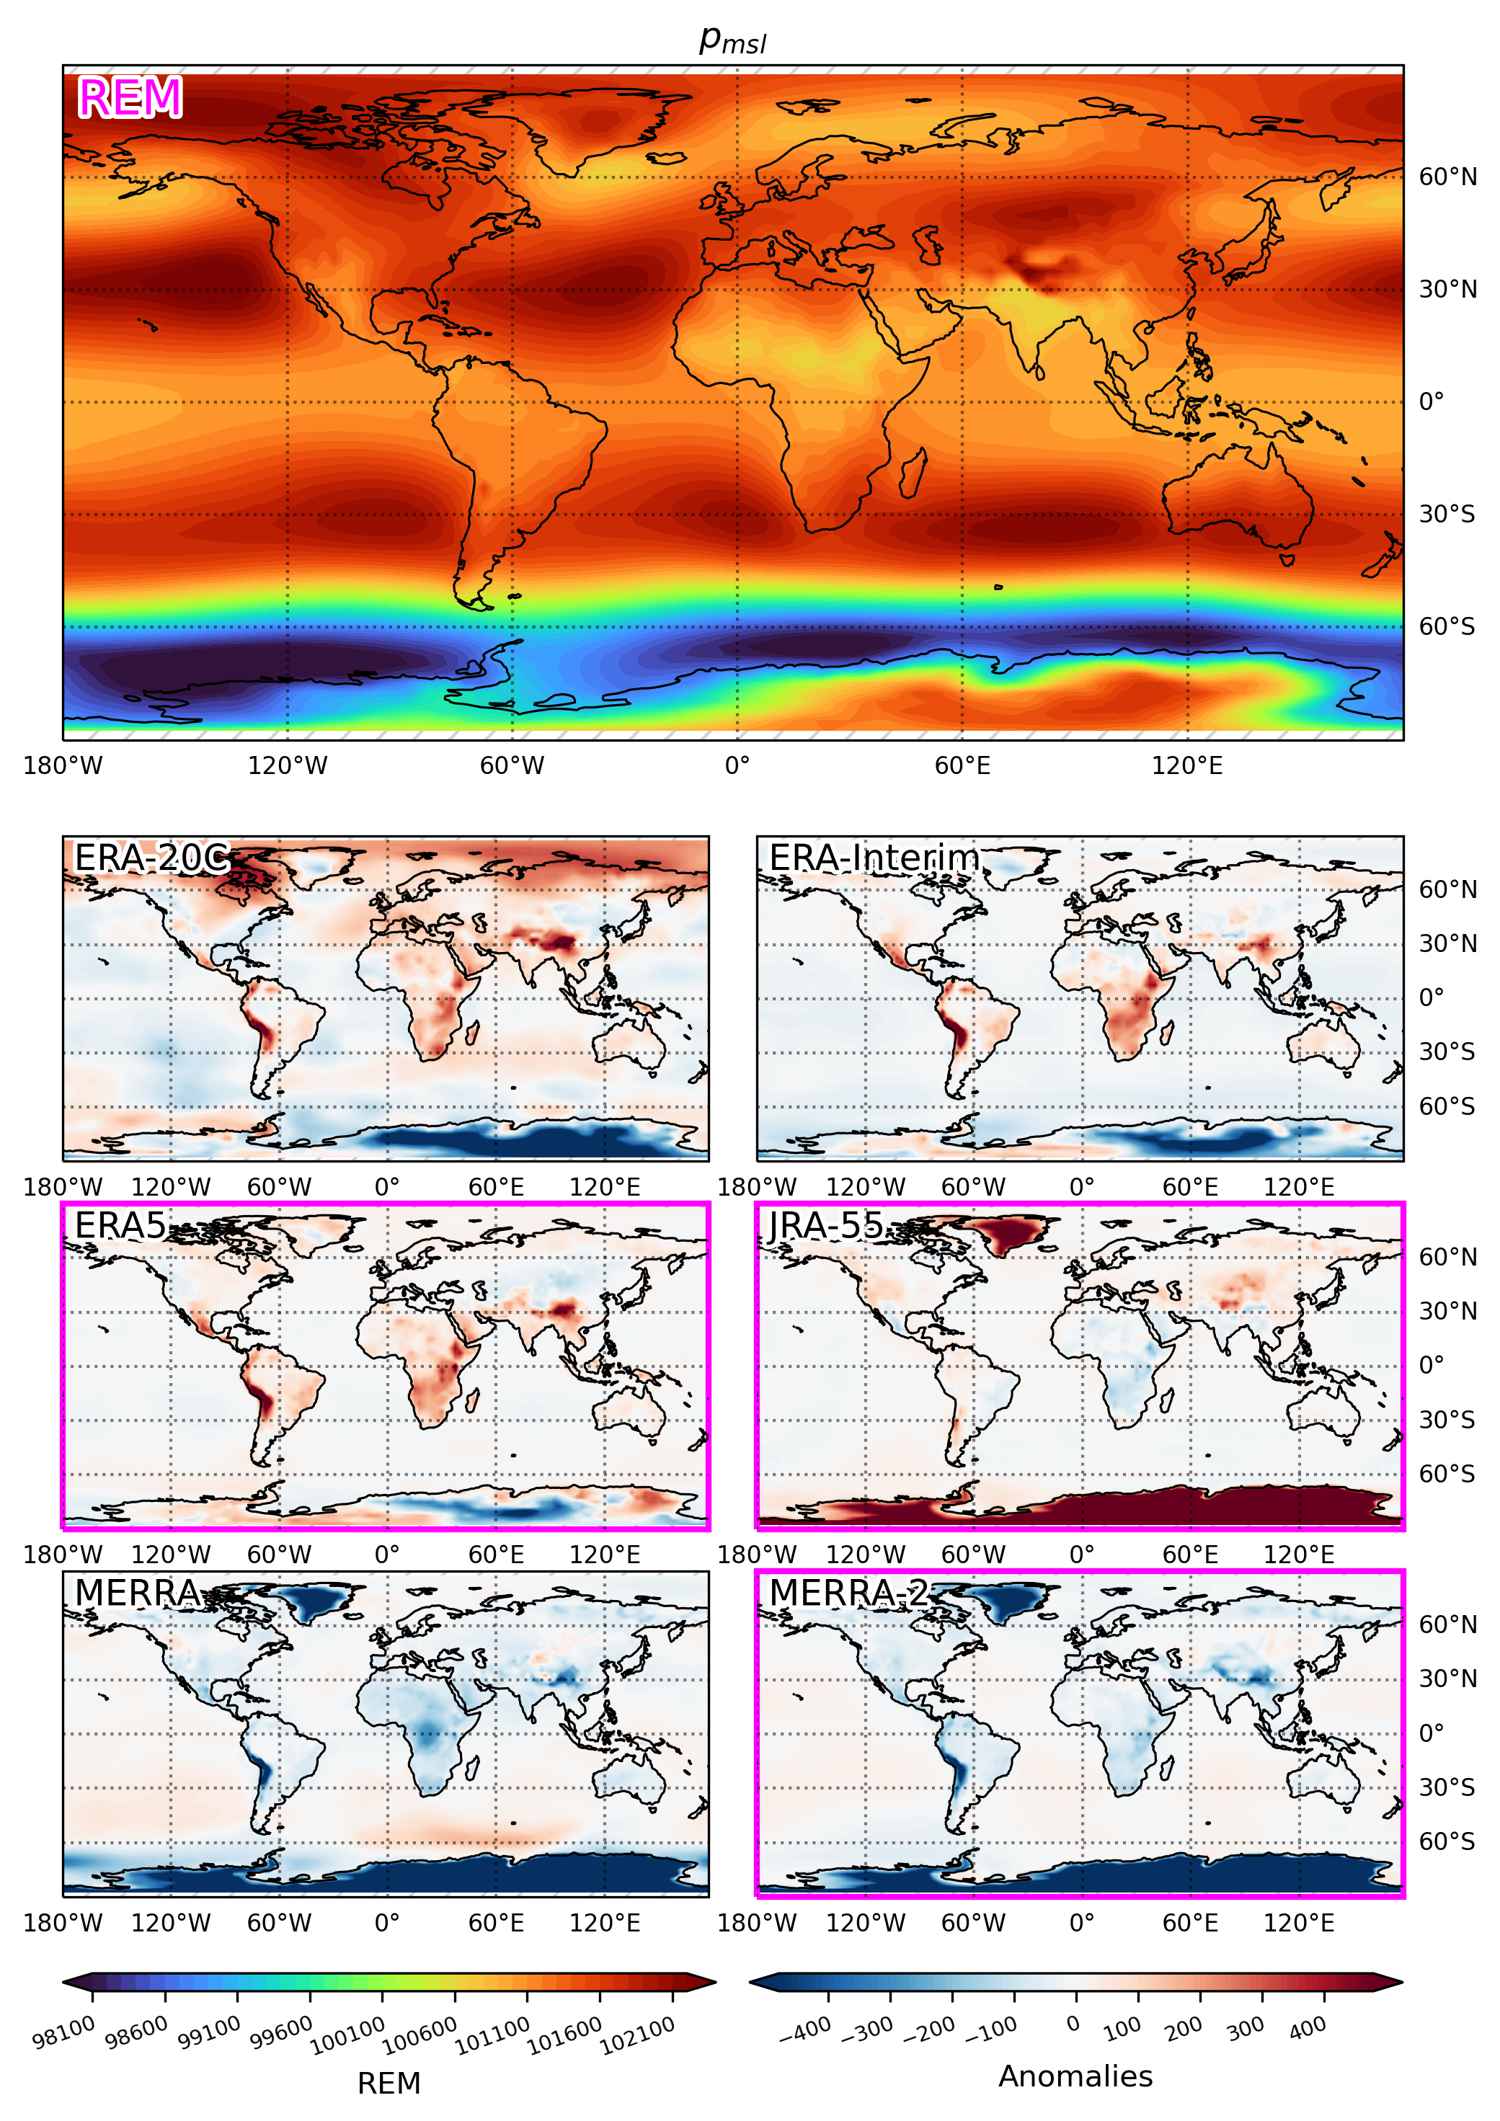
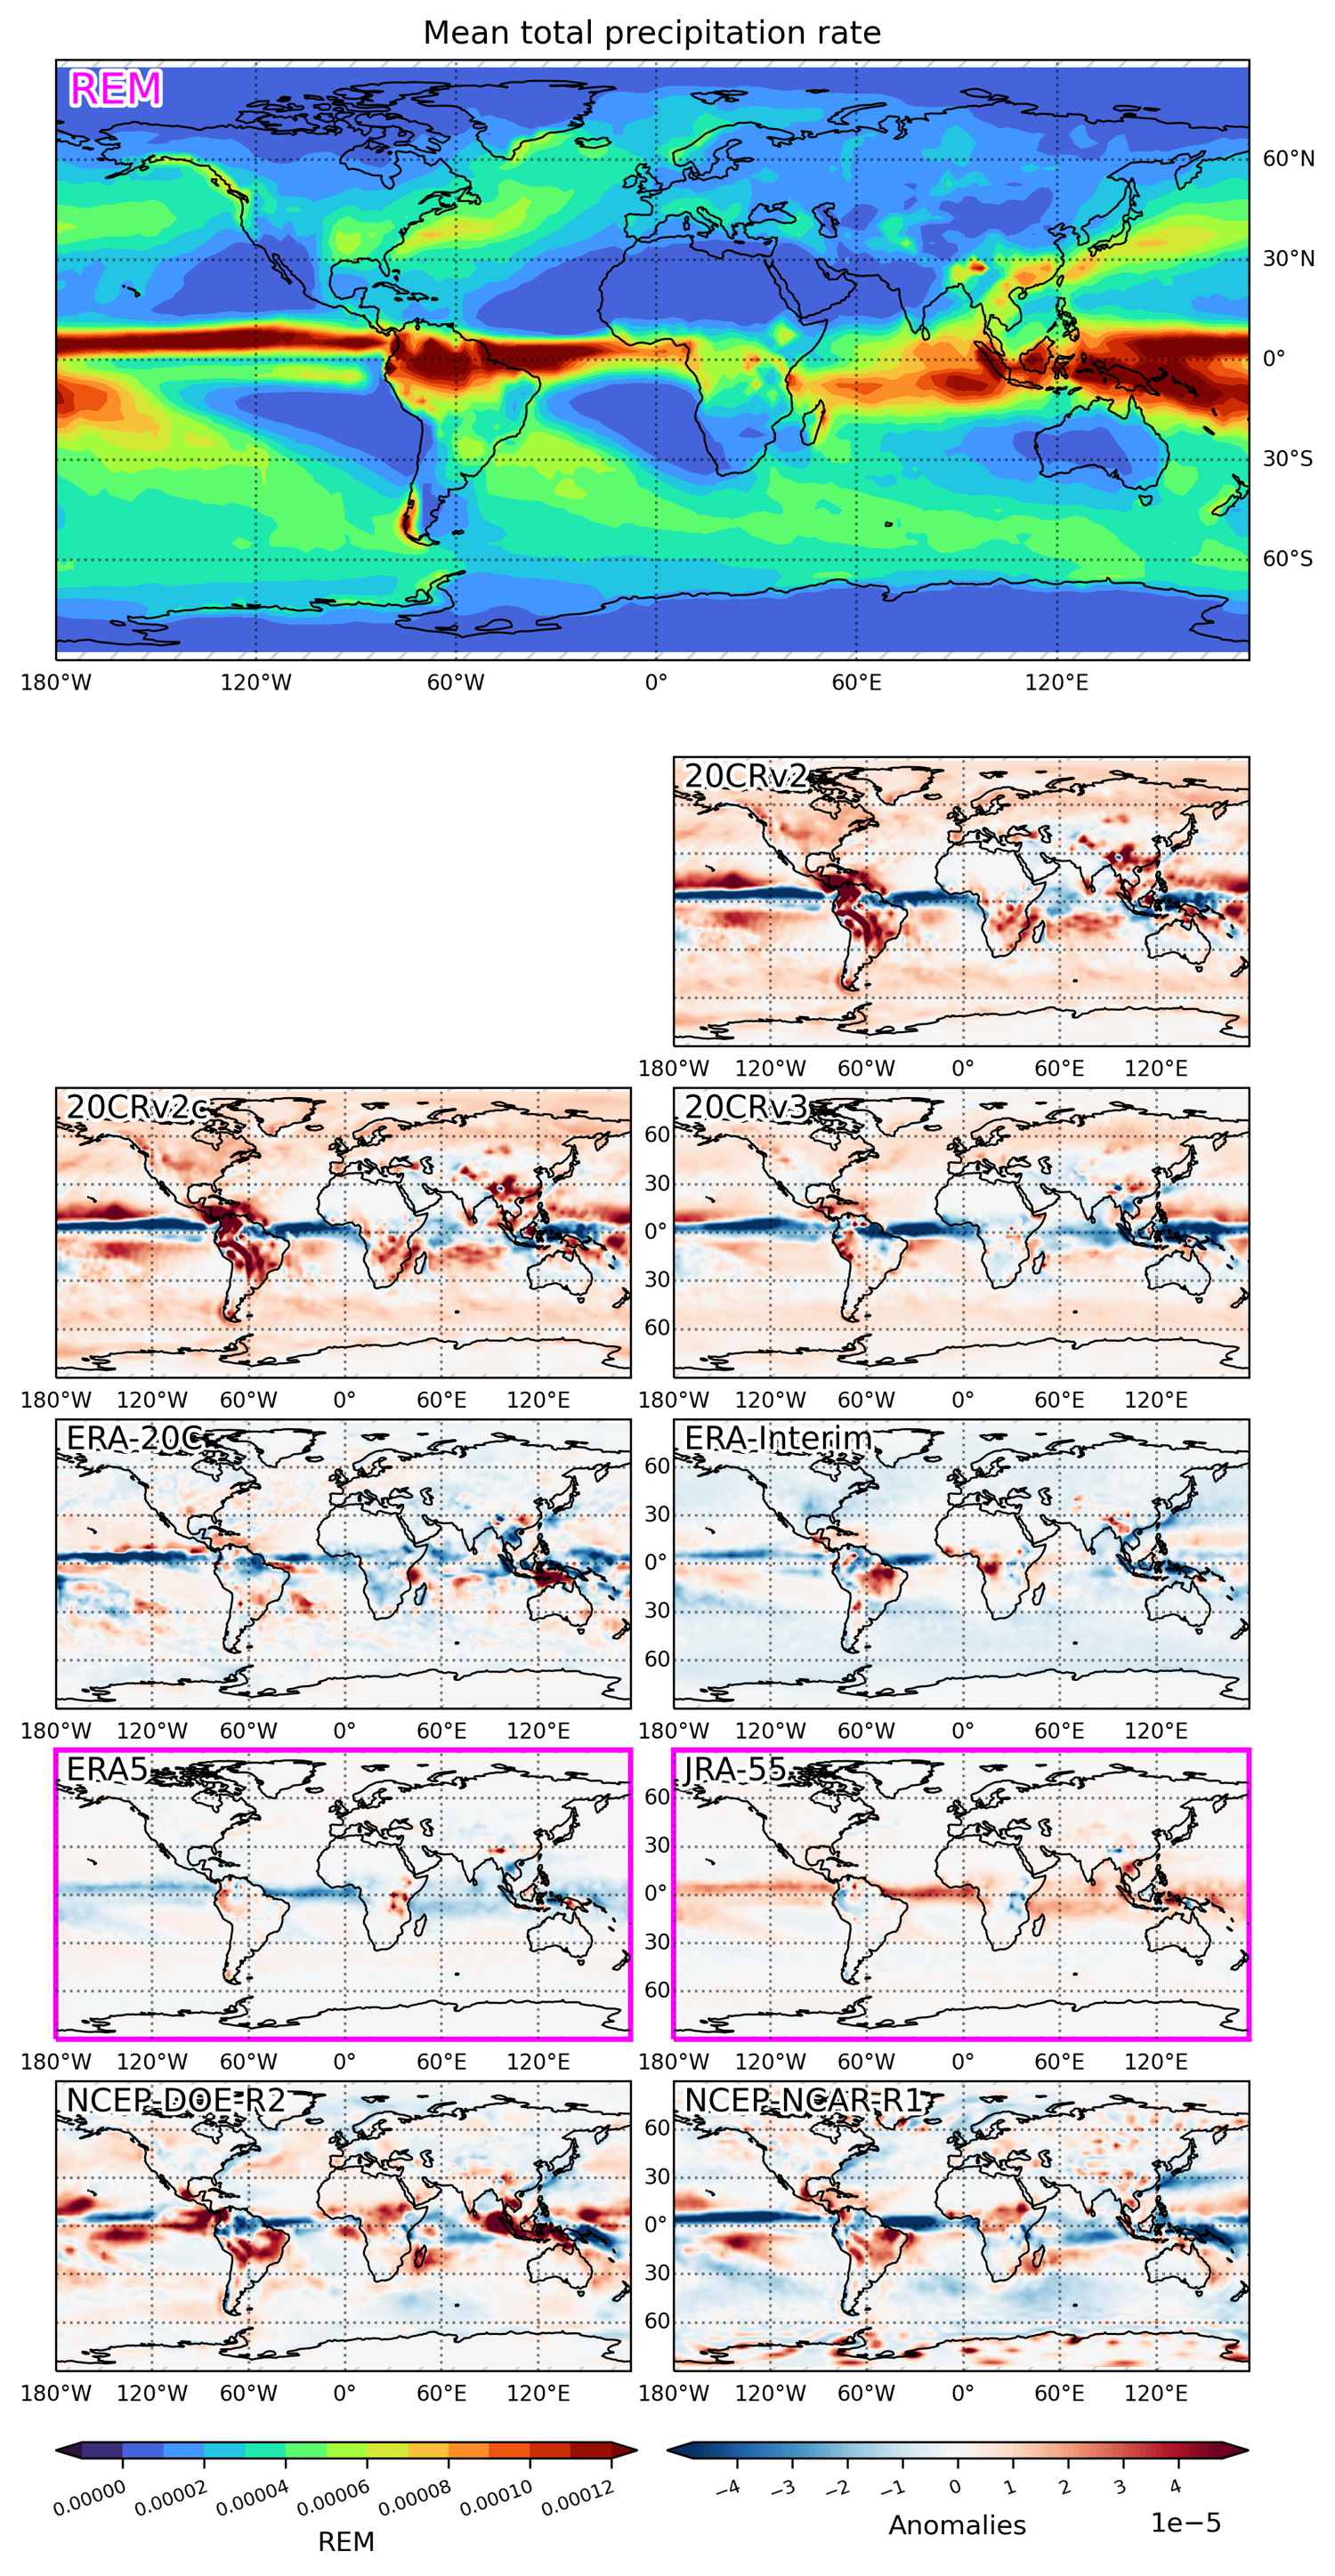
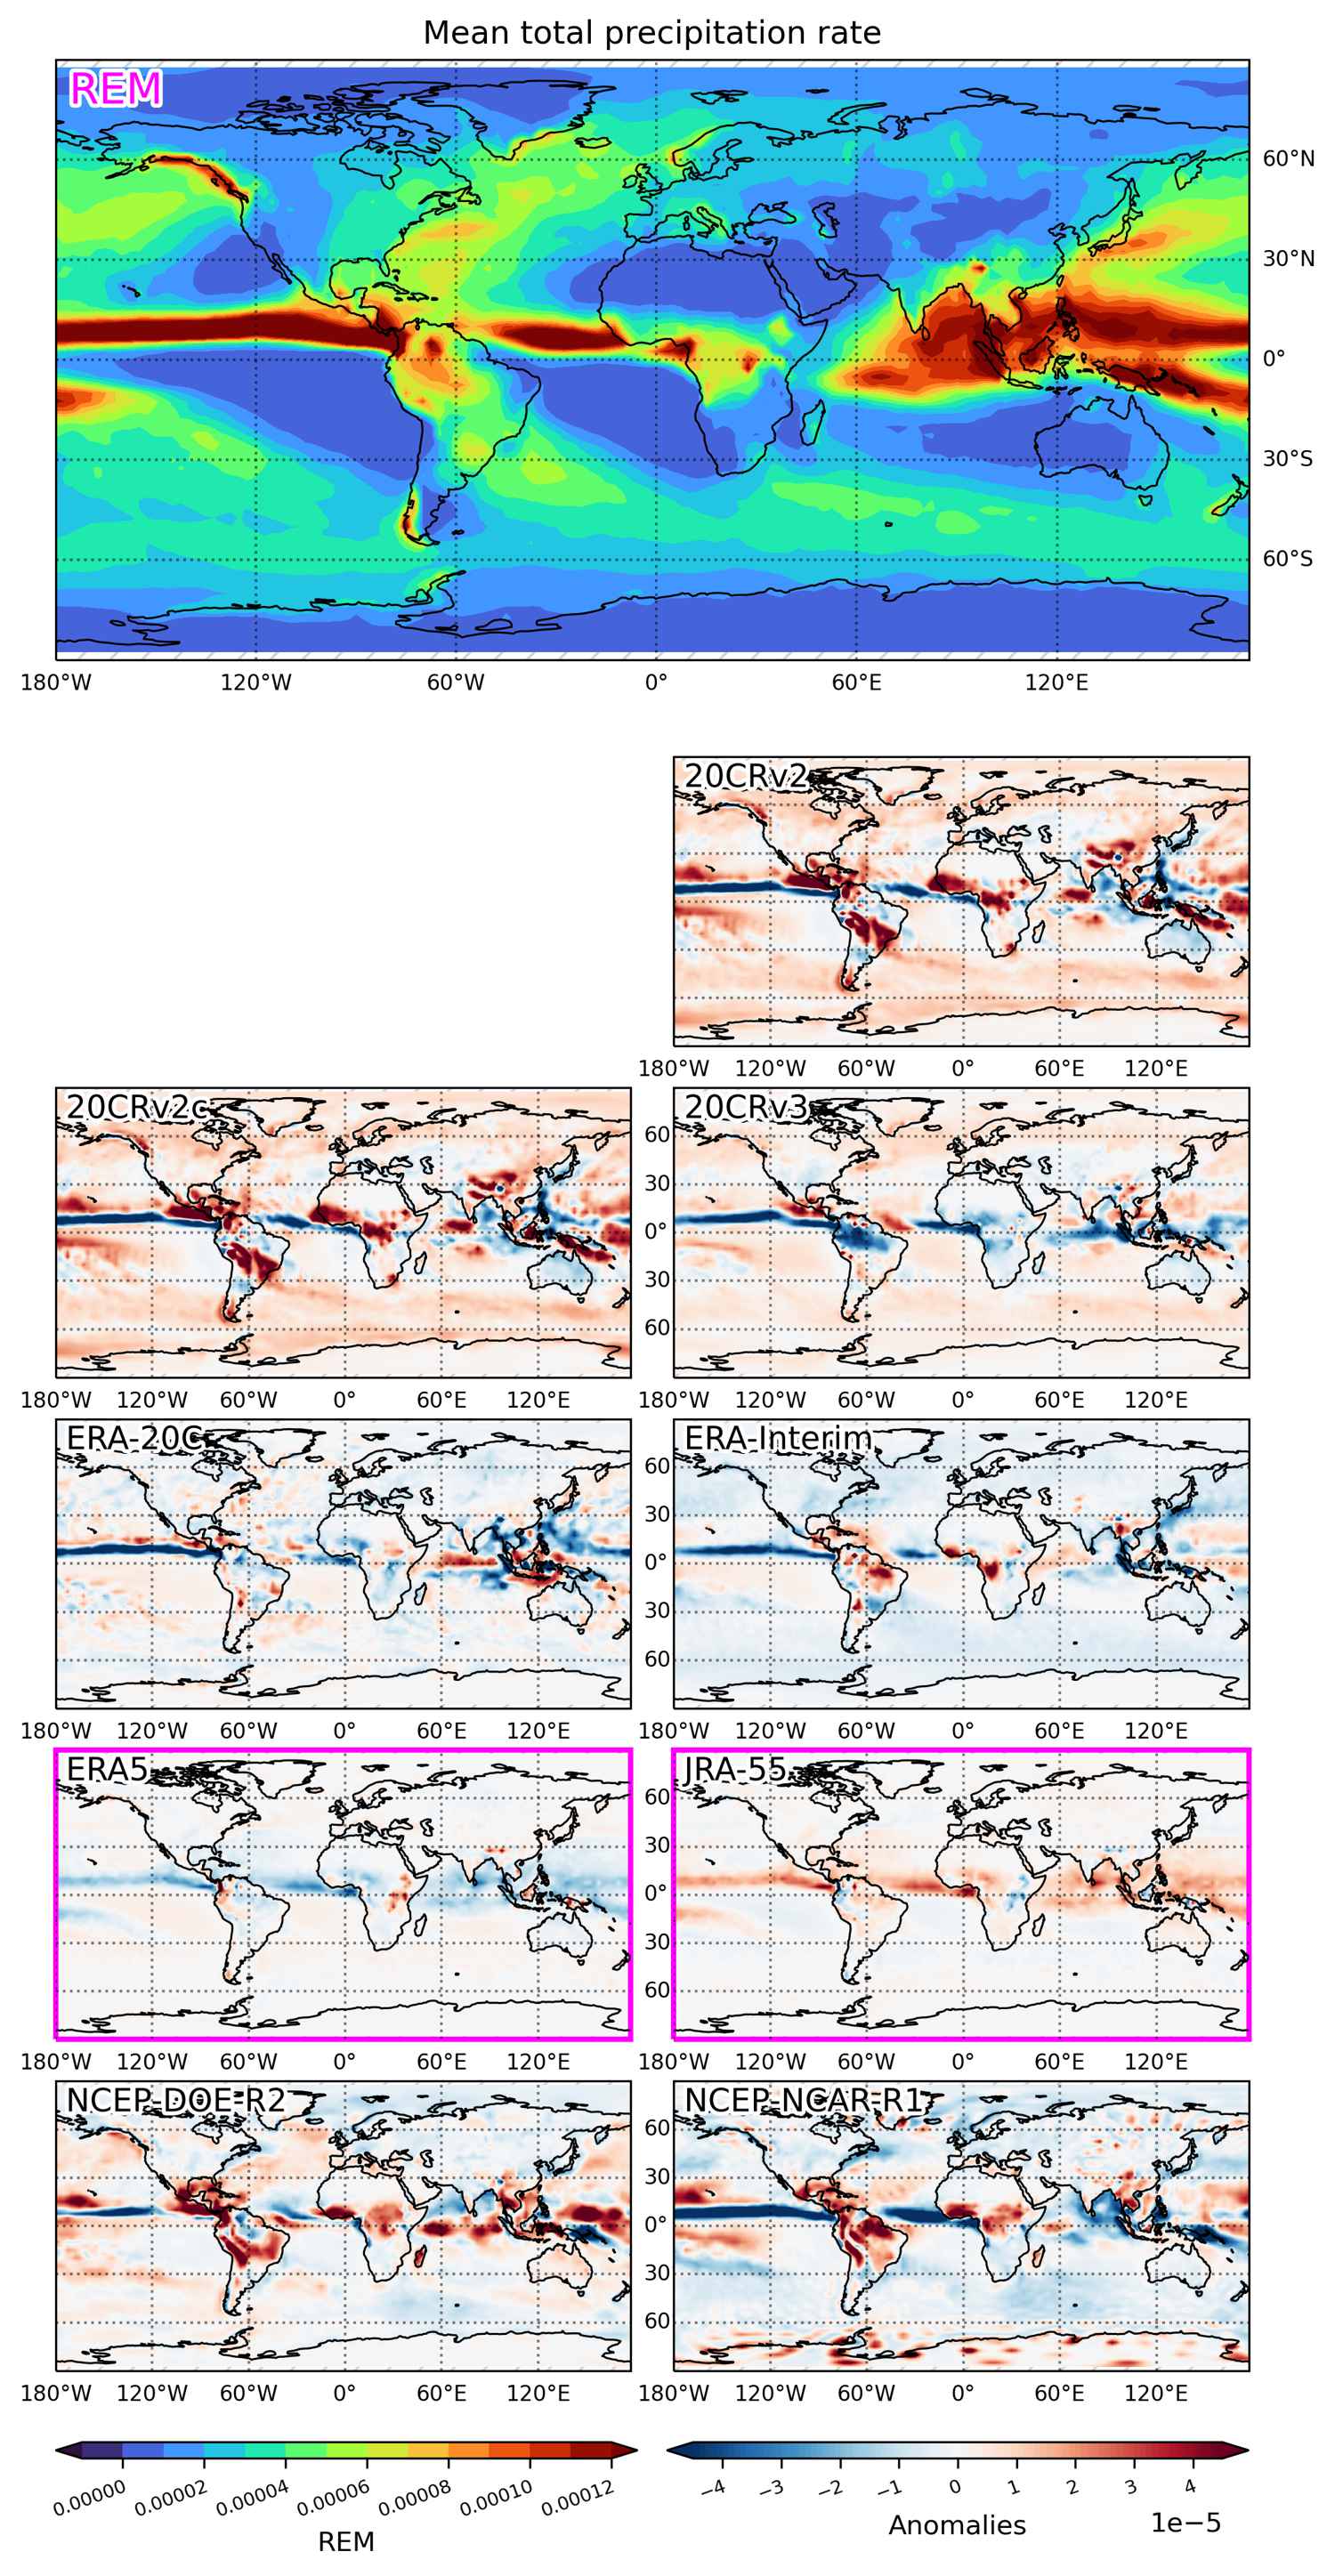
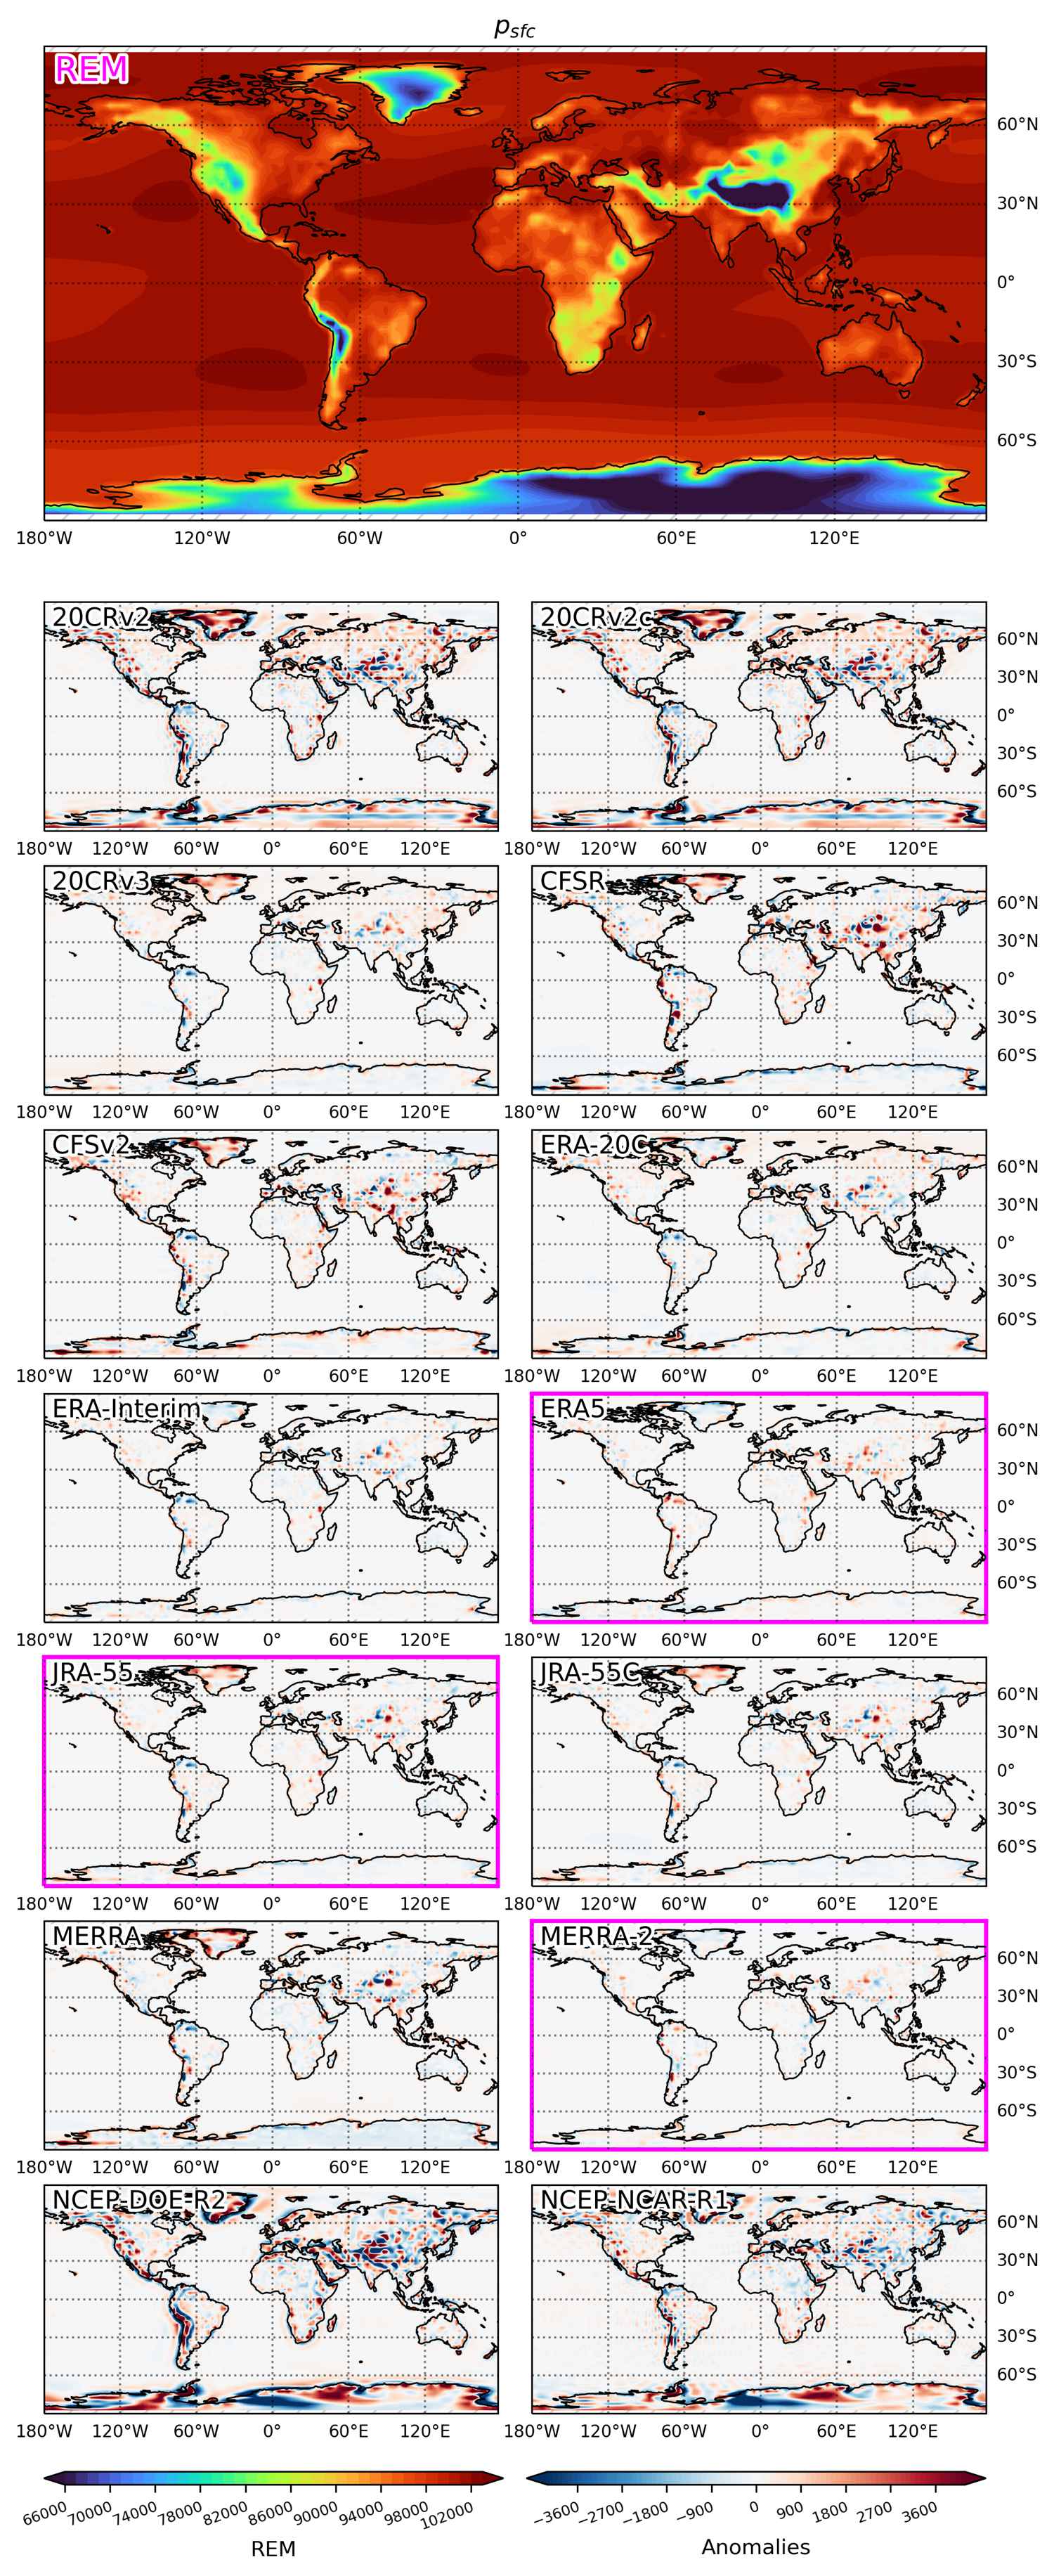
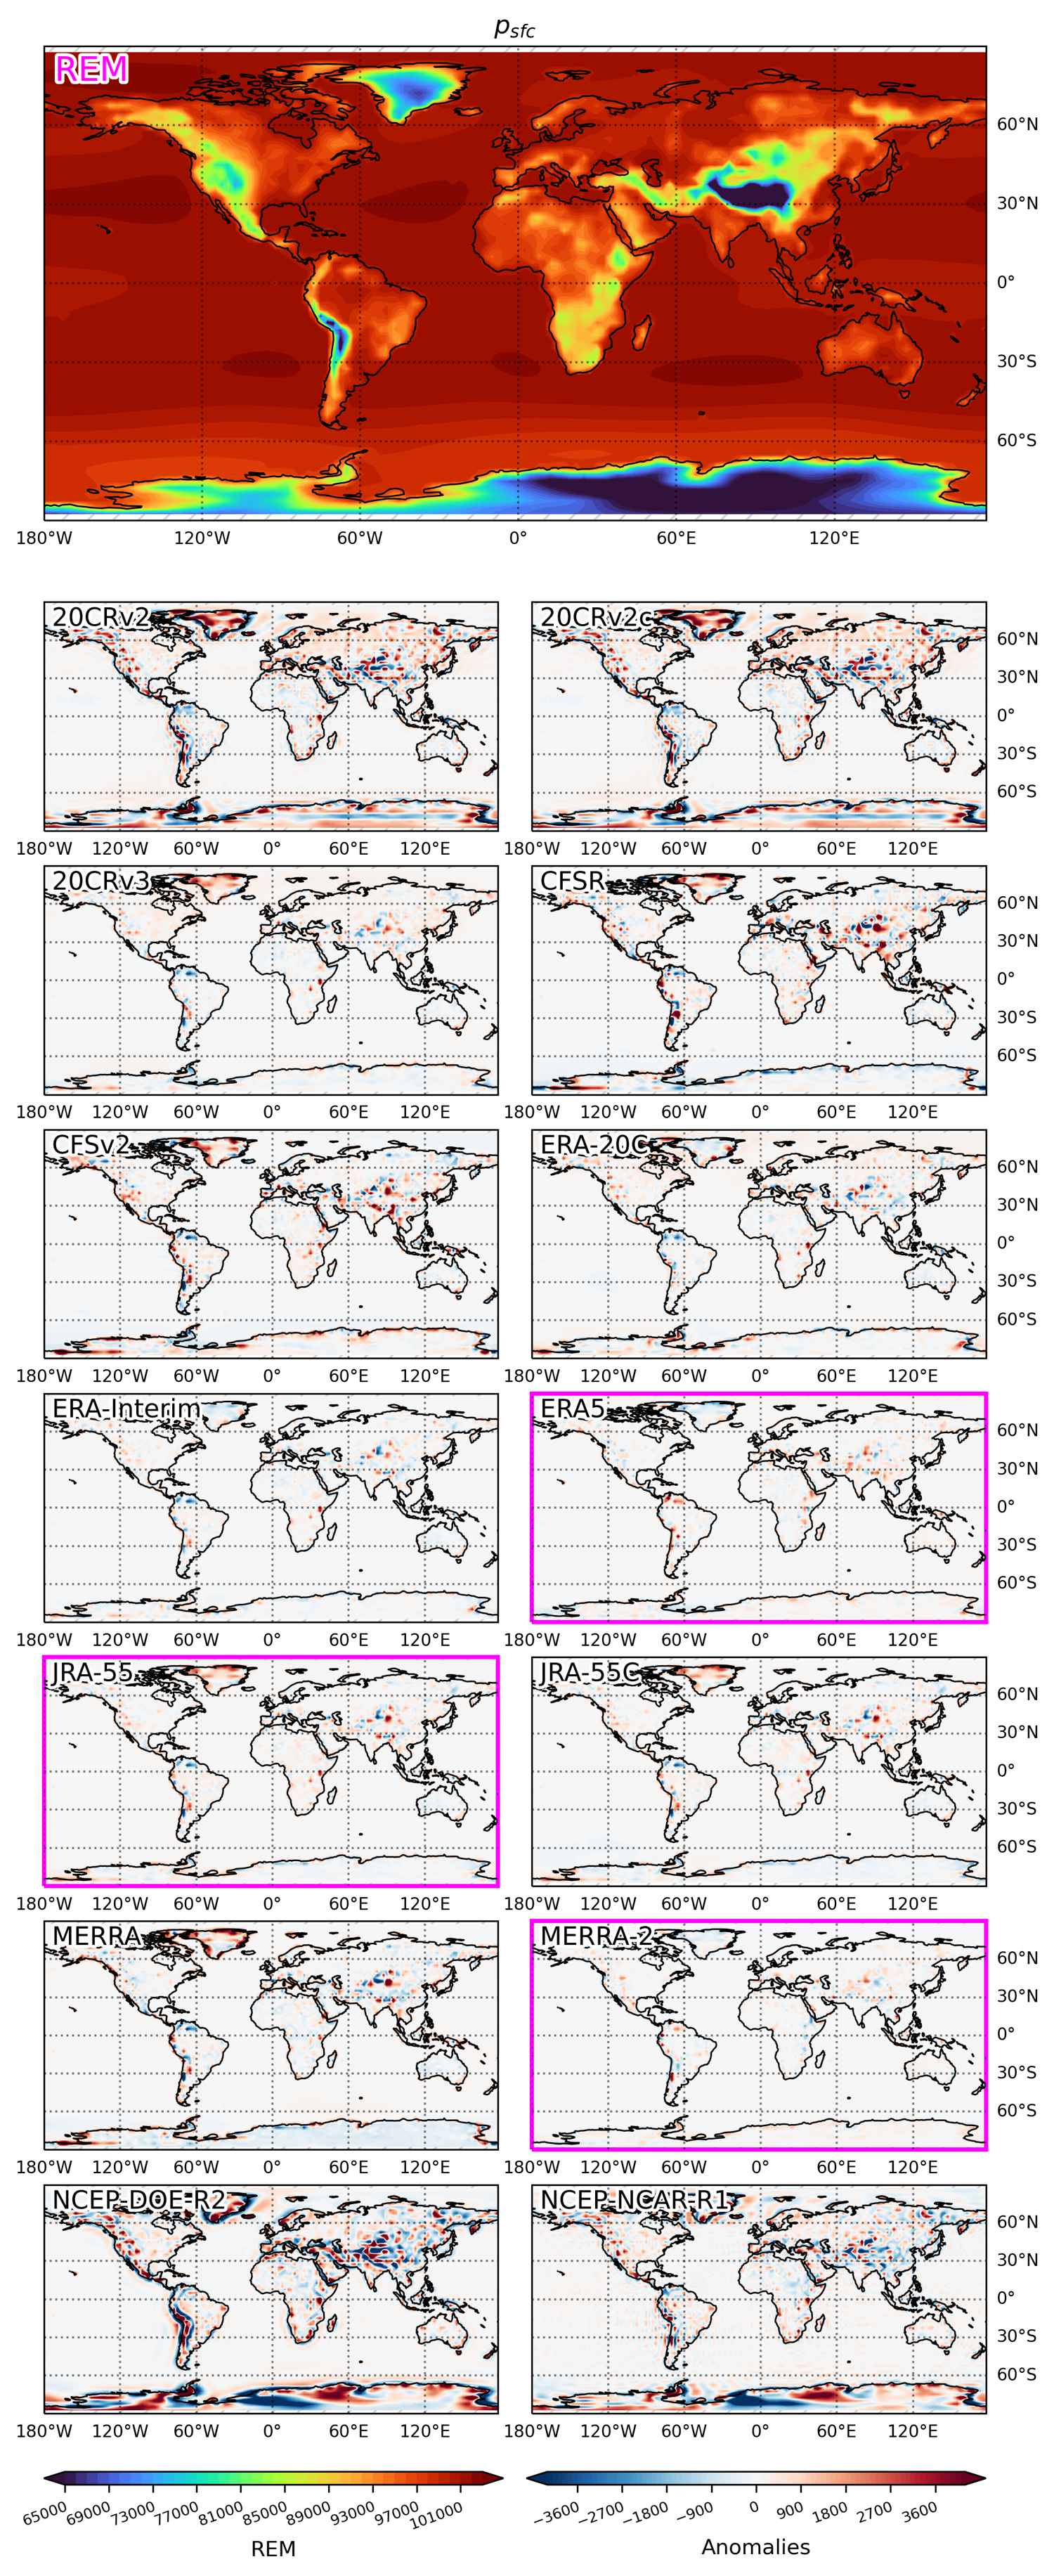
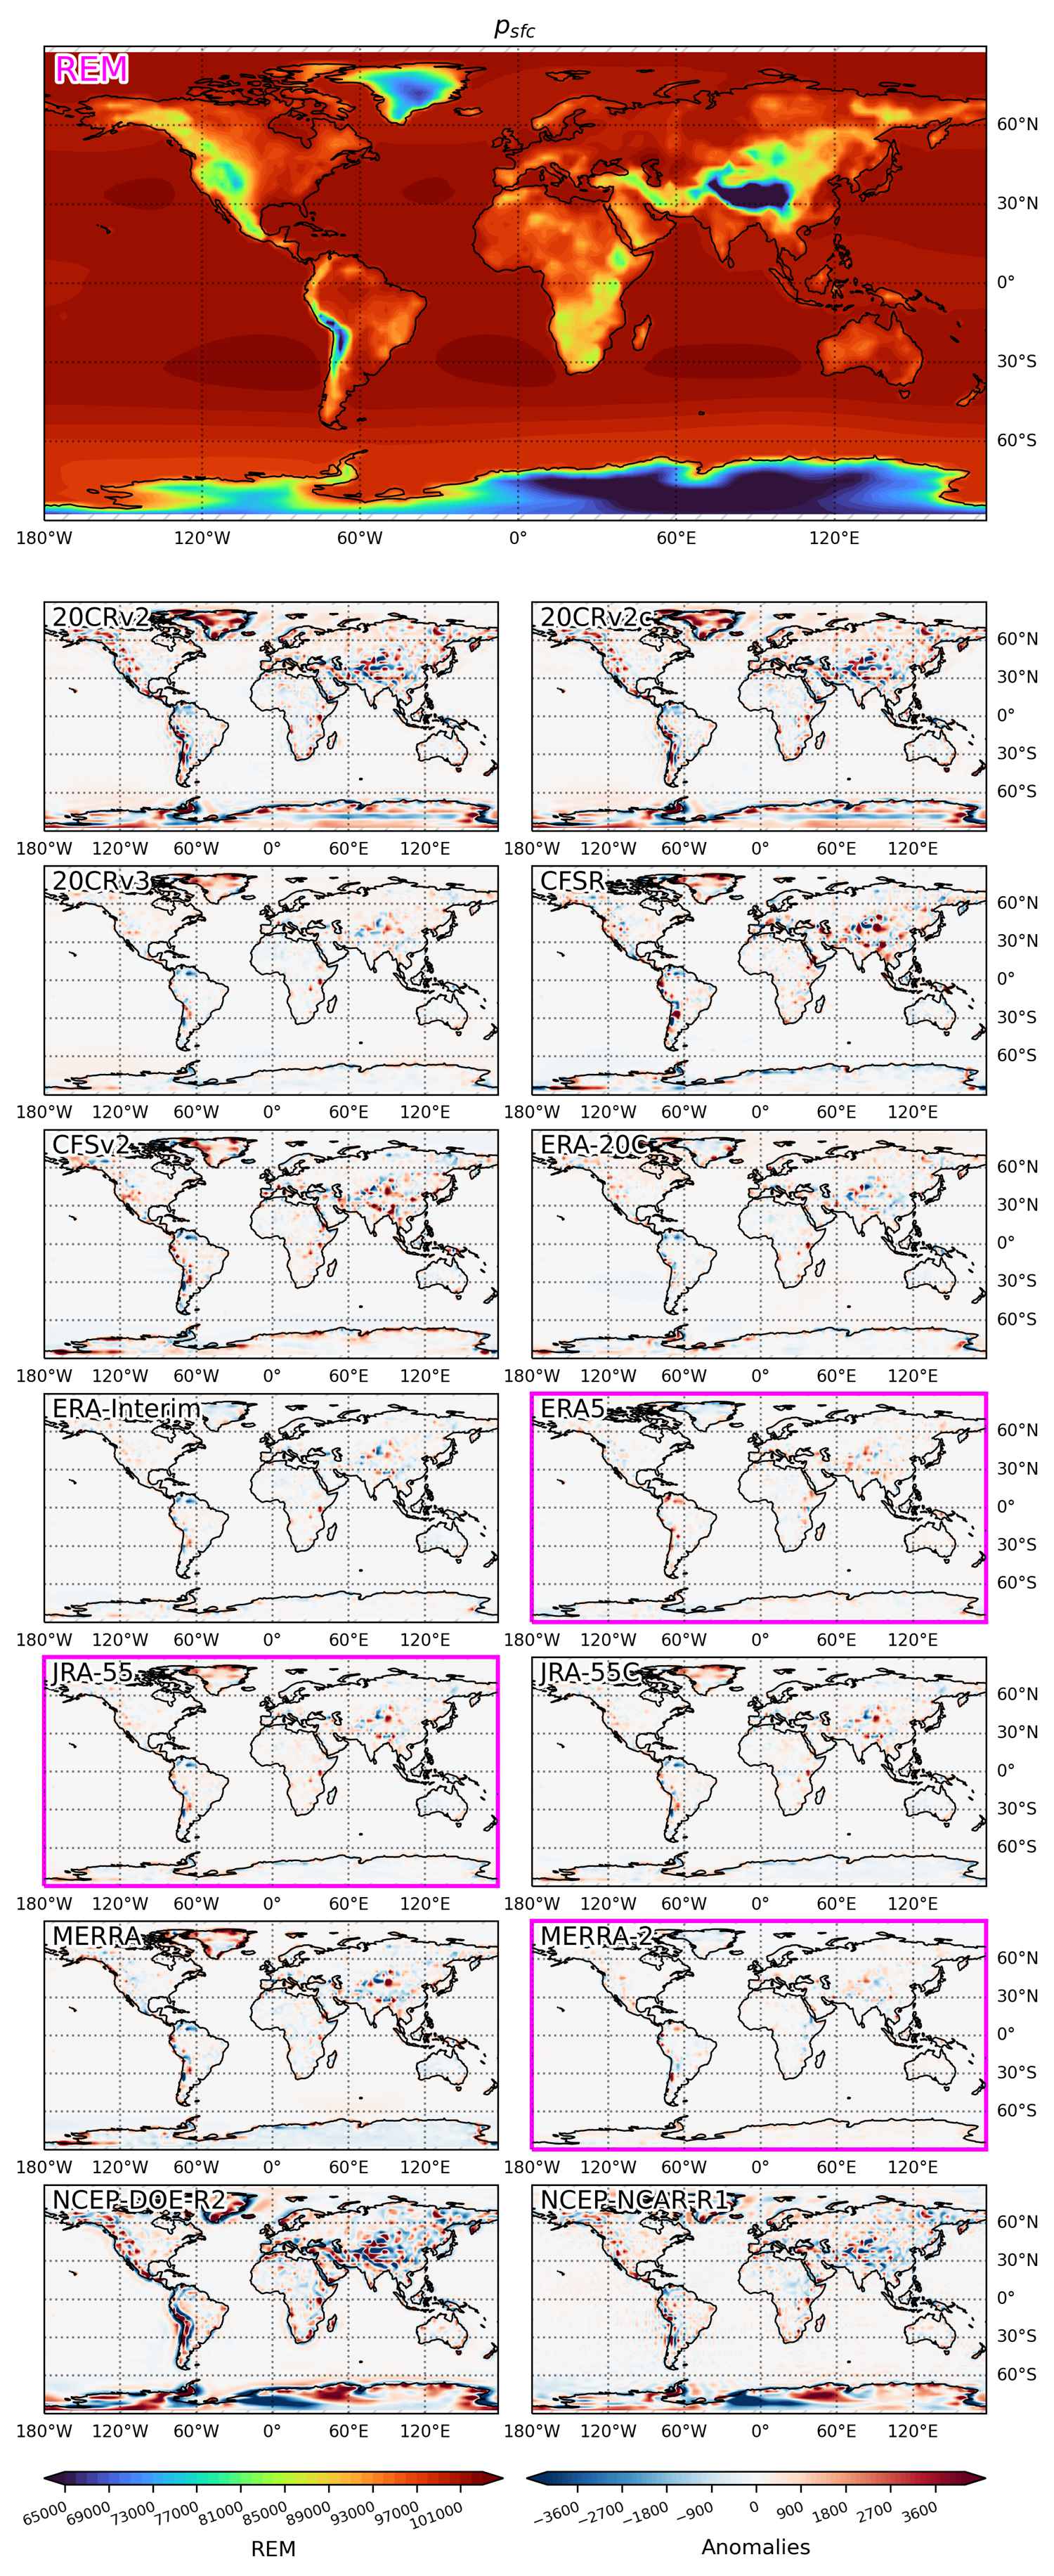
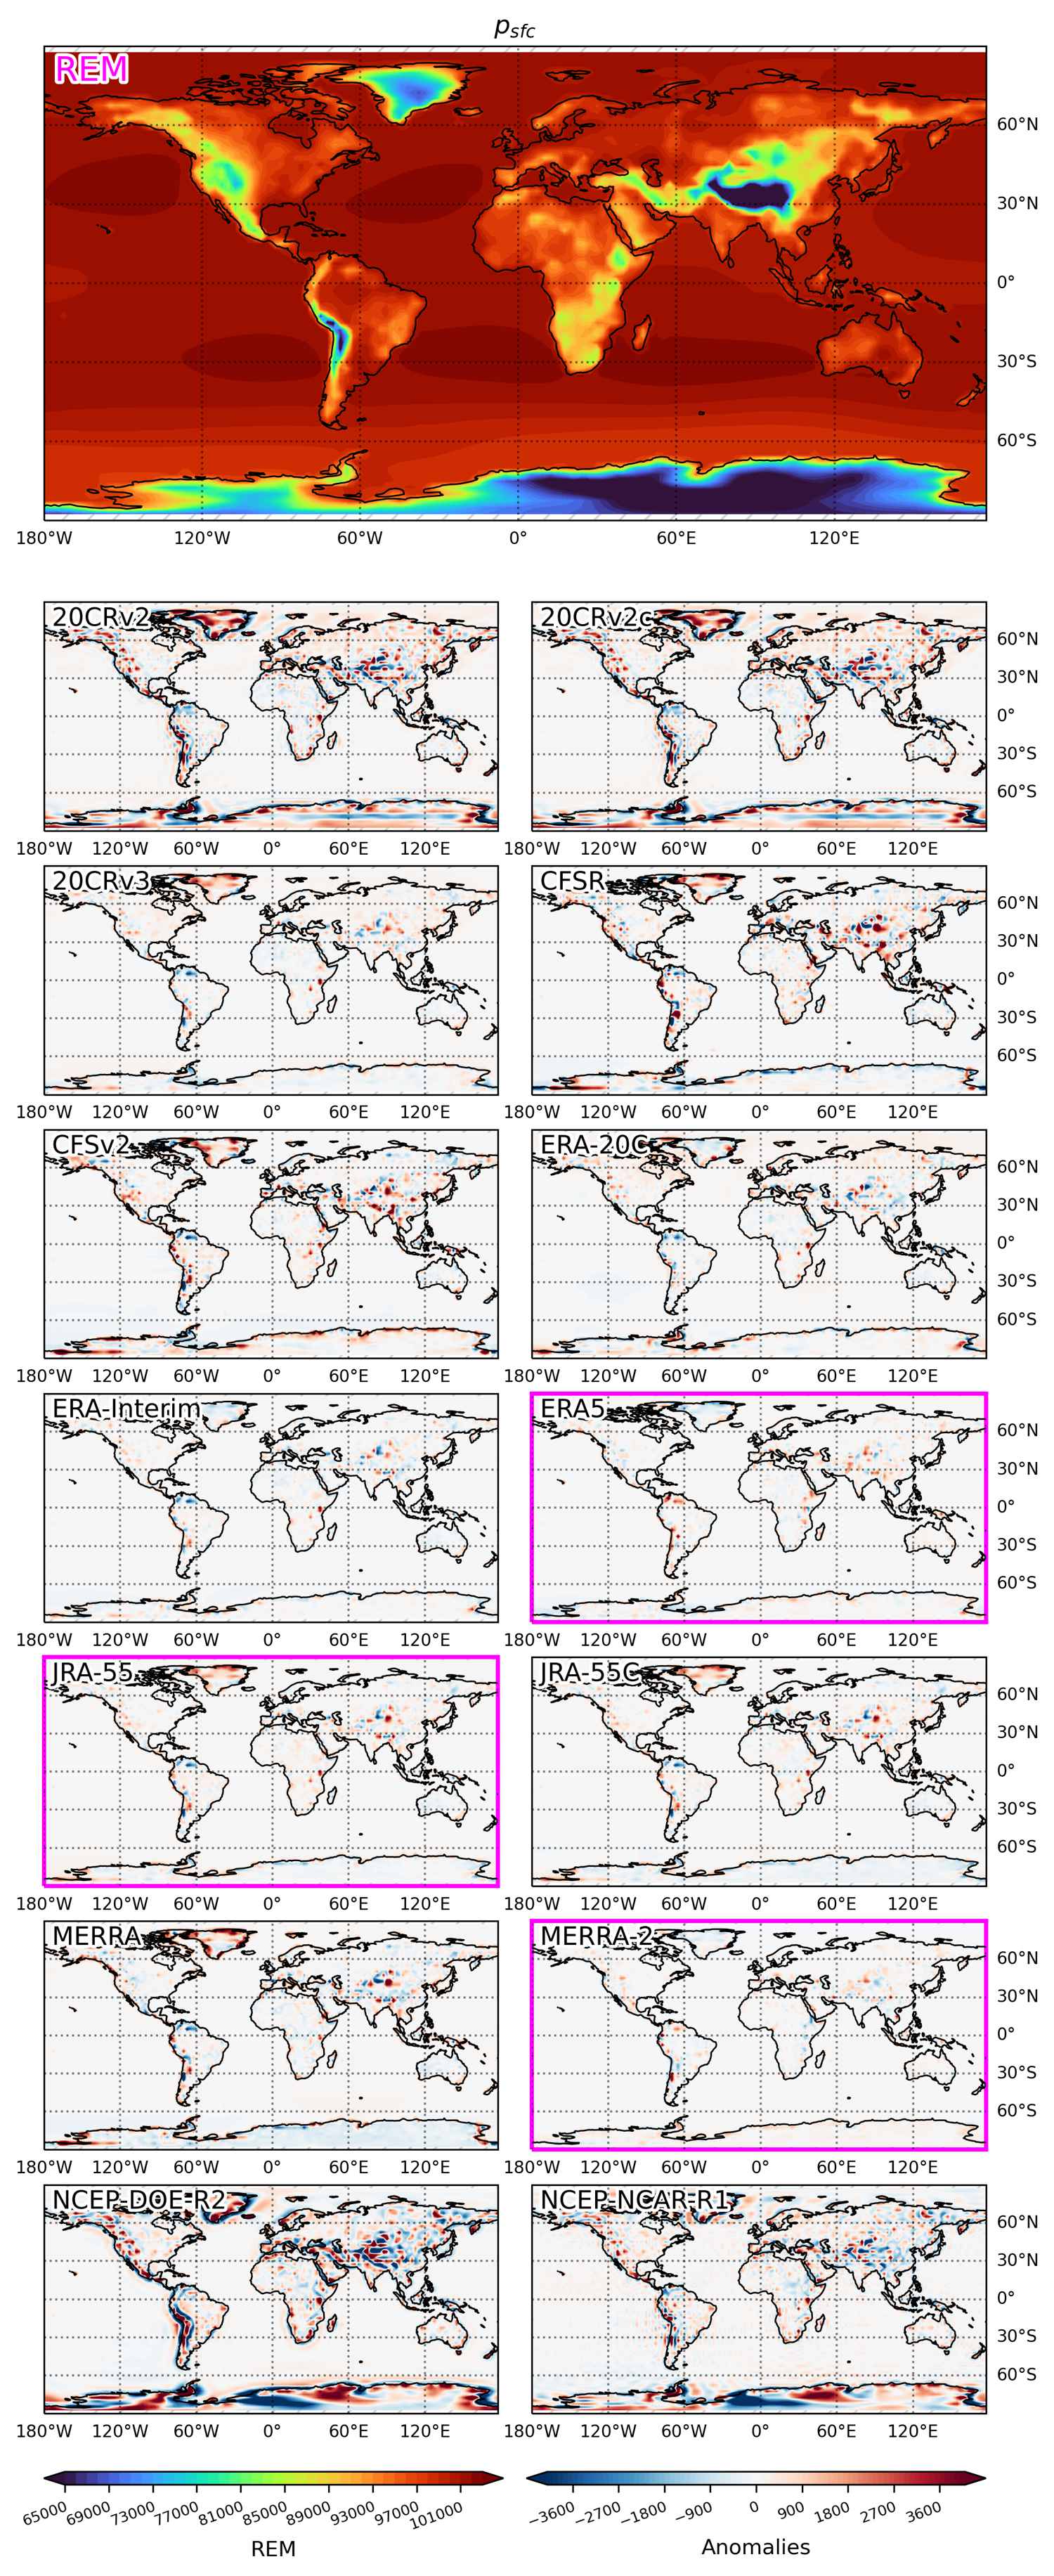
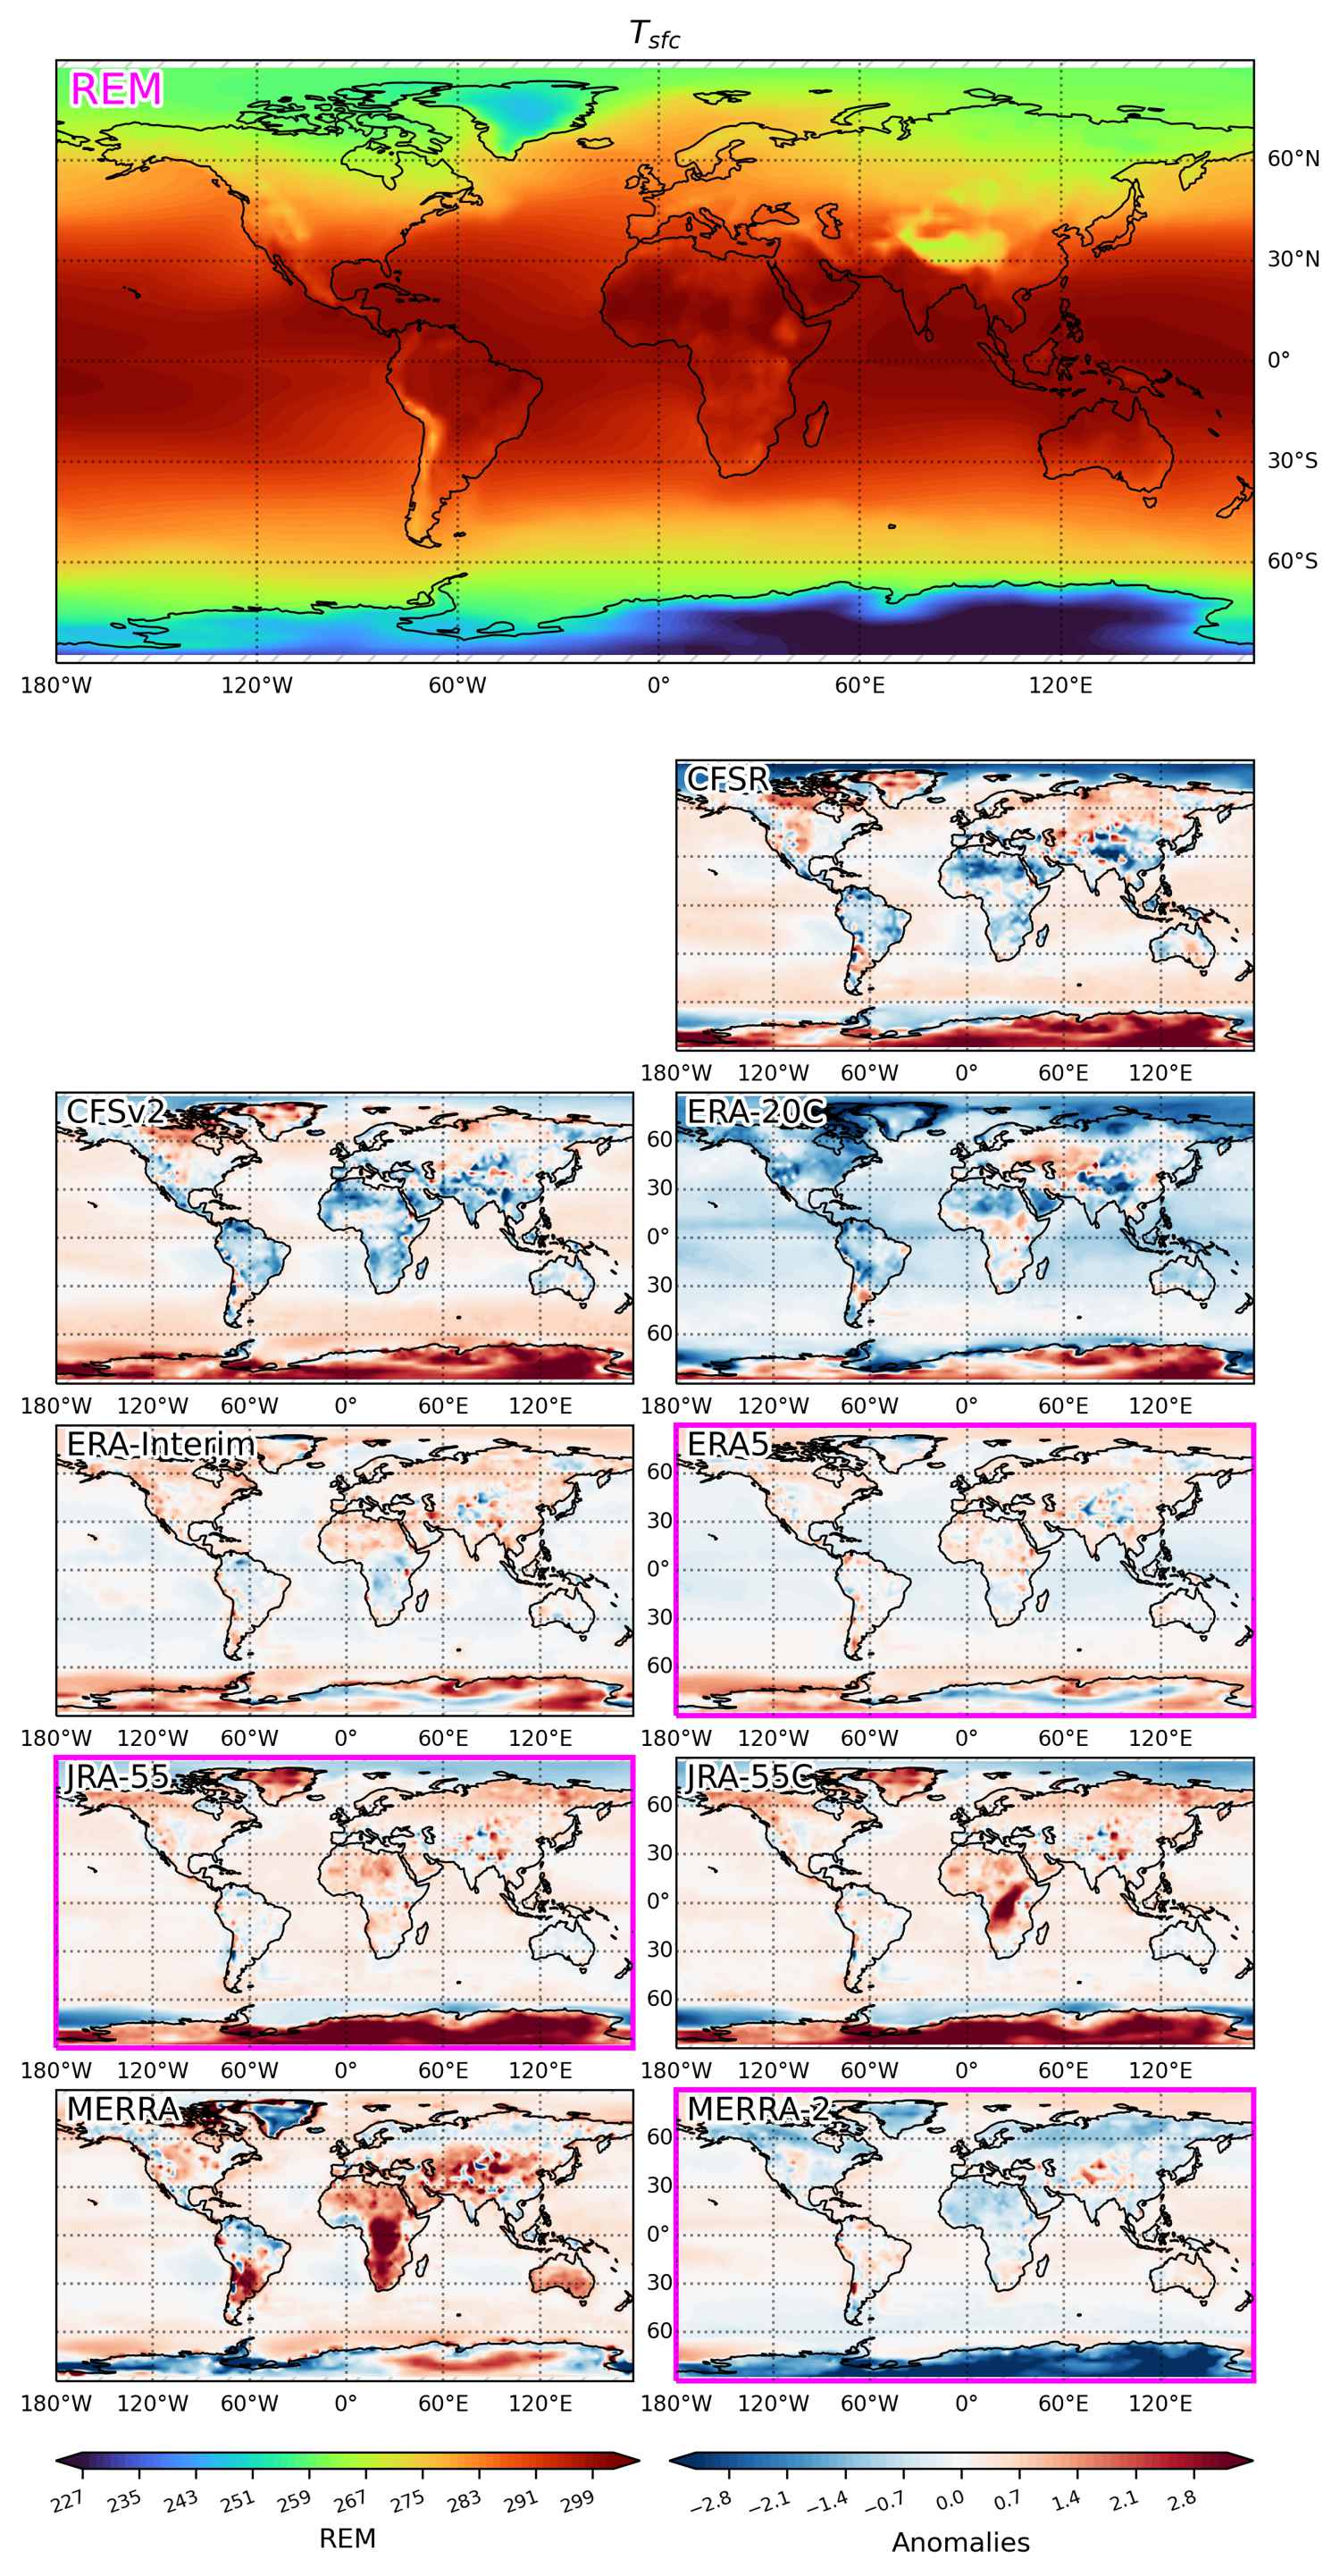
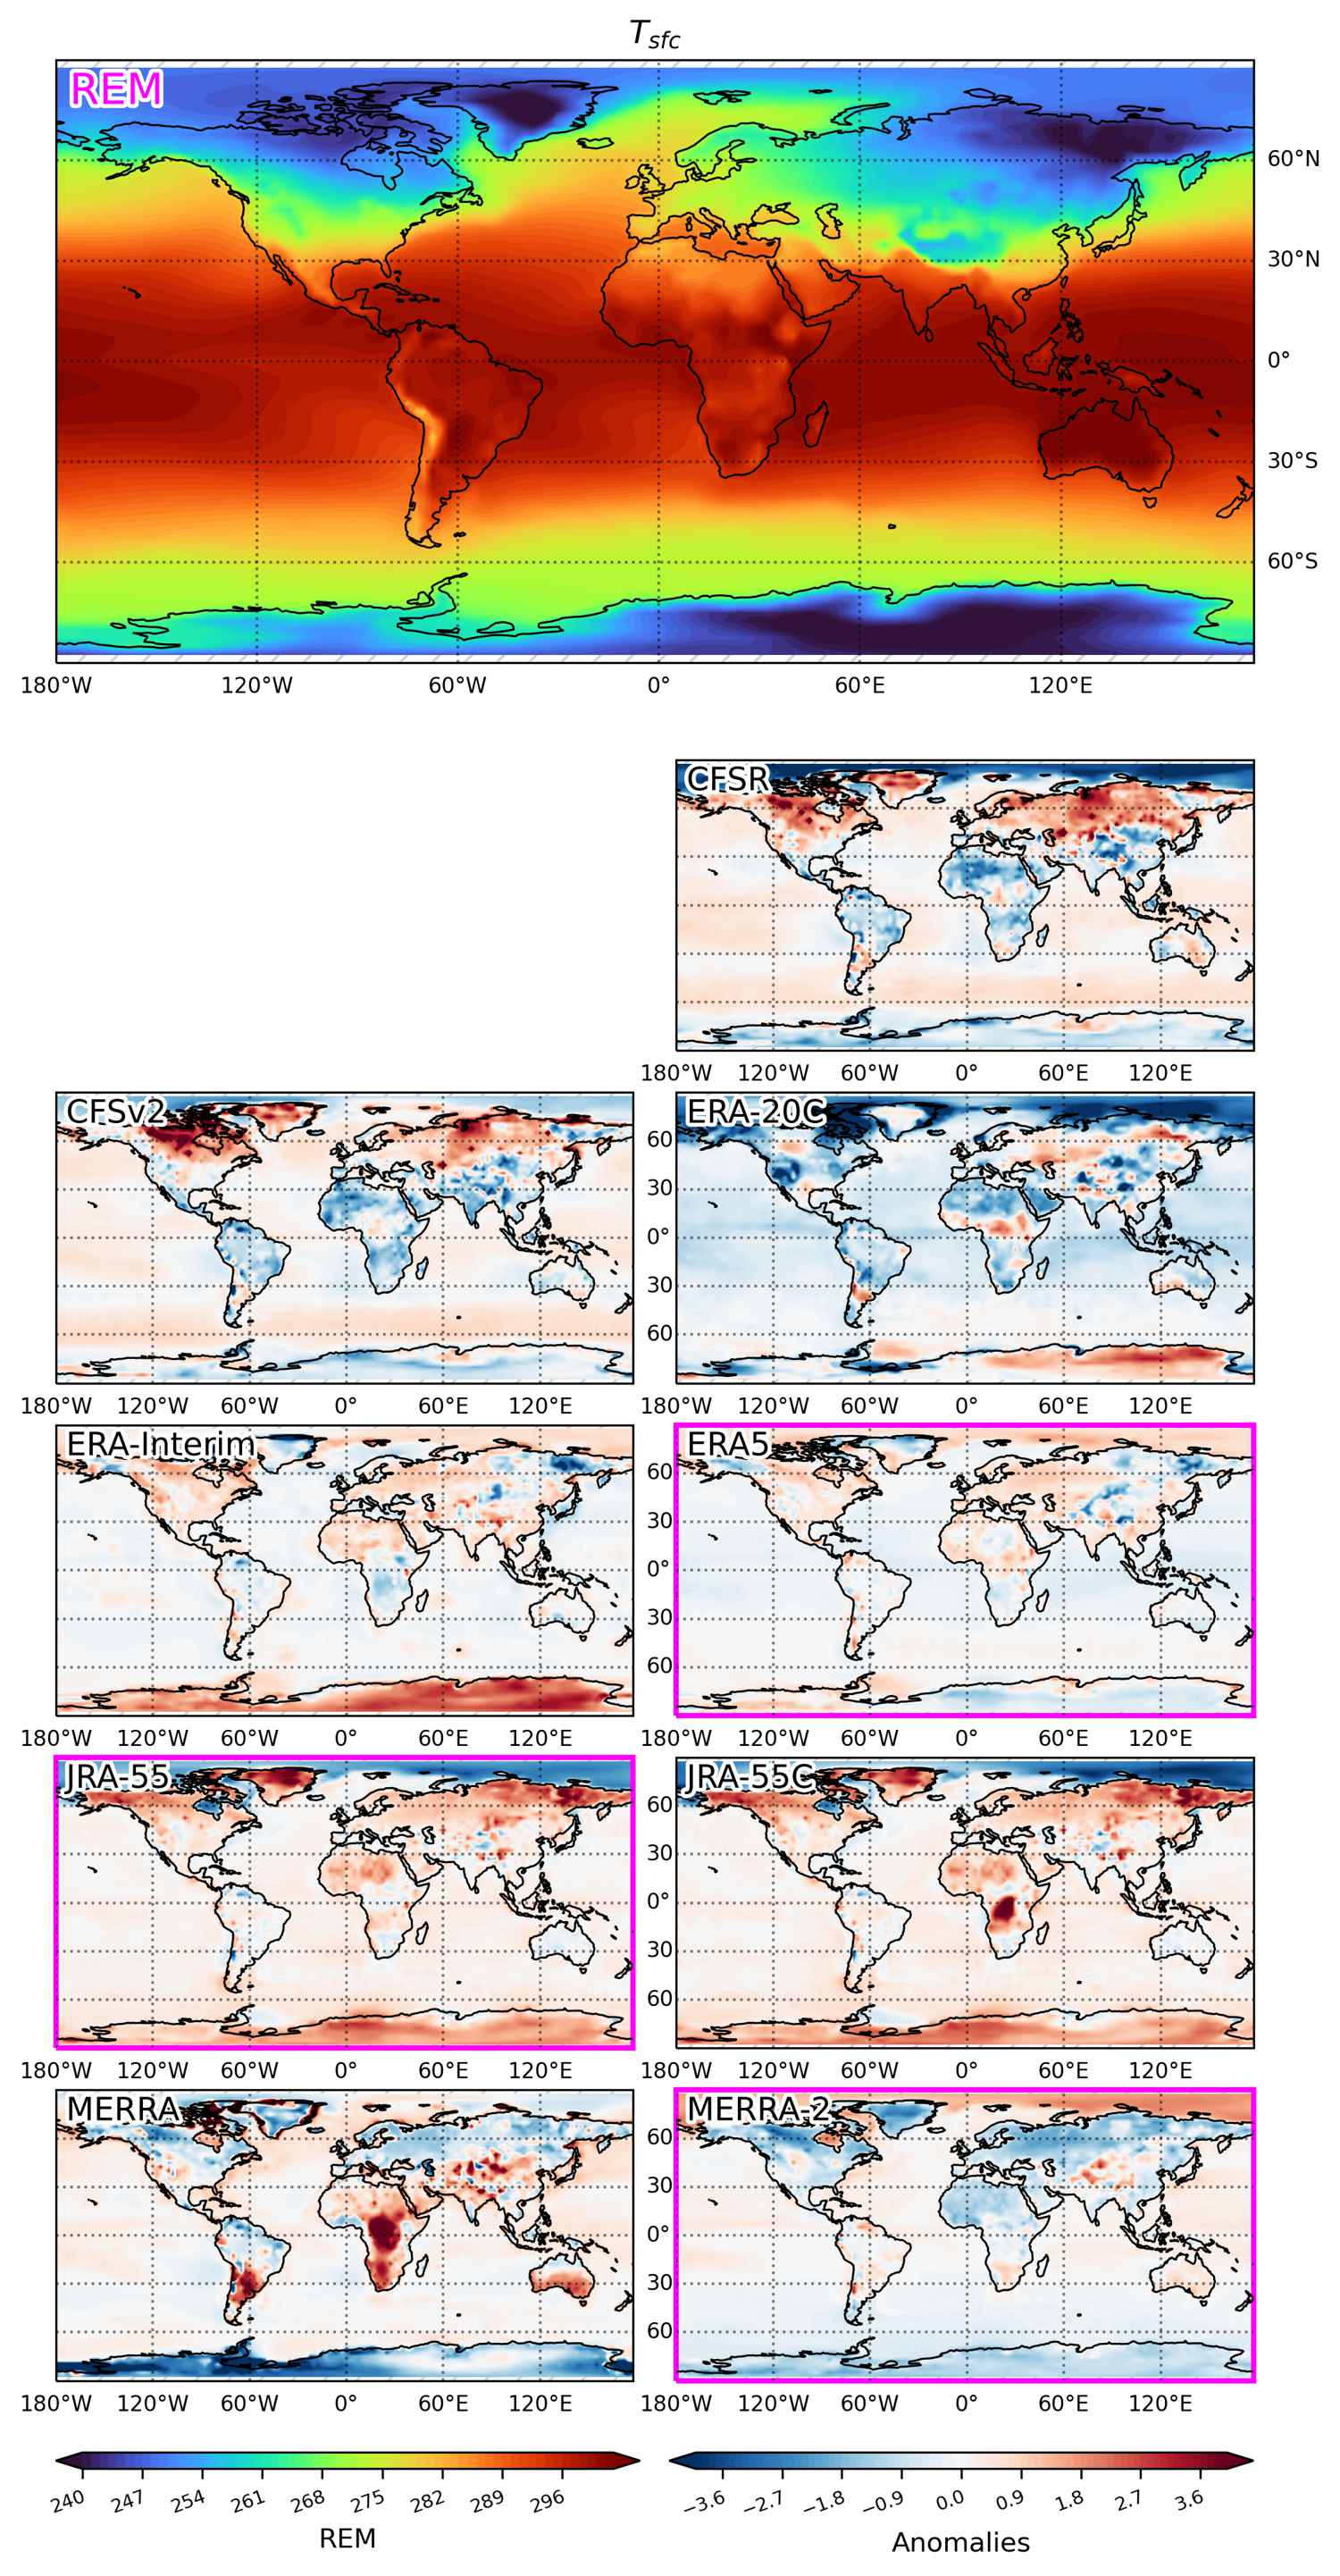
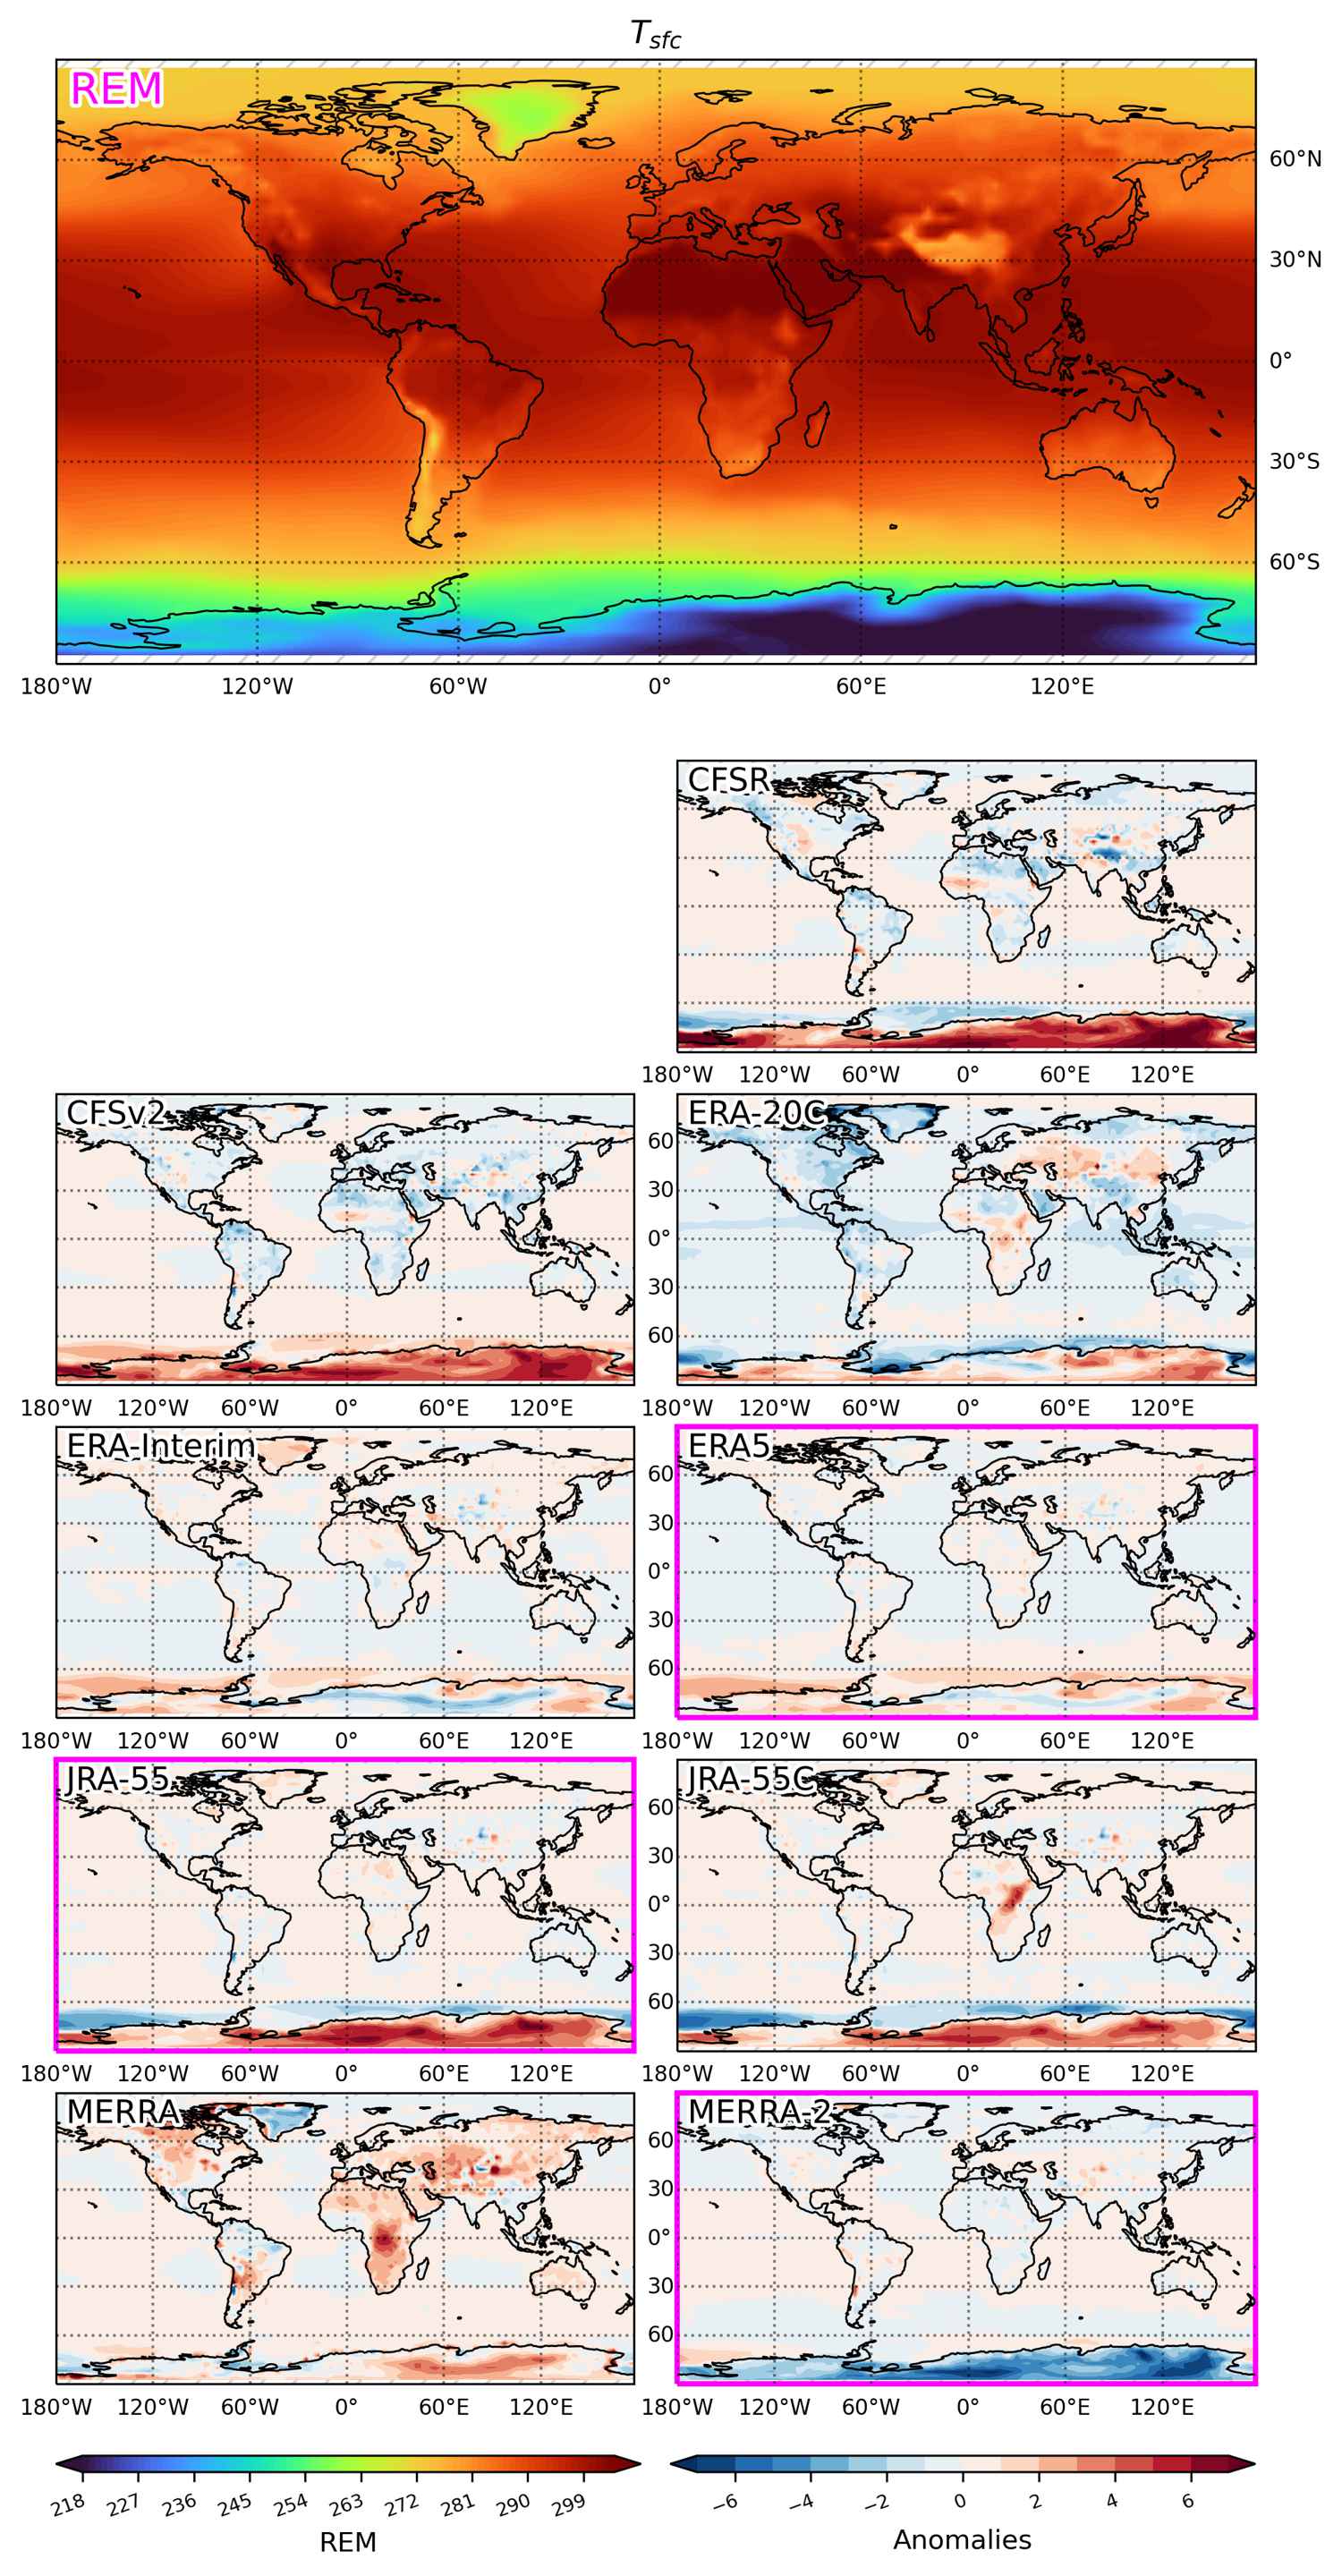
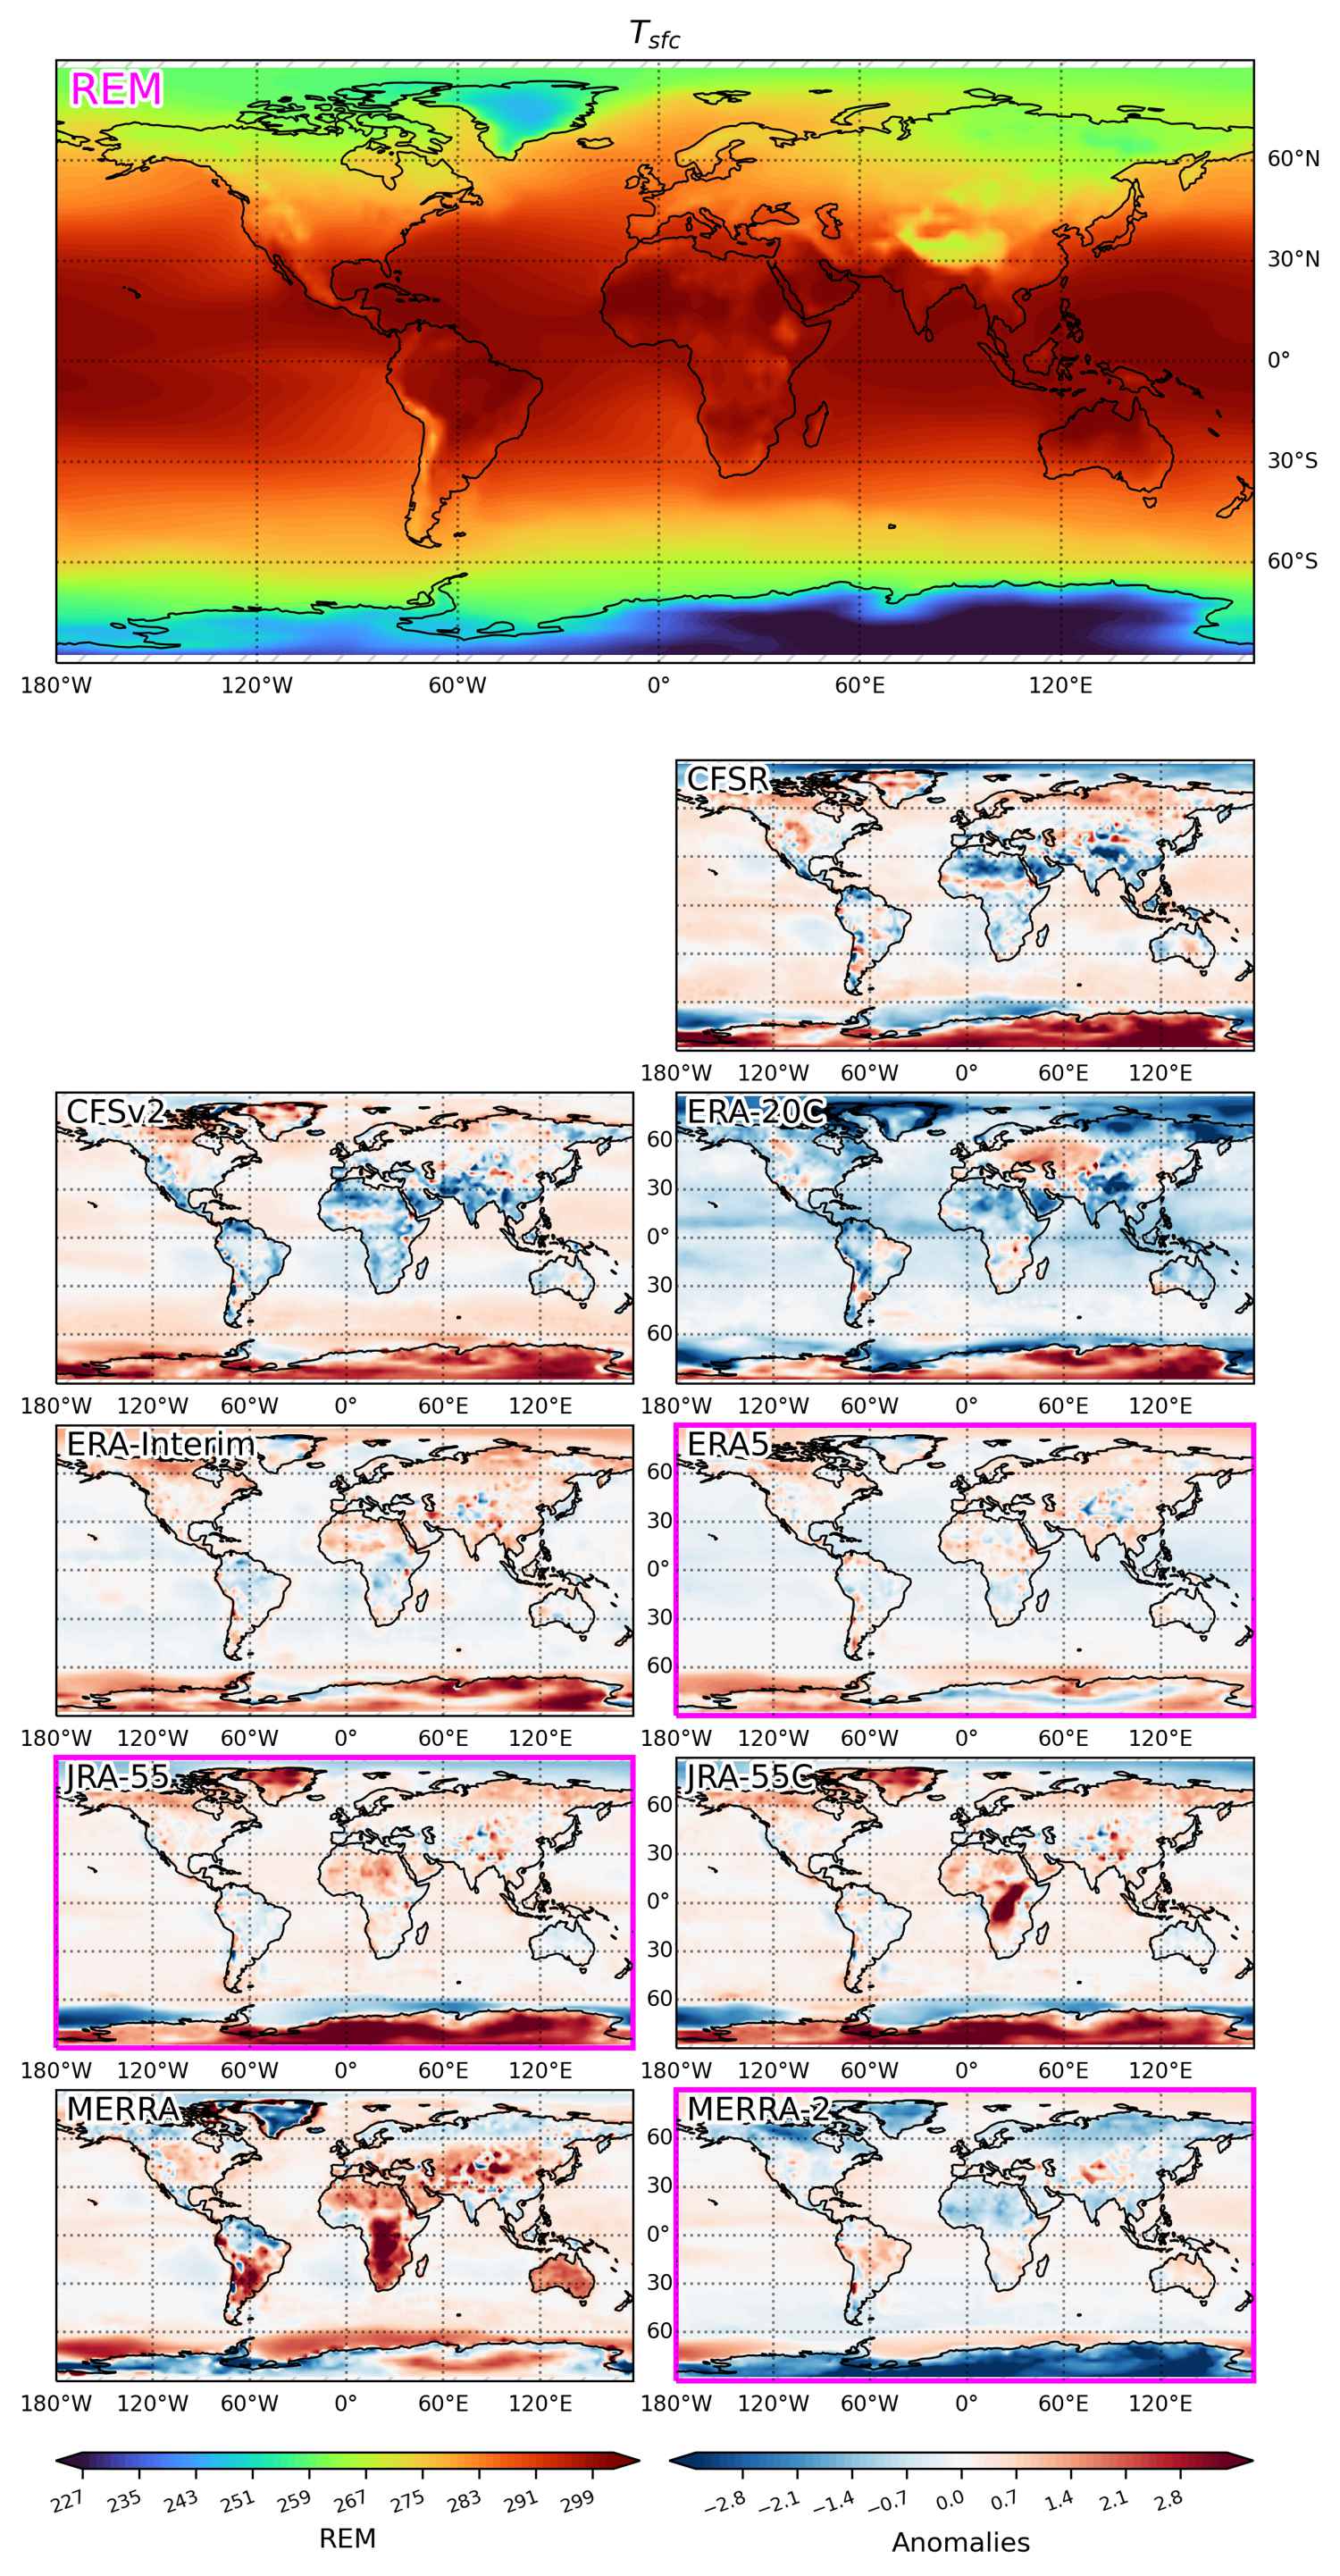
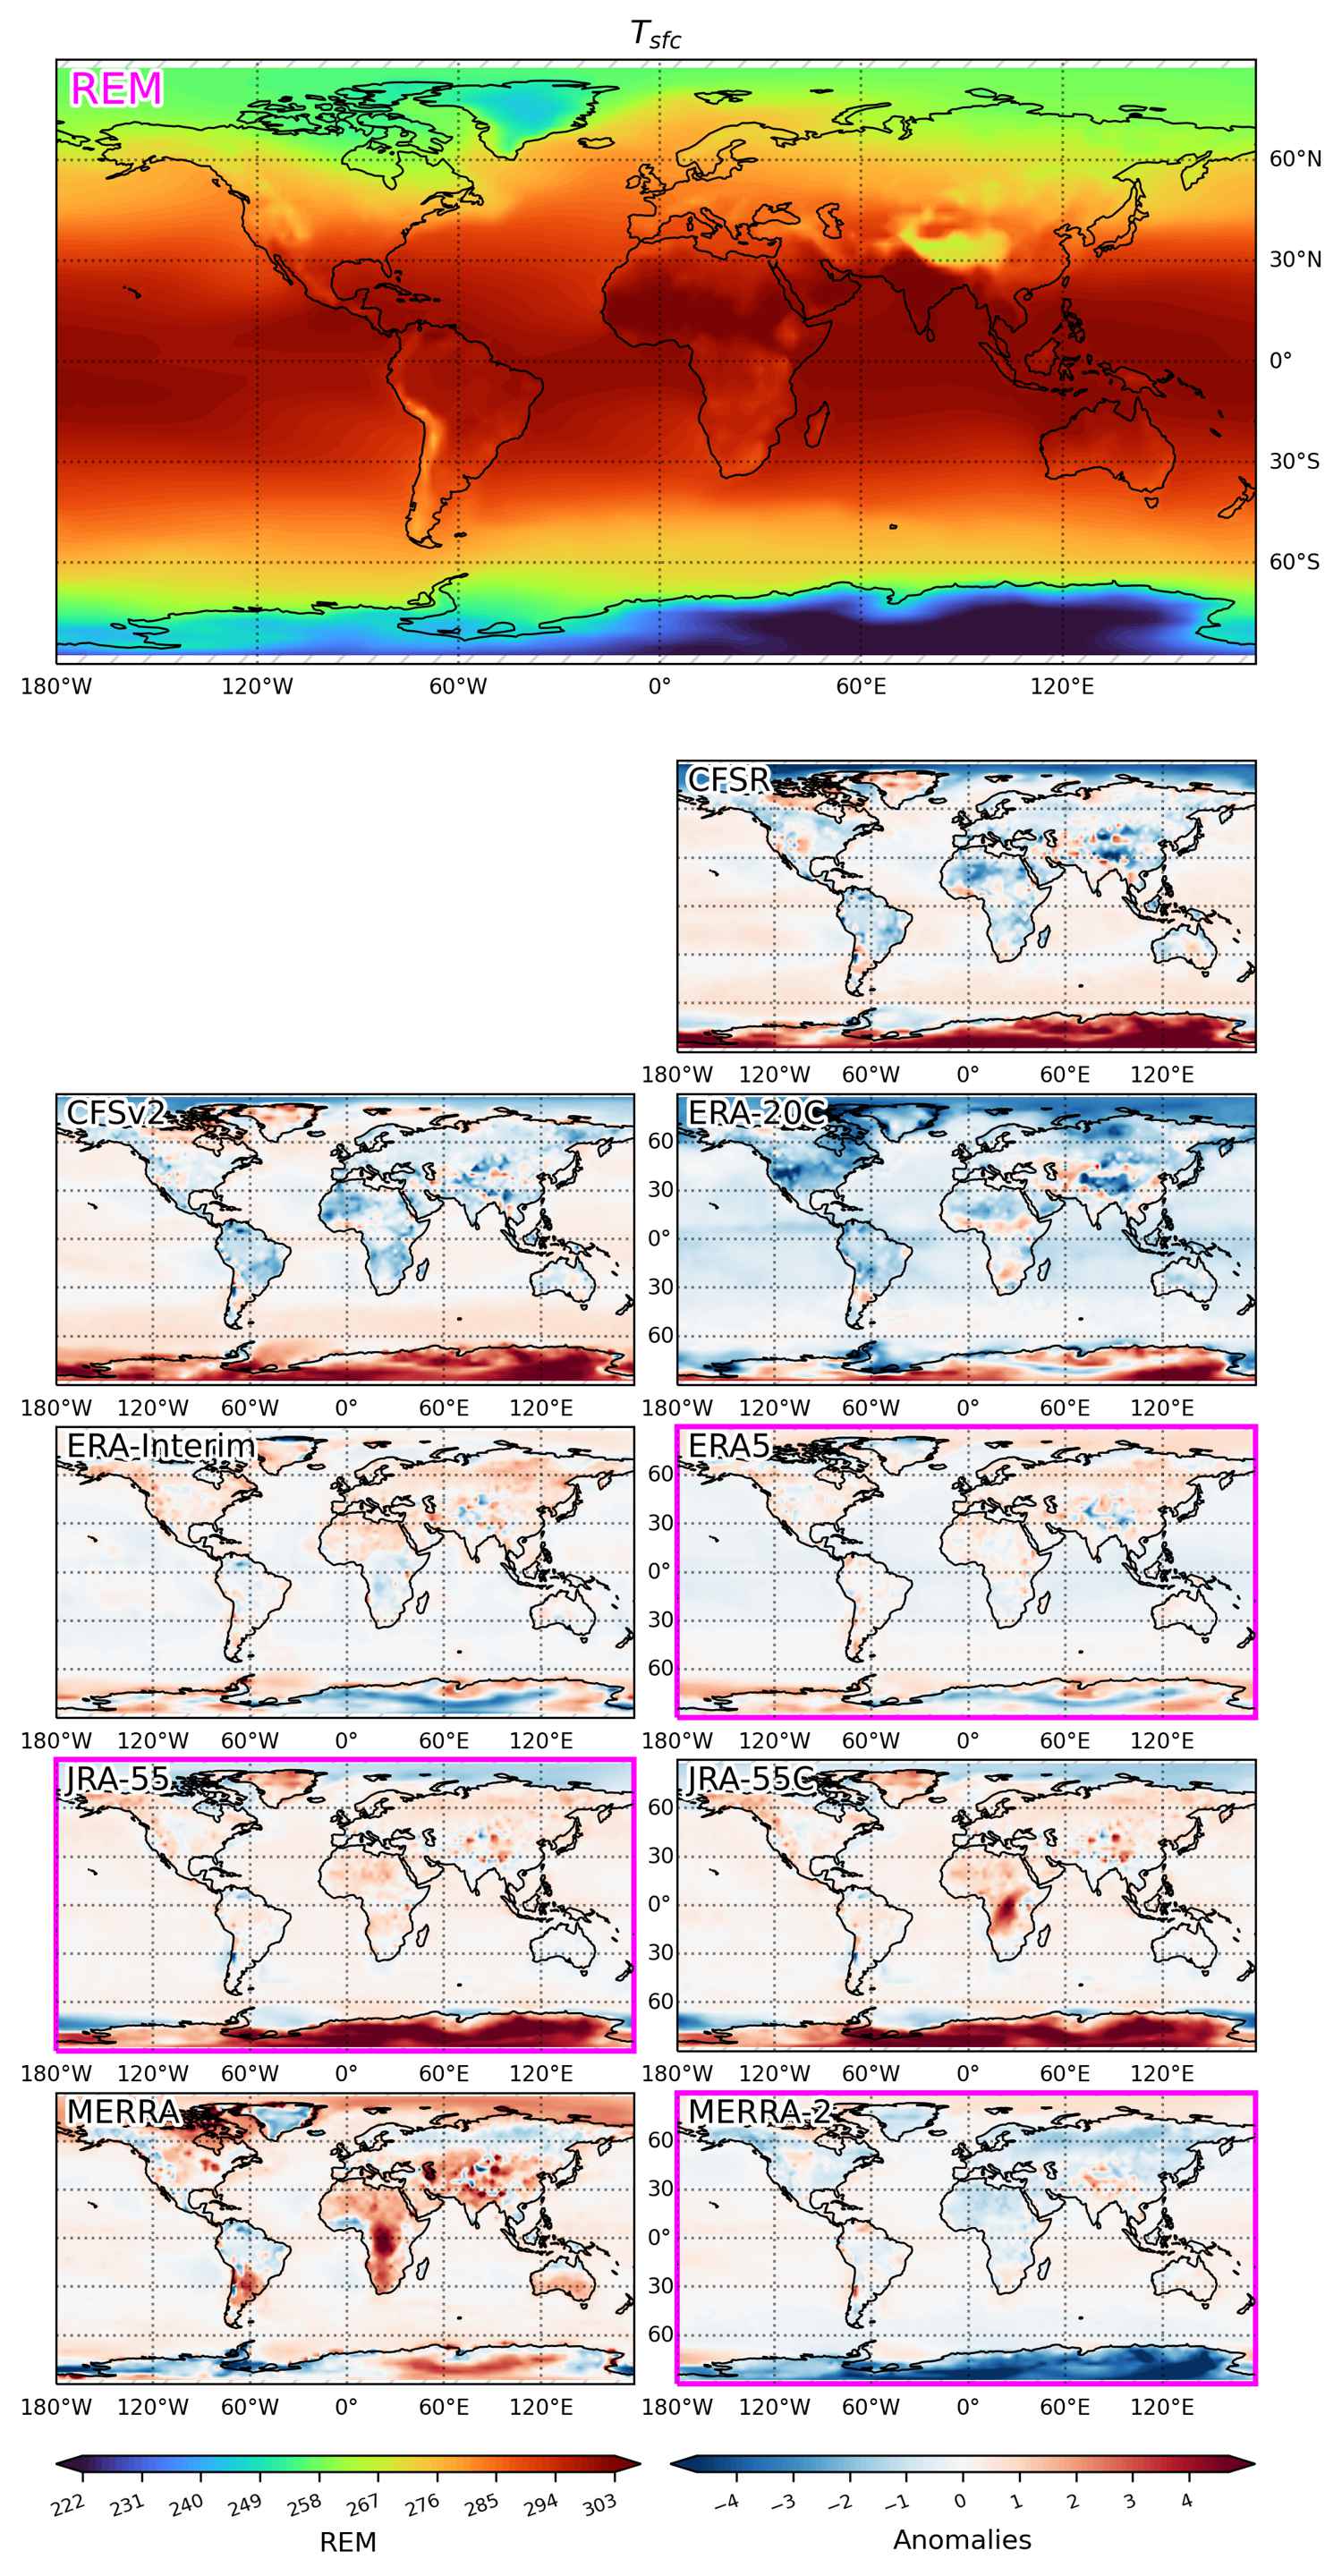
The 2010-2020 climatology is shown at the surface. The upper panel shows the reanalysis ensemble mean (REM) which comprises the datasets bordered in magenta. The lower panels show the bias of each dataset with respect to the REM.
Climatology of mslp (Mean sea level pressure)
| ALL | DJF | JJA | SON | MAM |
|---|---|---|---|---|
 |
 |
 |
 |
 |
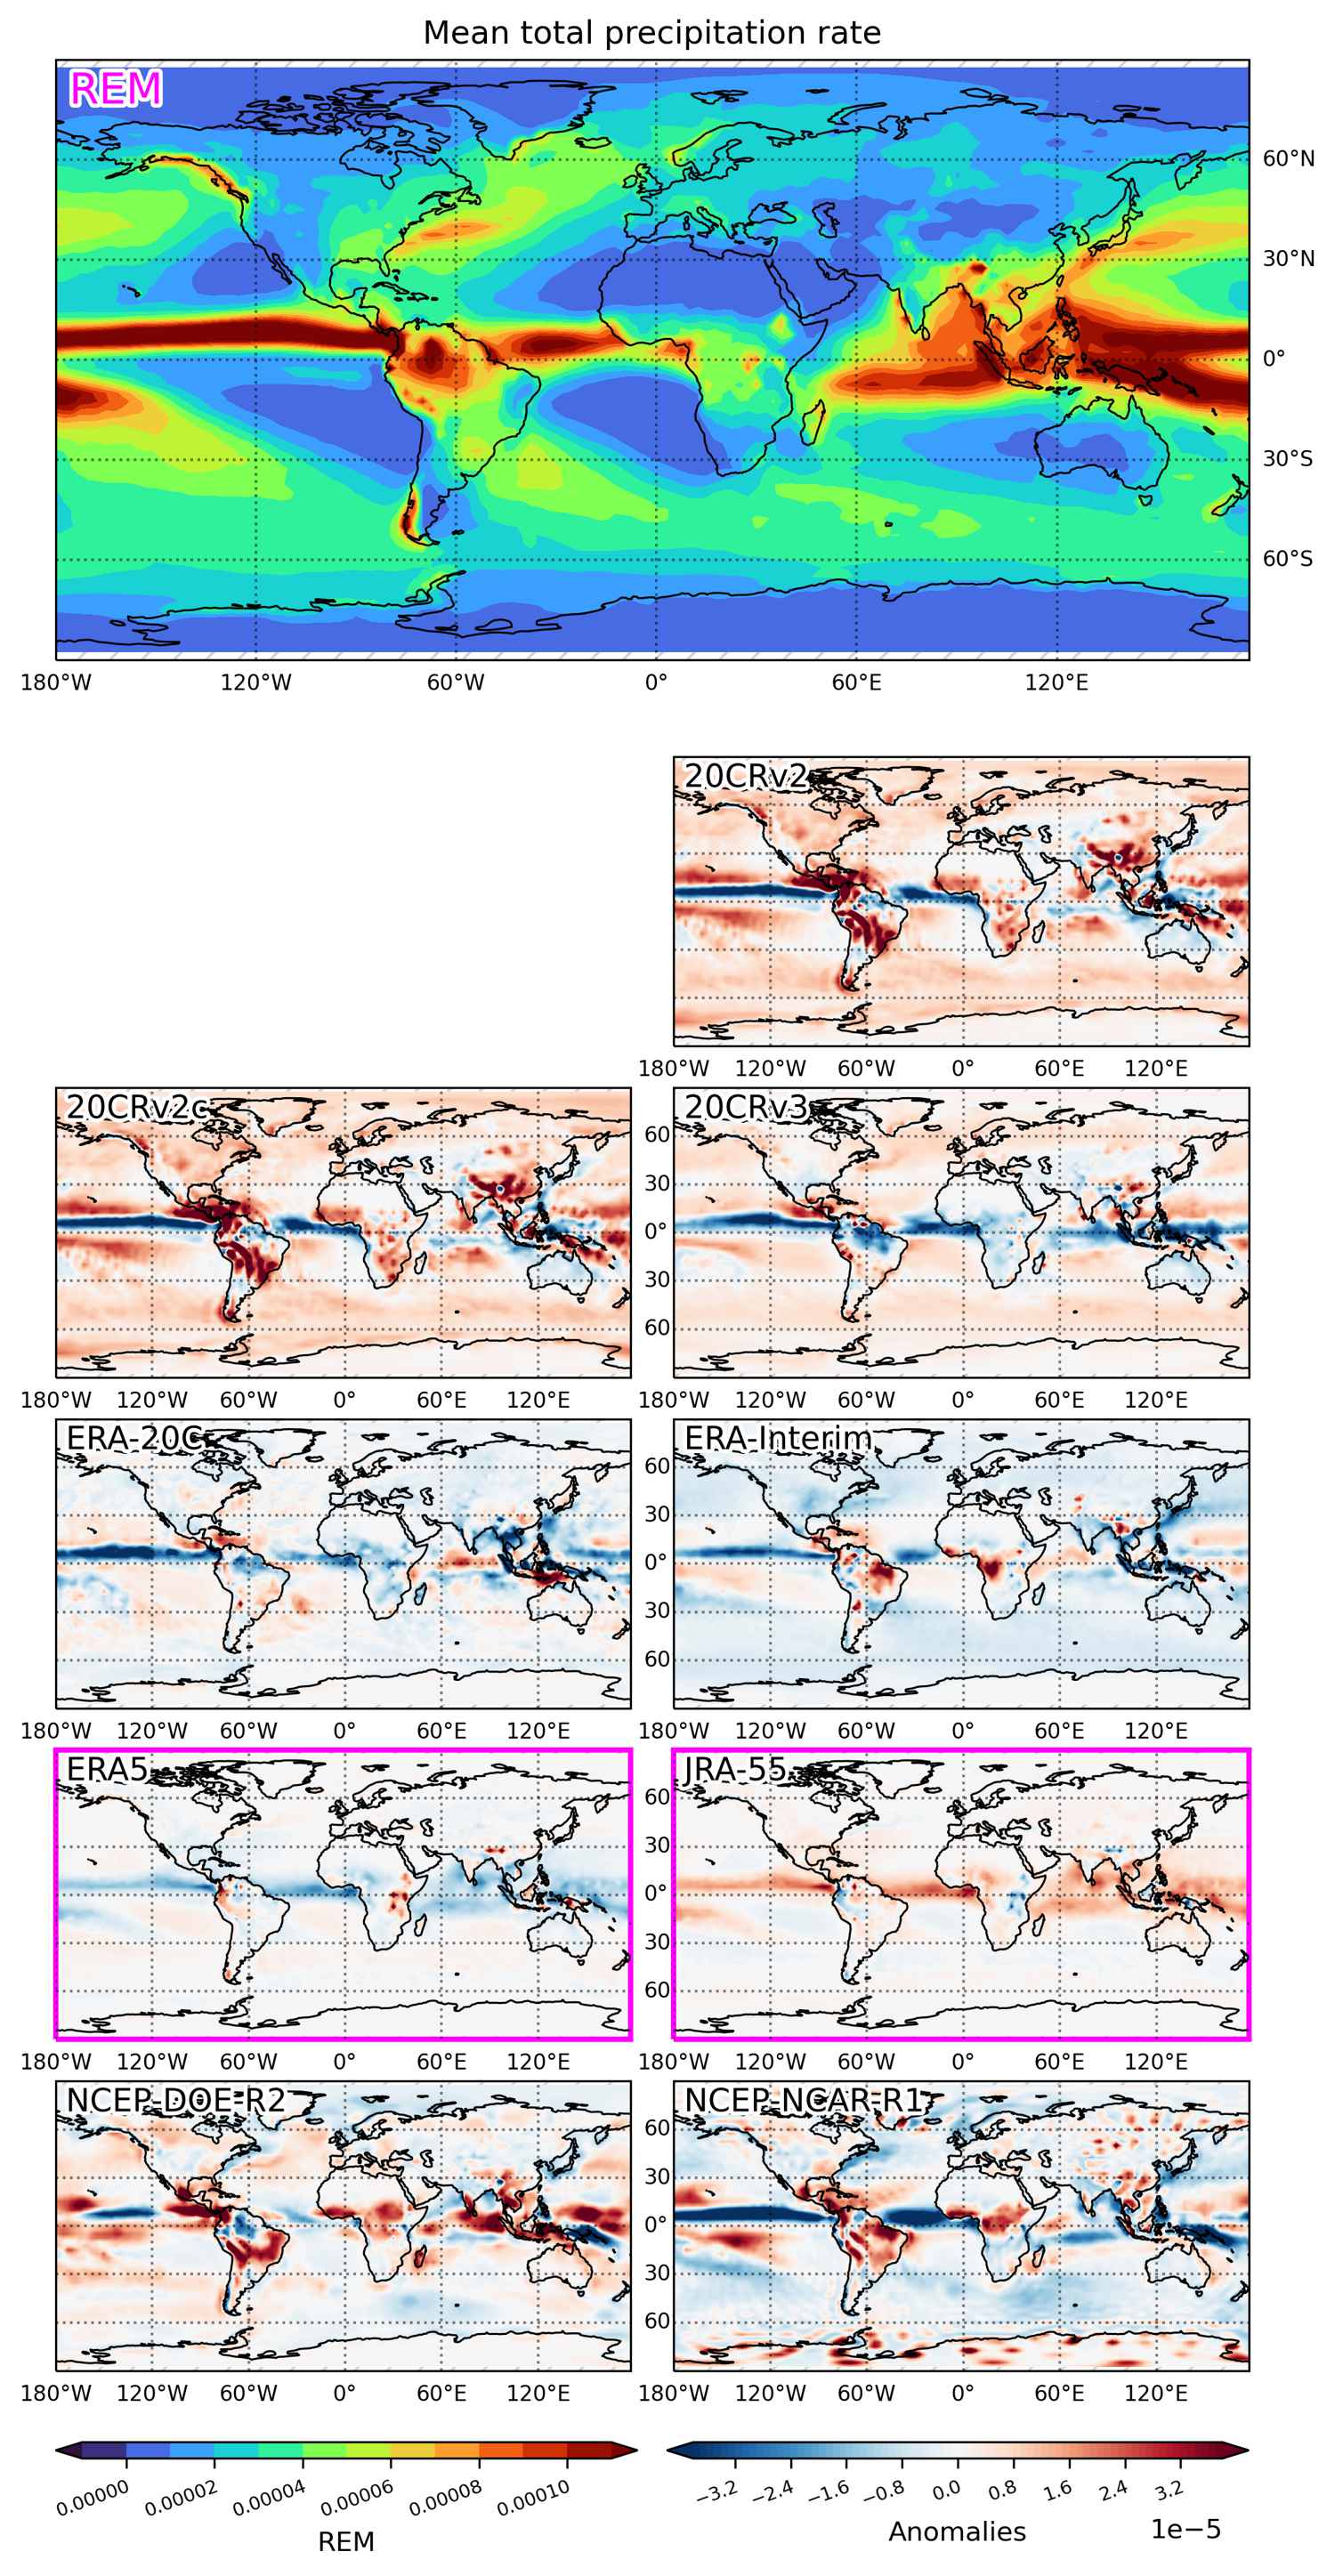
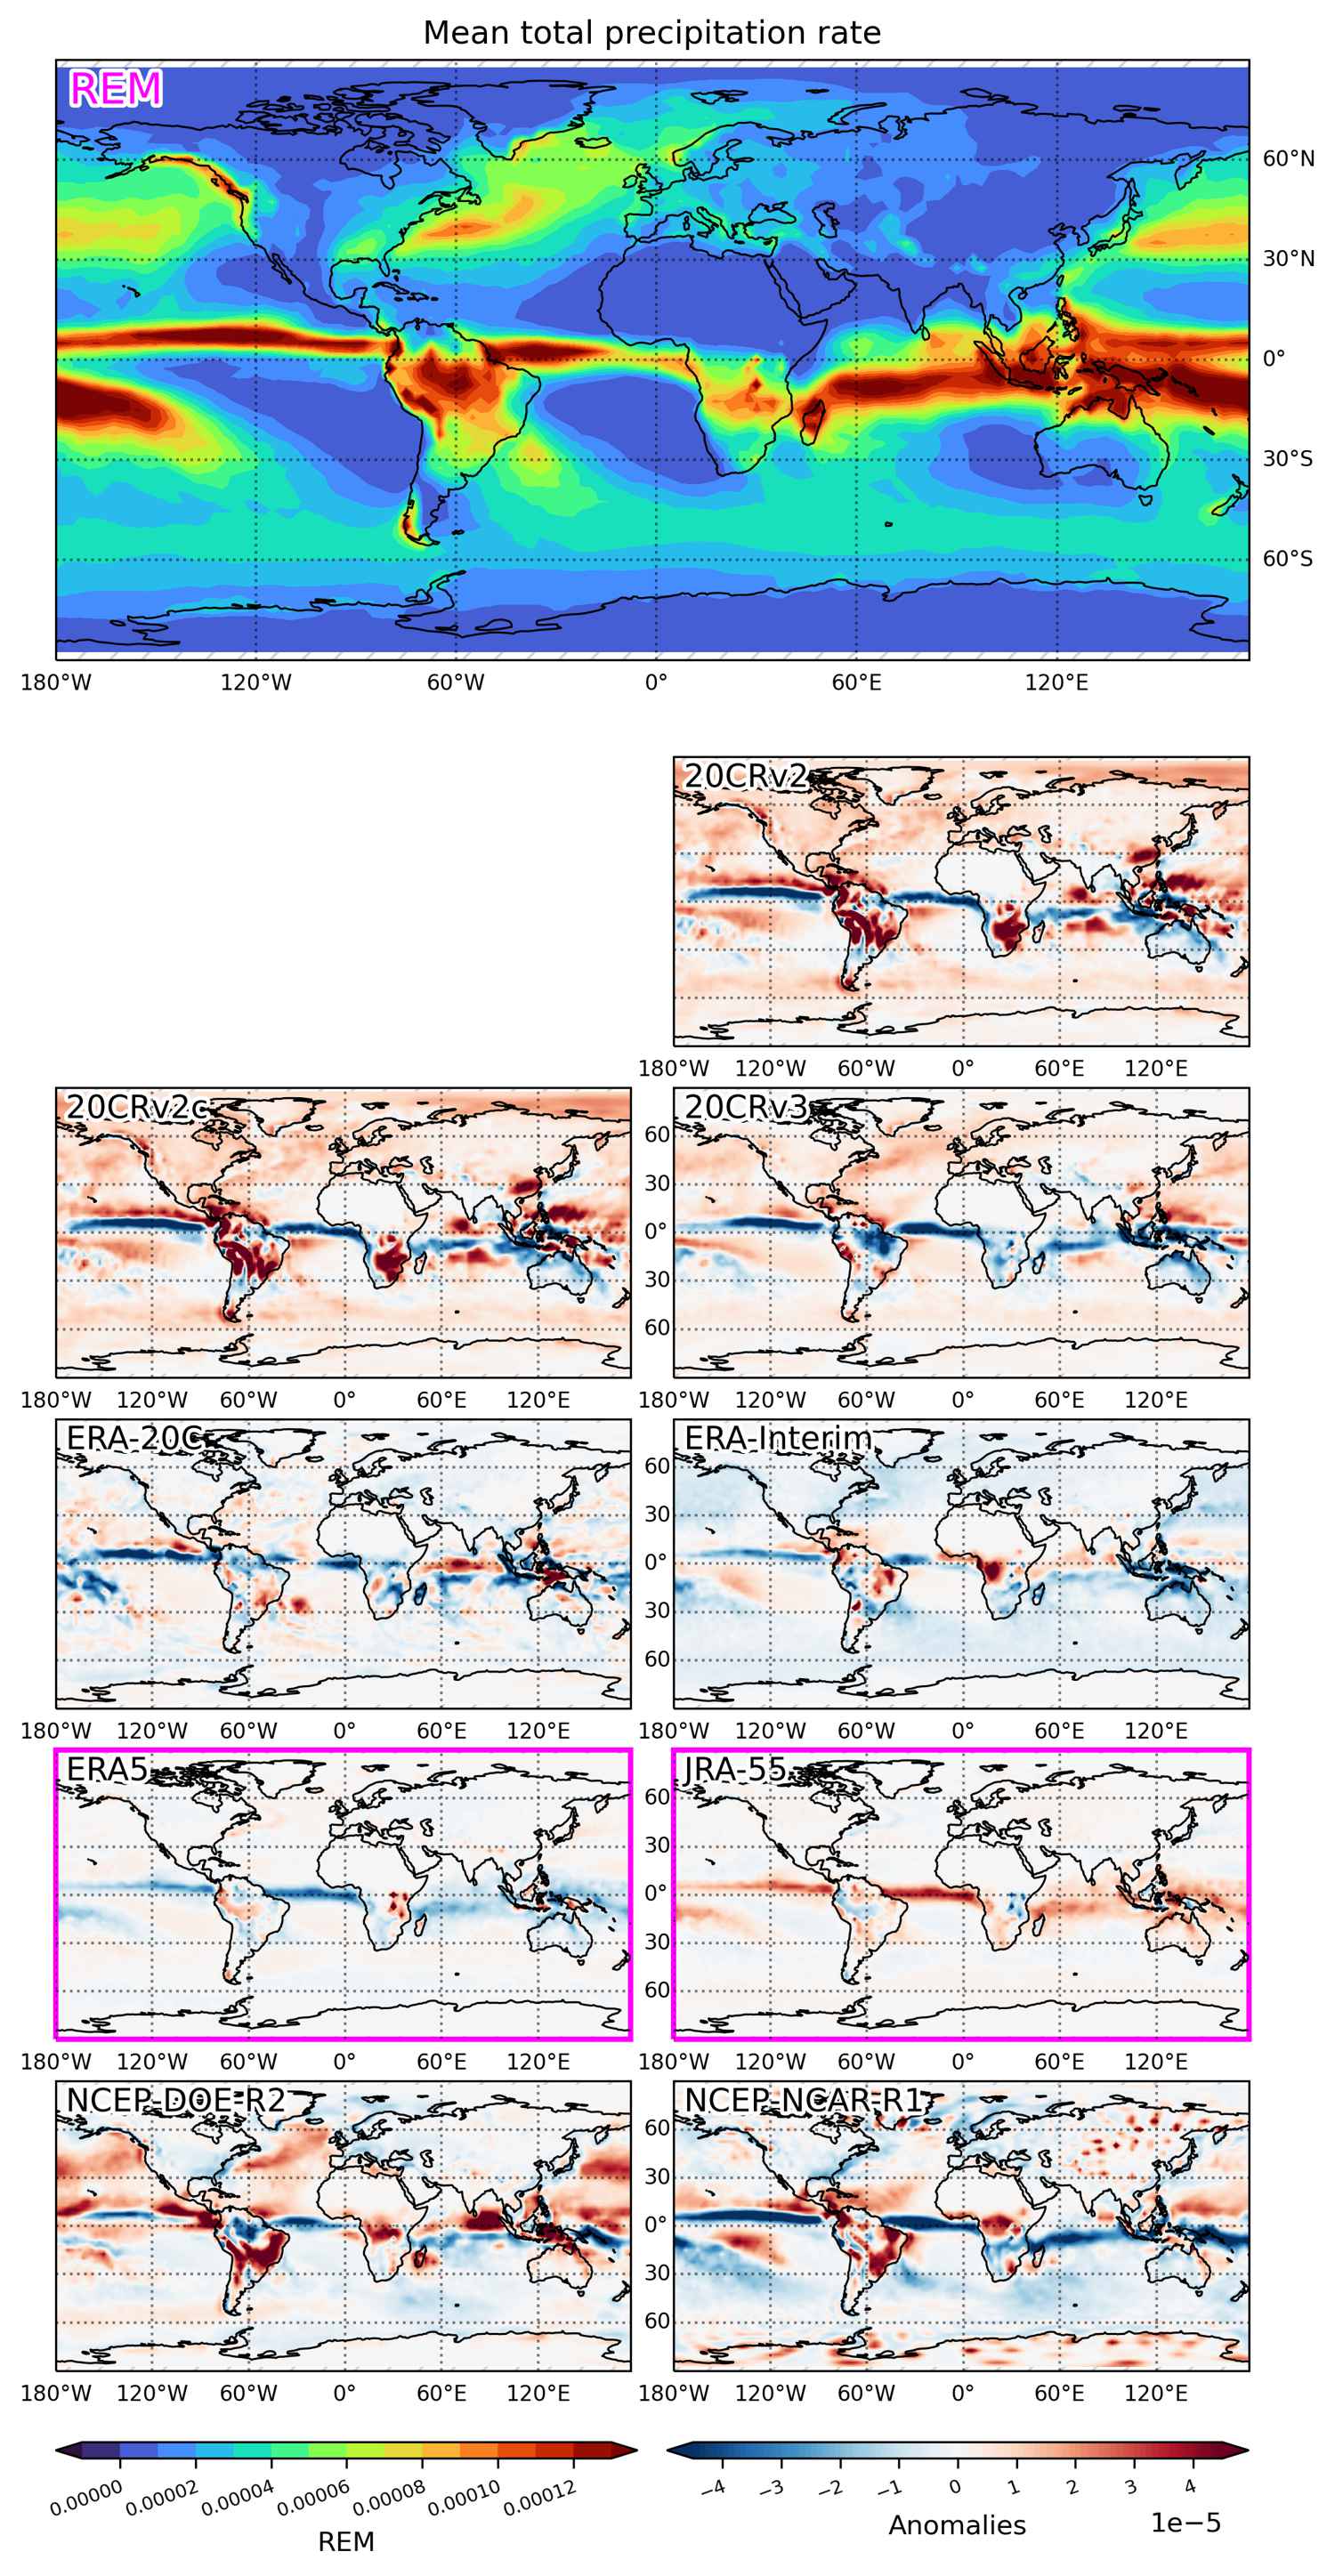
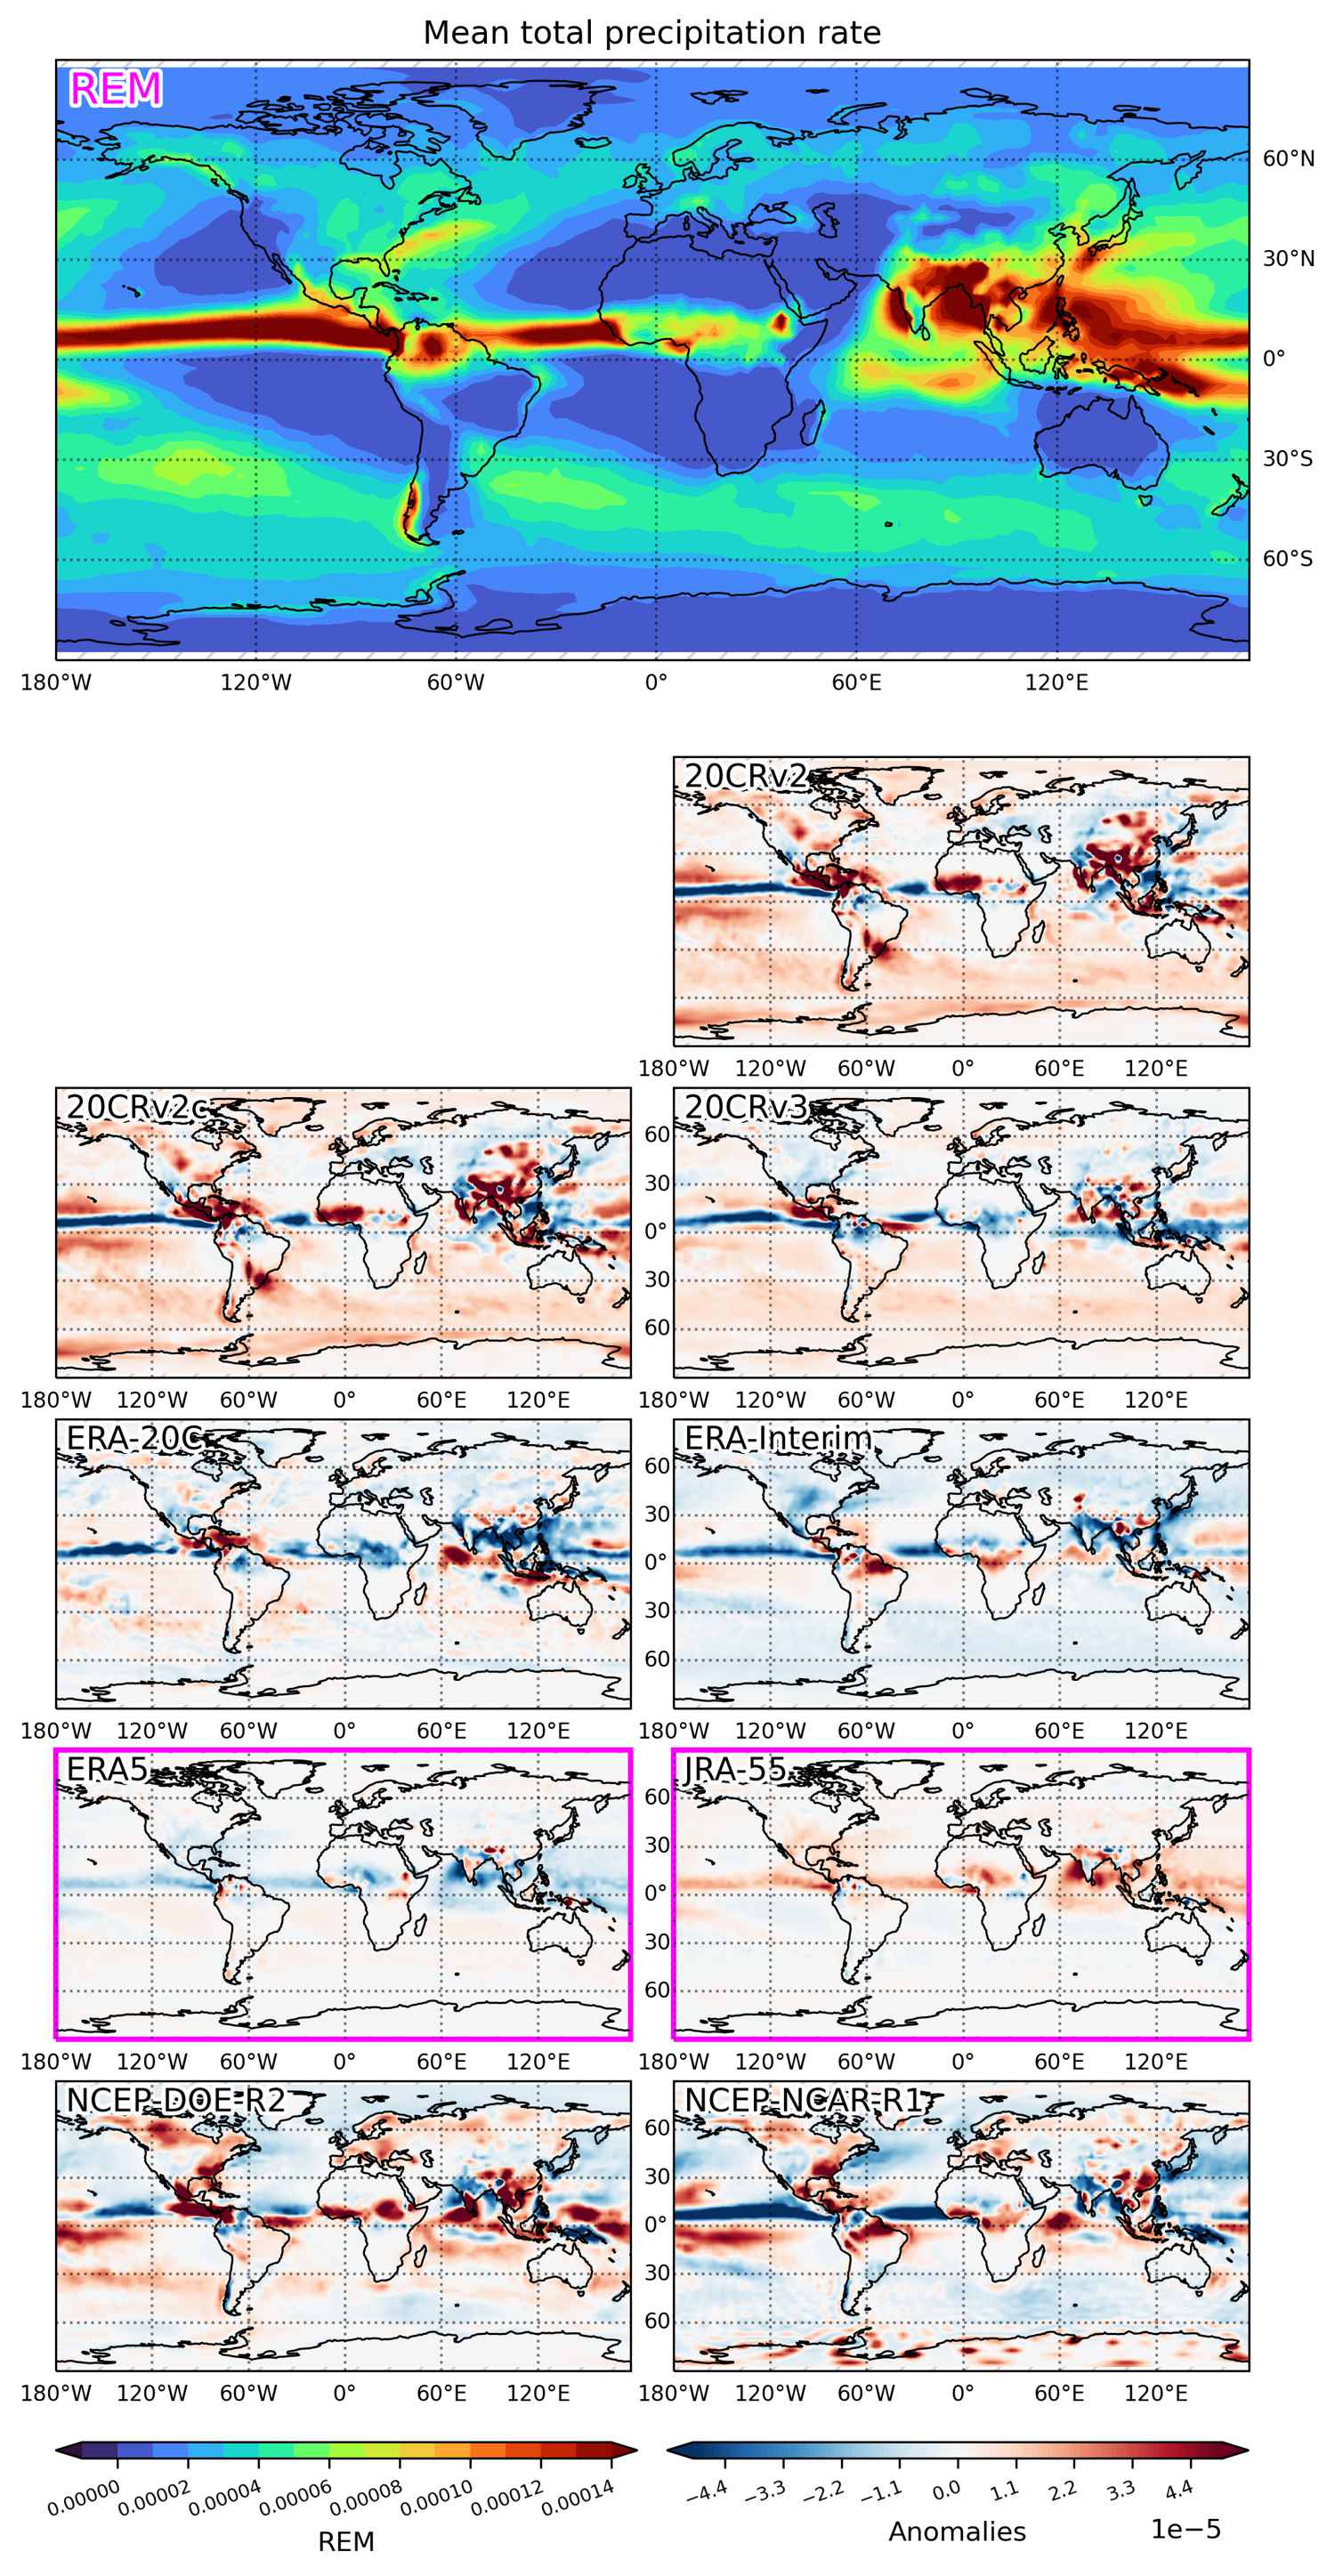
Climatology of precip (Mean total precipitation rate)
| ALL | DJF | JJA | MAM | SON |
|---|---|---|---|---|
 |
 |
 |
 |
 |
Climatology of sp (Surface pressure)
| ALL | DJF | MAM | SON | JJA |
|---|---|---|---|---|
 |
 |
 |
 |
 |
Climatology of t2m (2-m temperature)
| ALL | DJF | JJA | SON | MAM |
|---|---|---|---|---|
 |
 |
 |
 |
 |