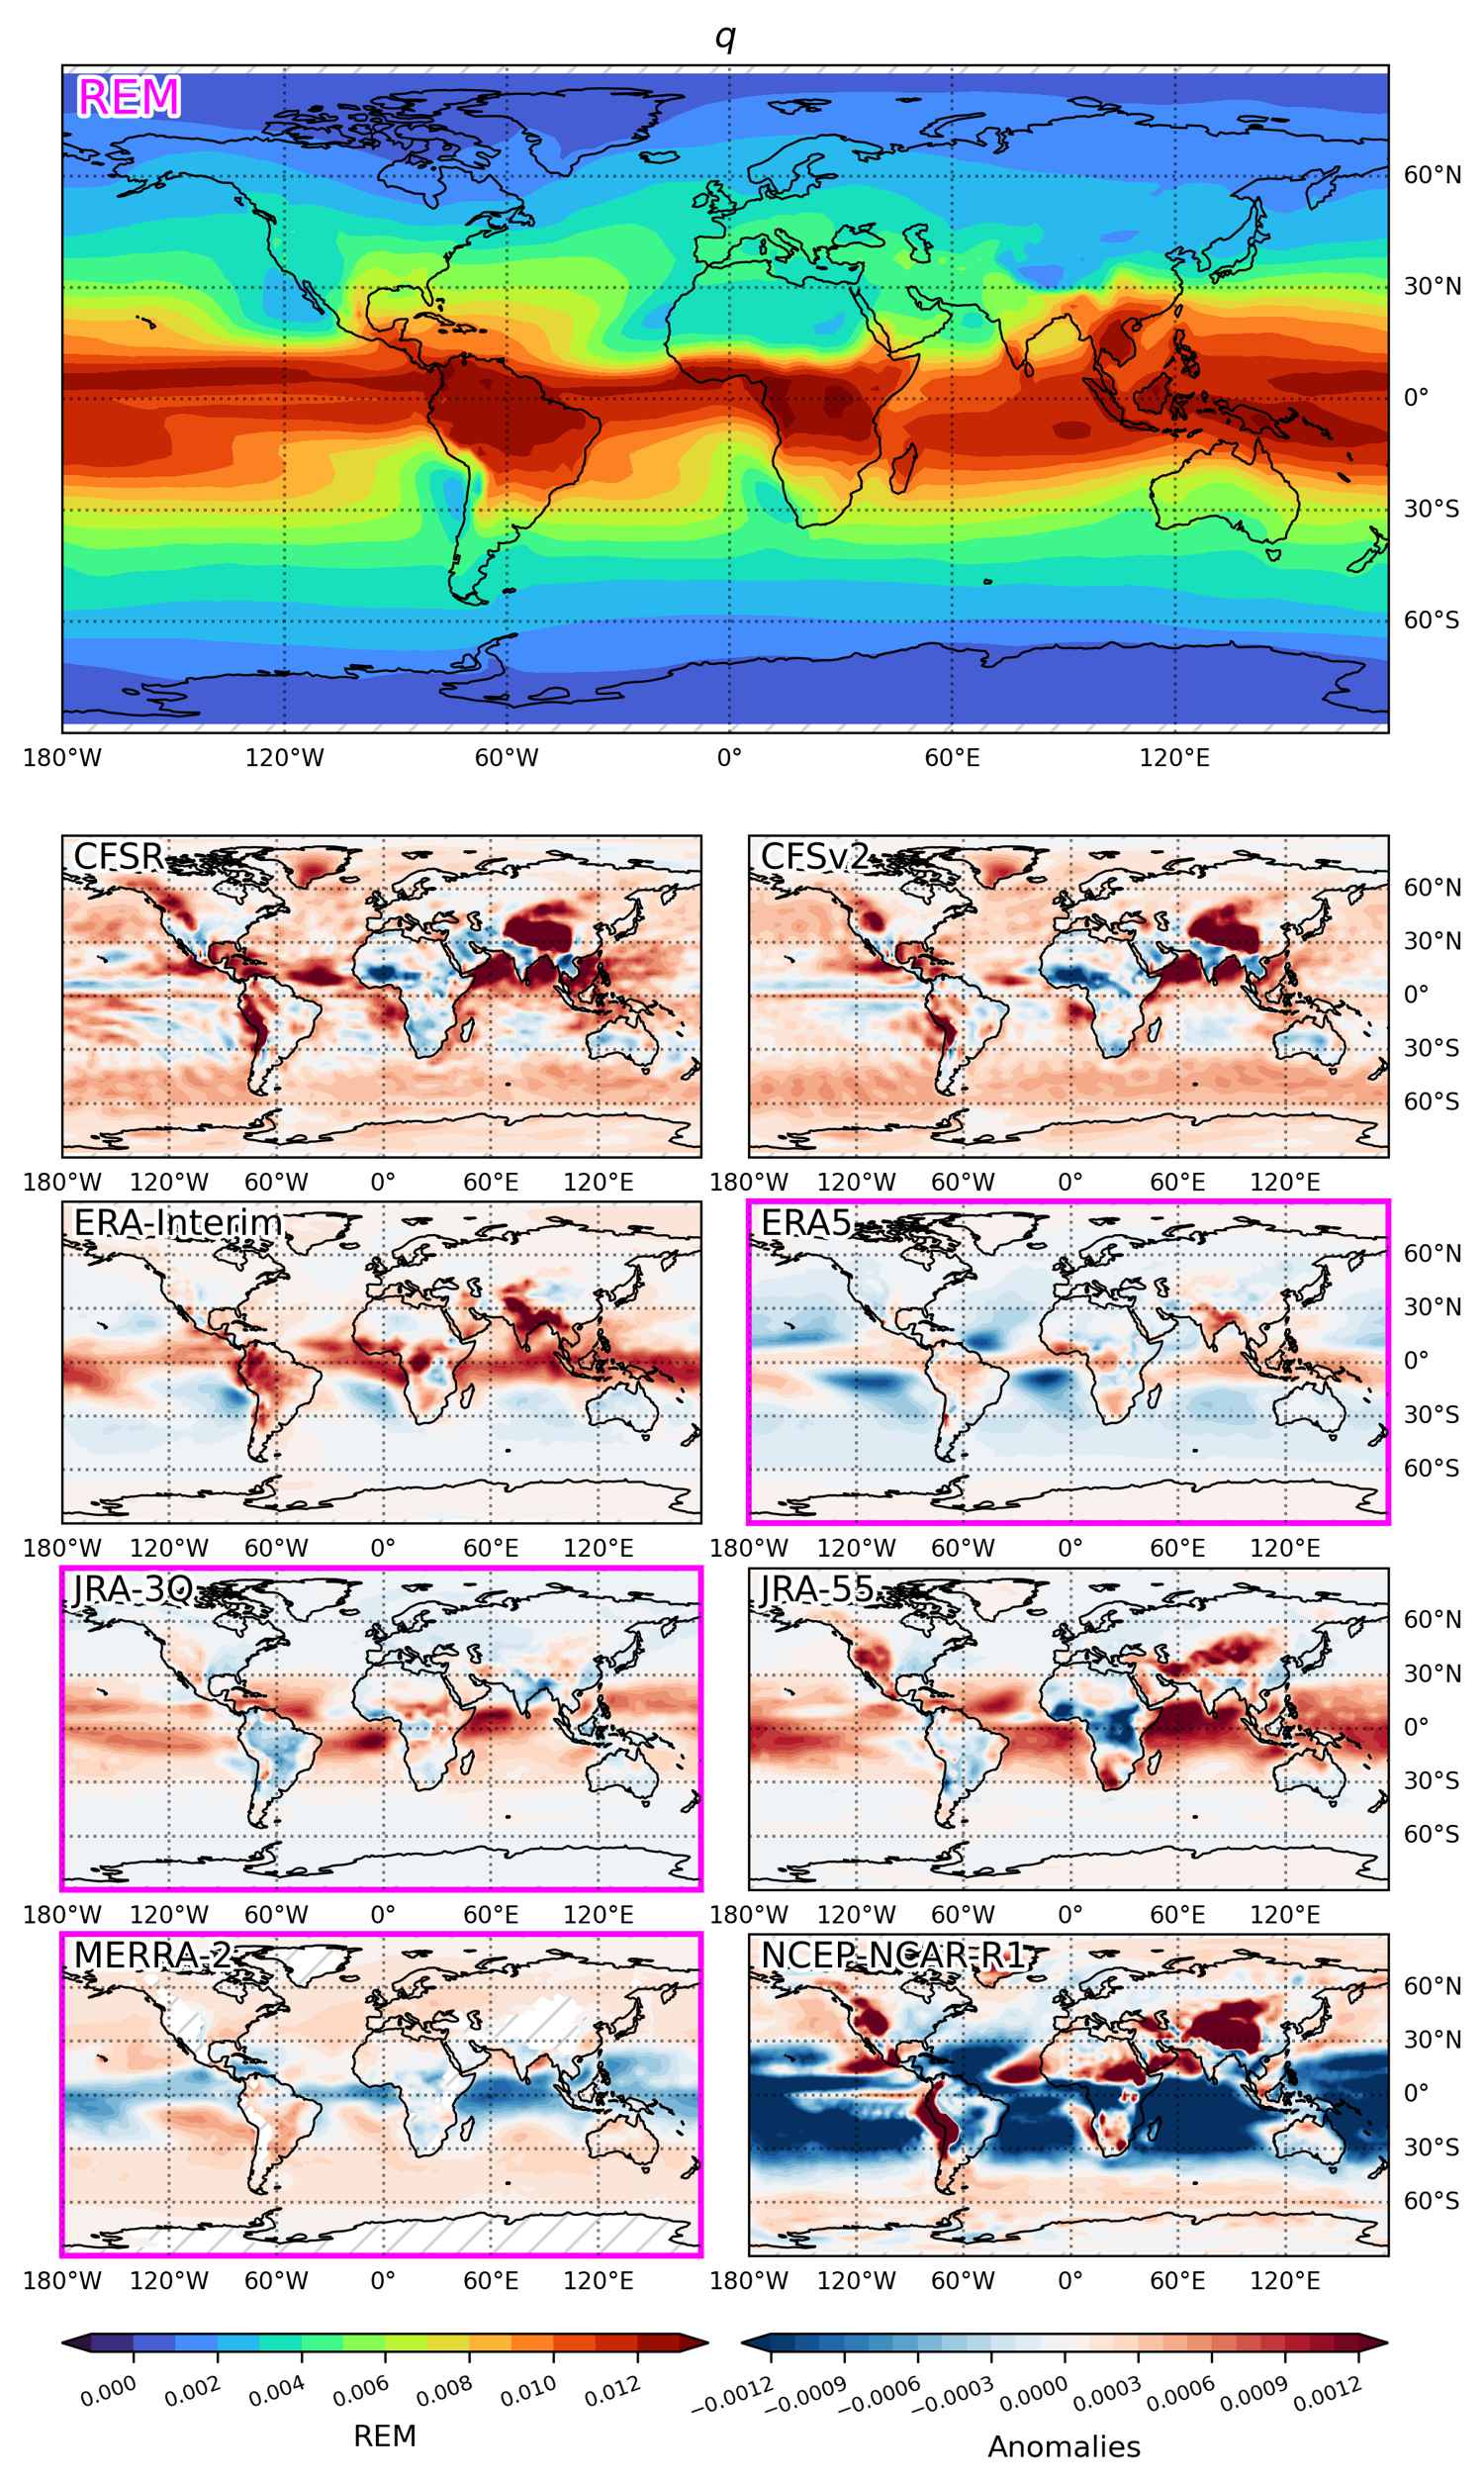
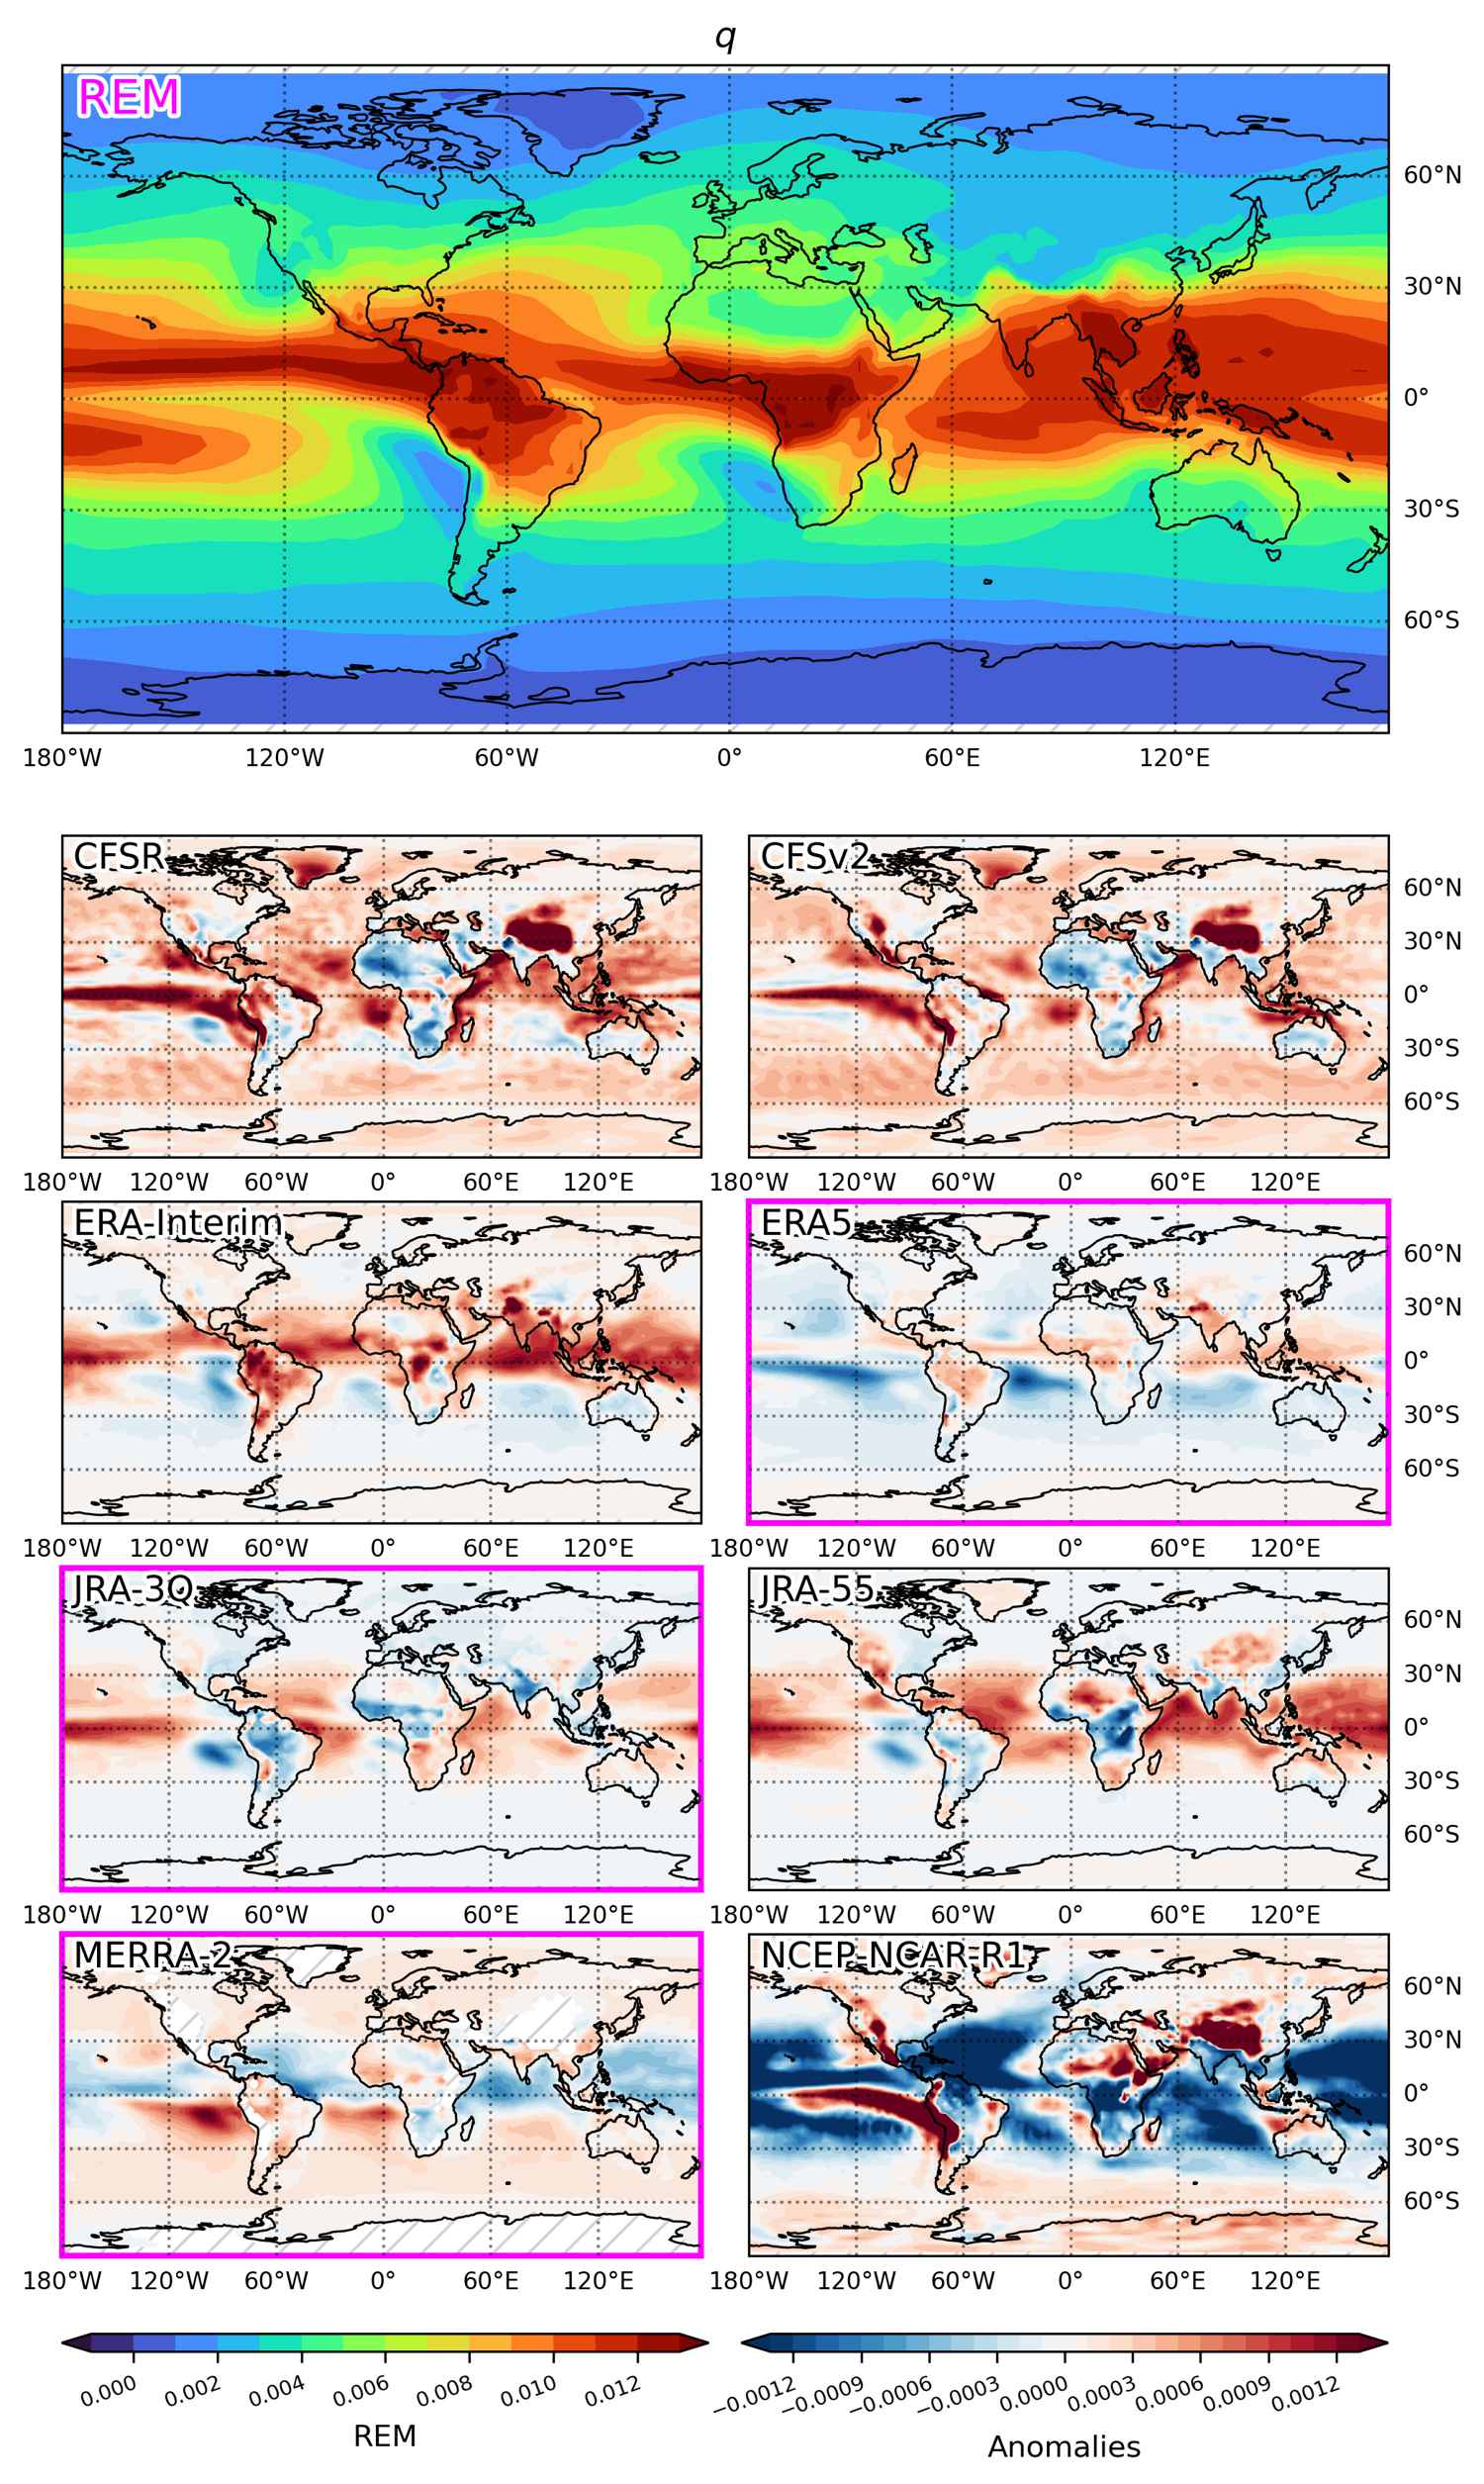
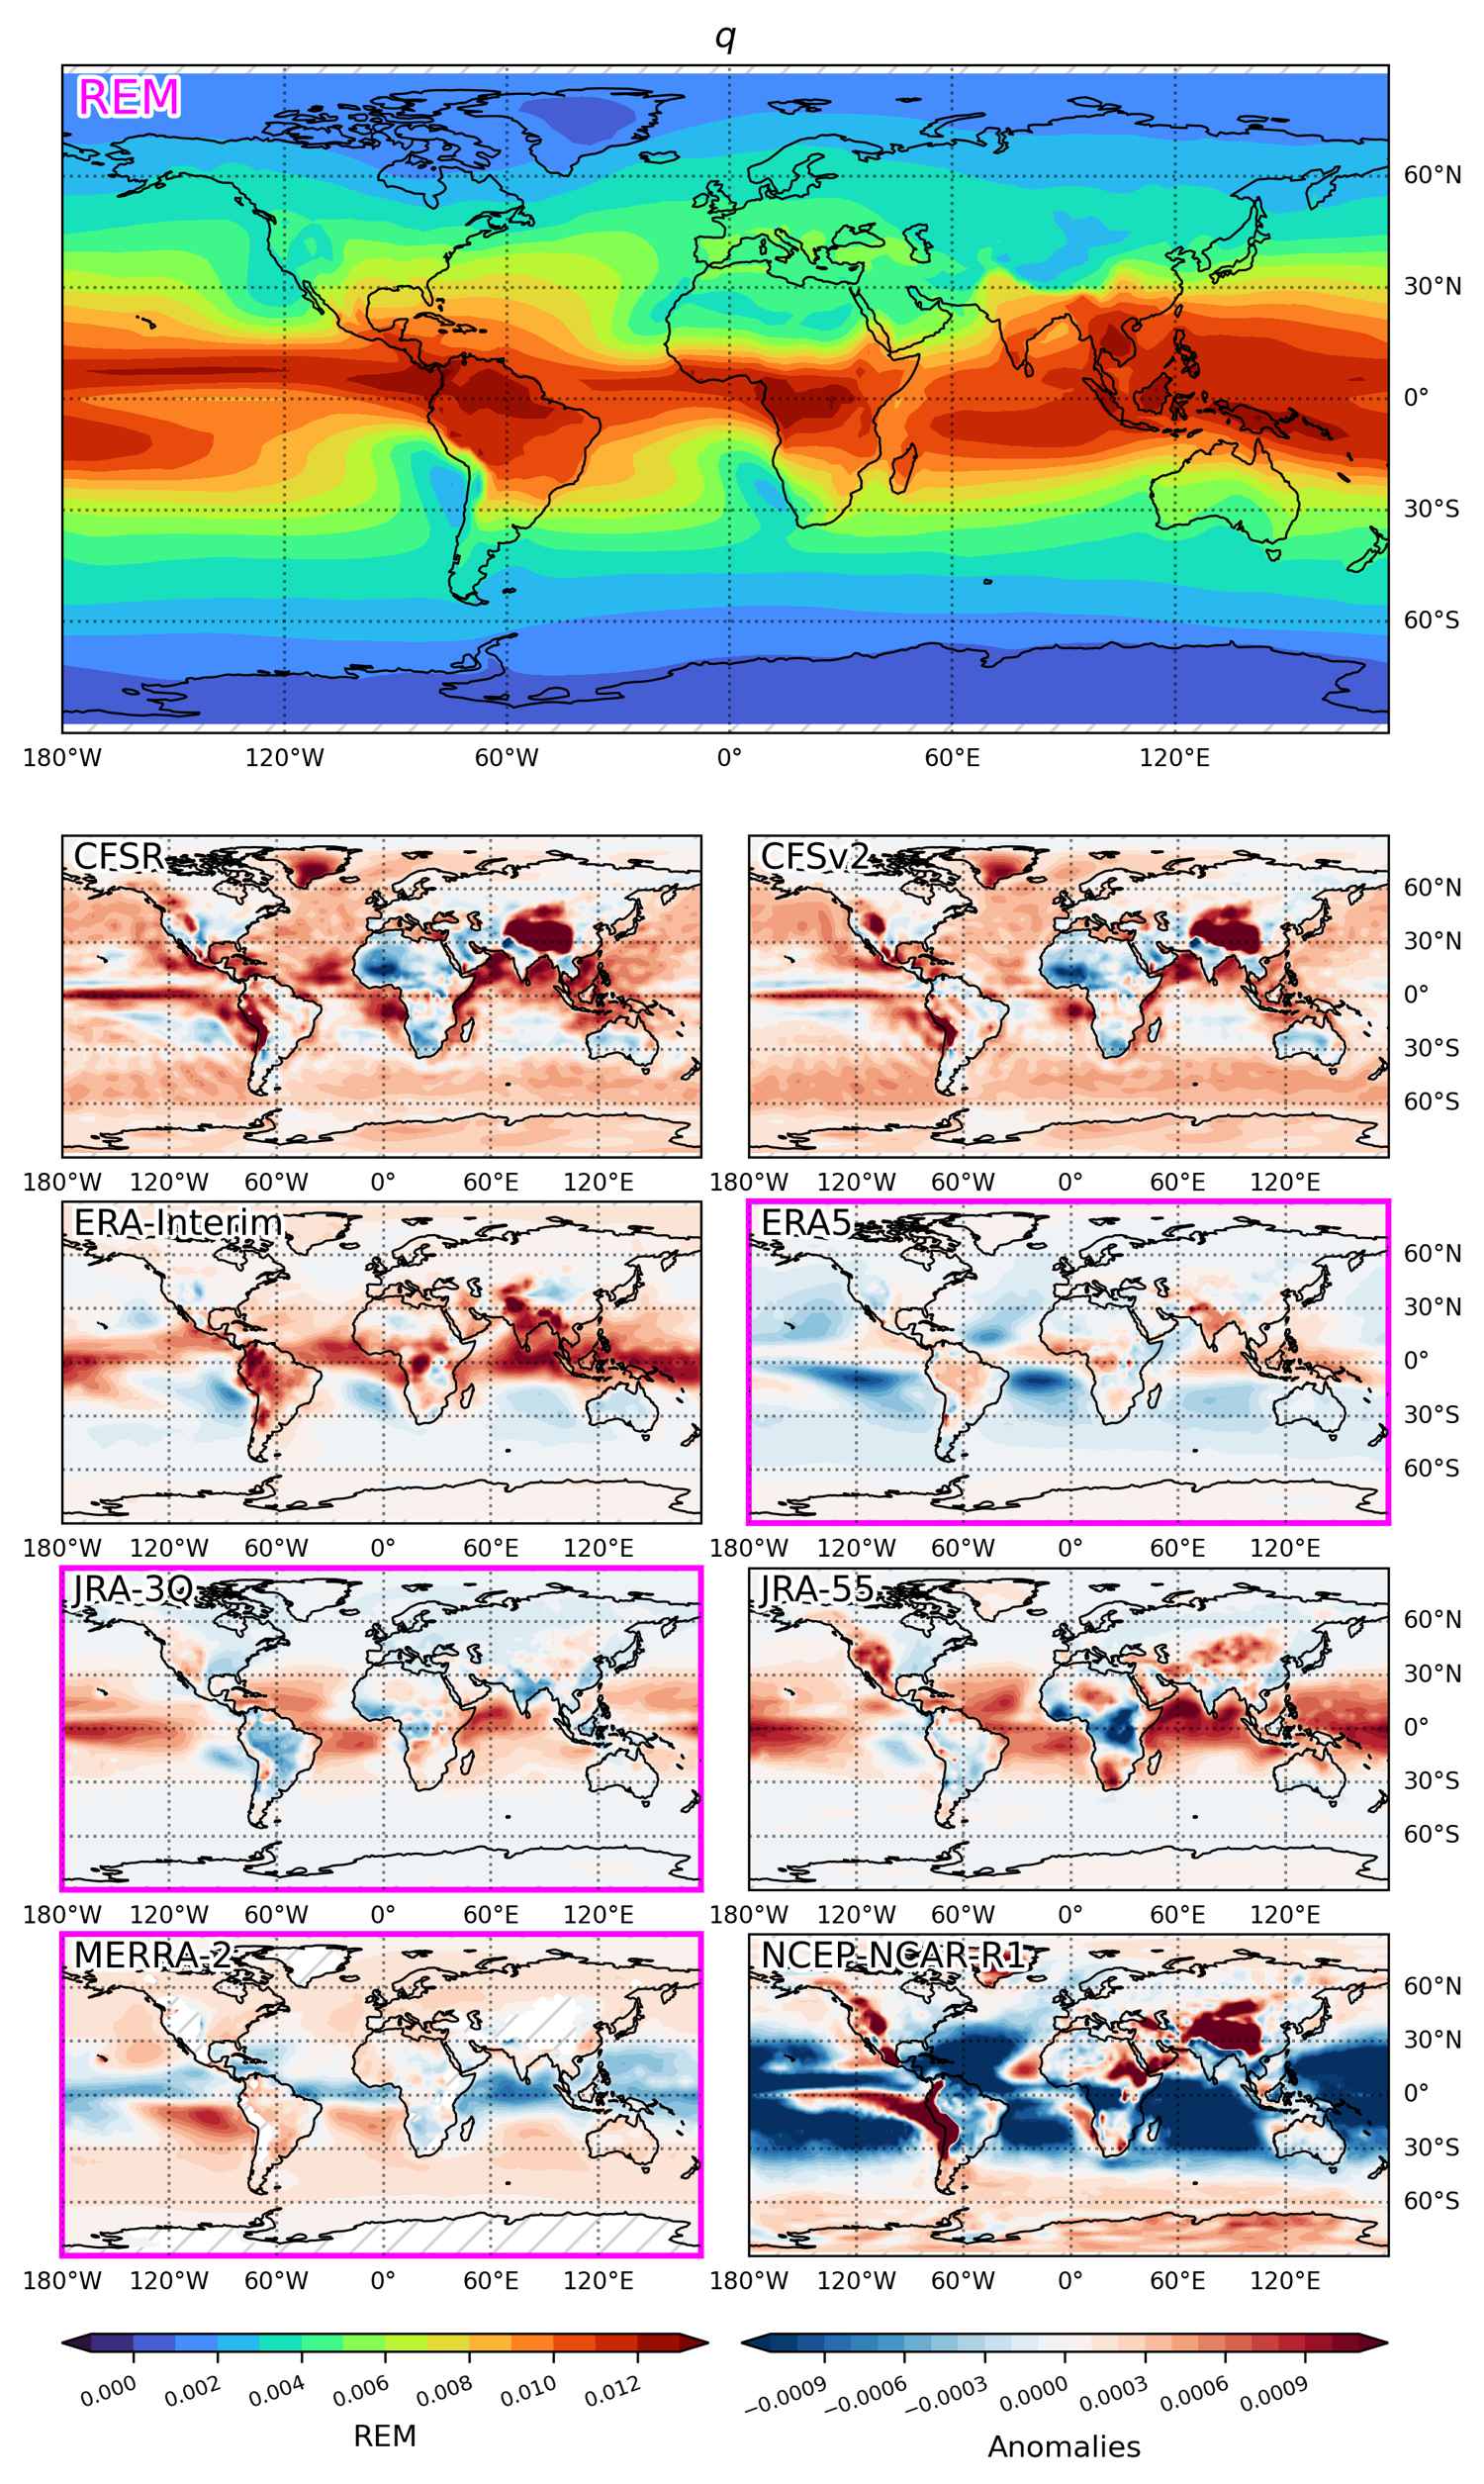
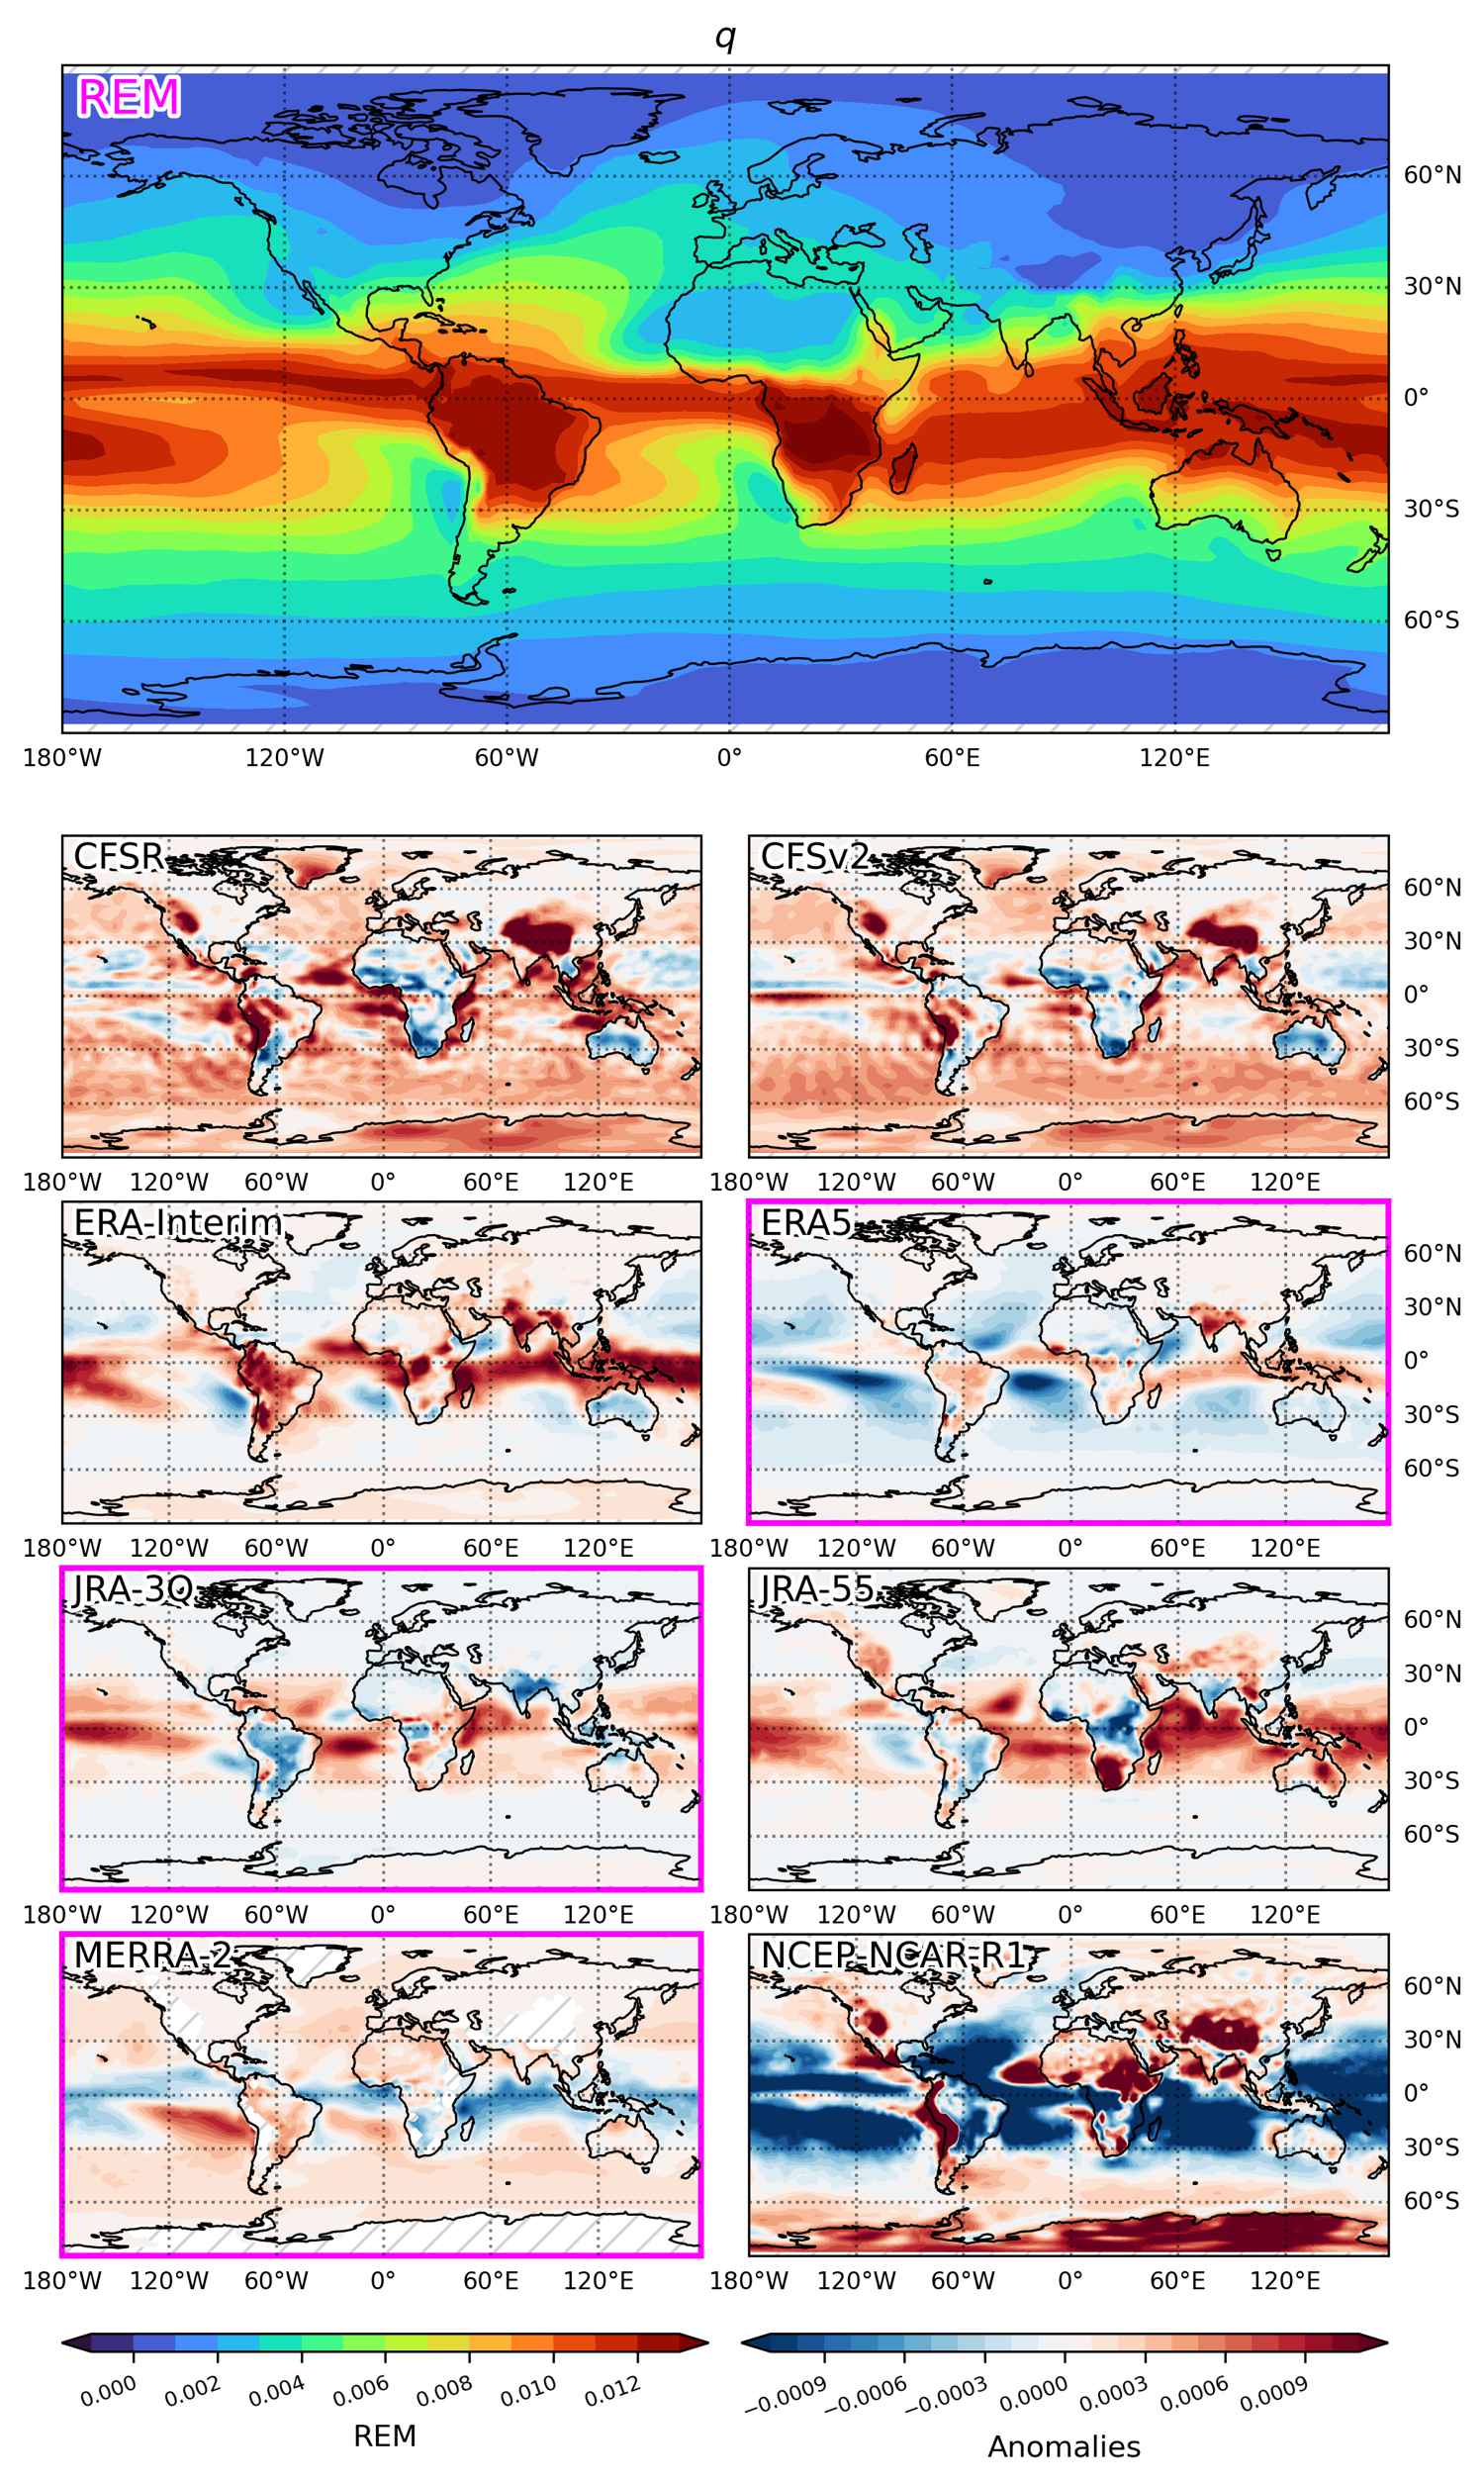
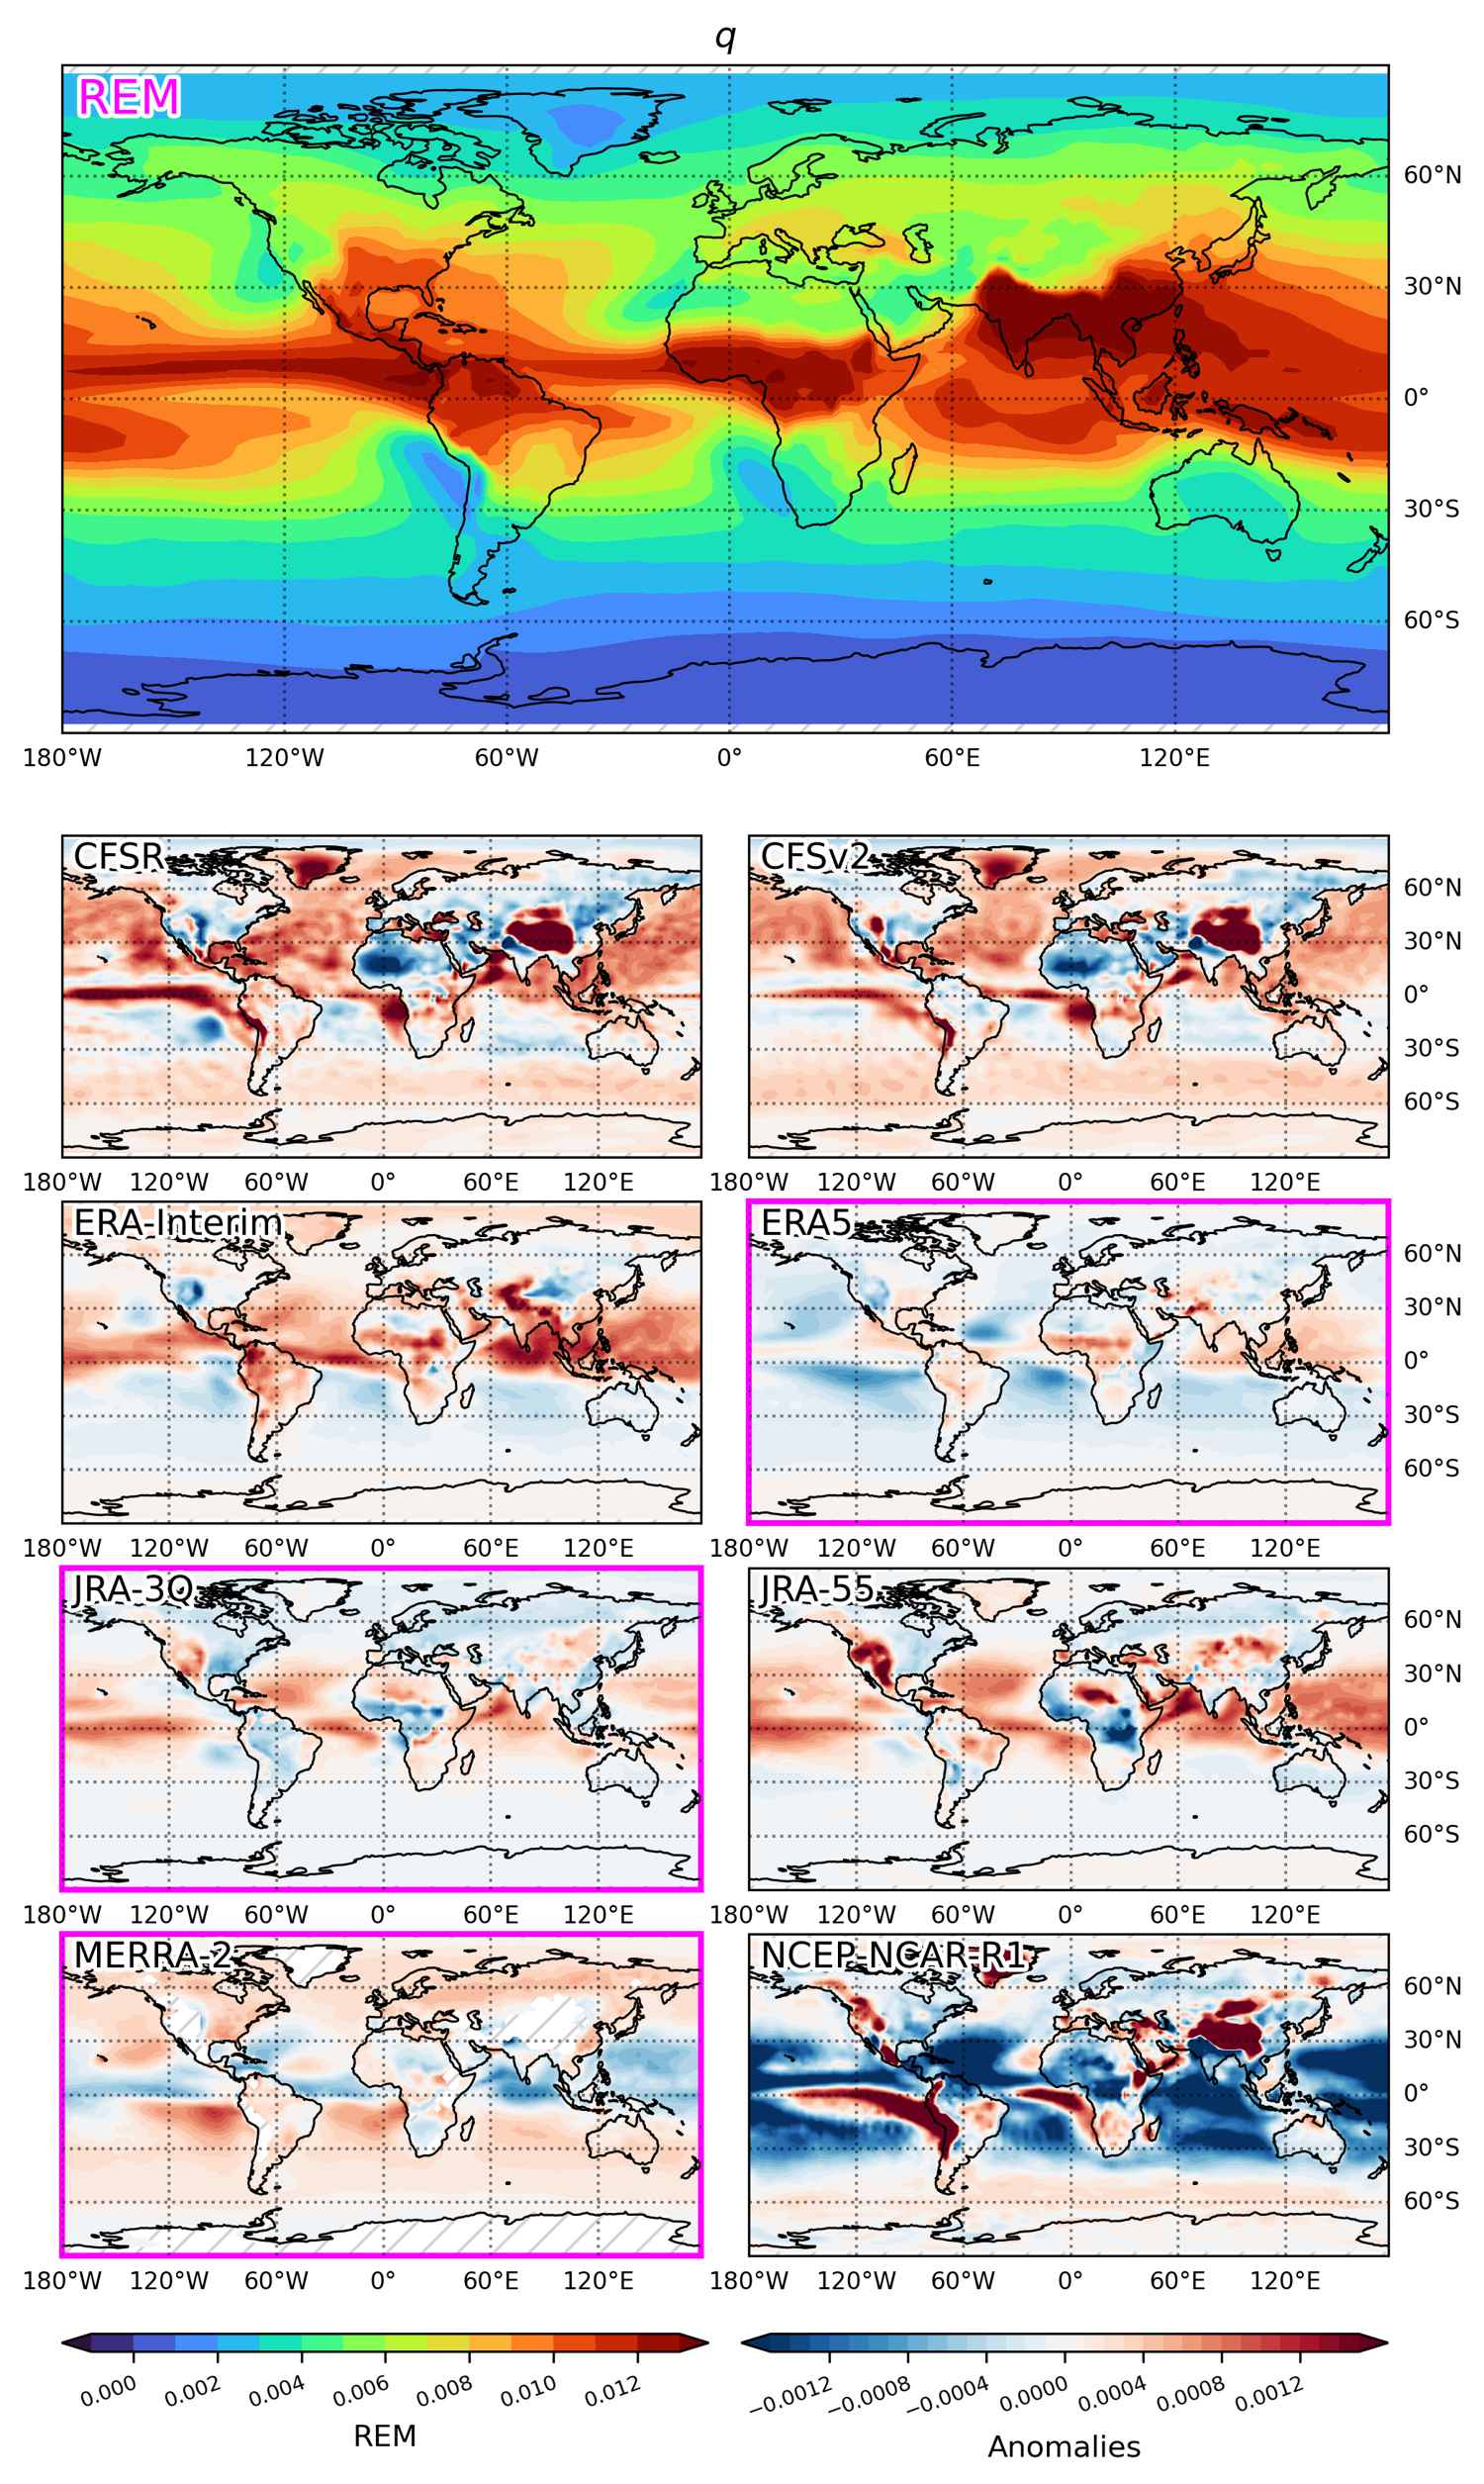
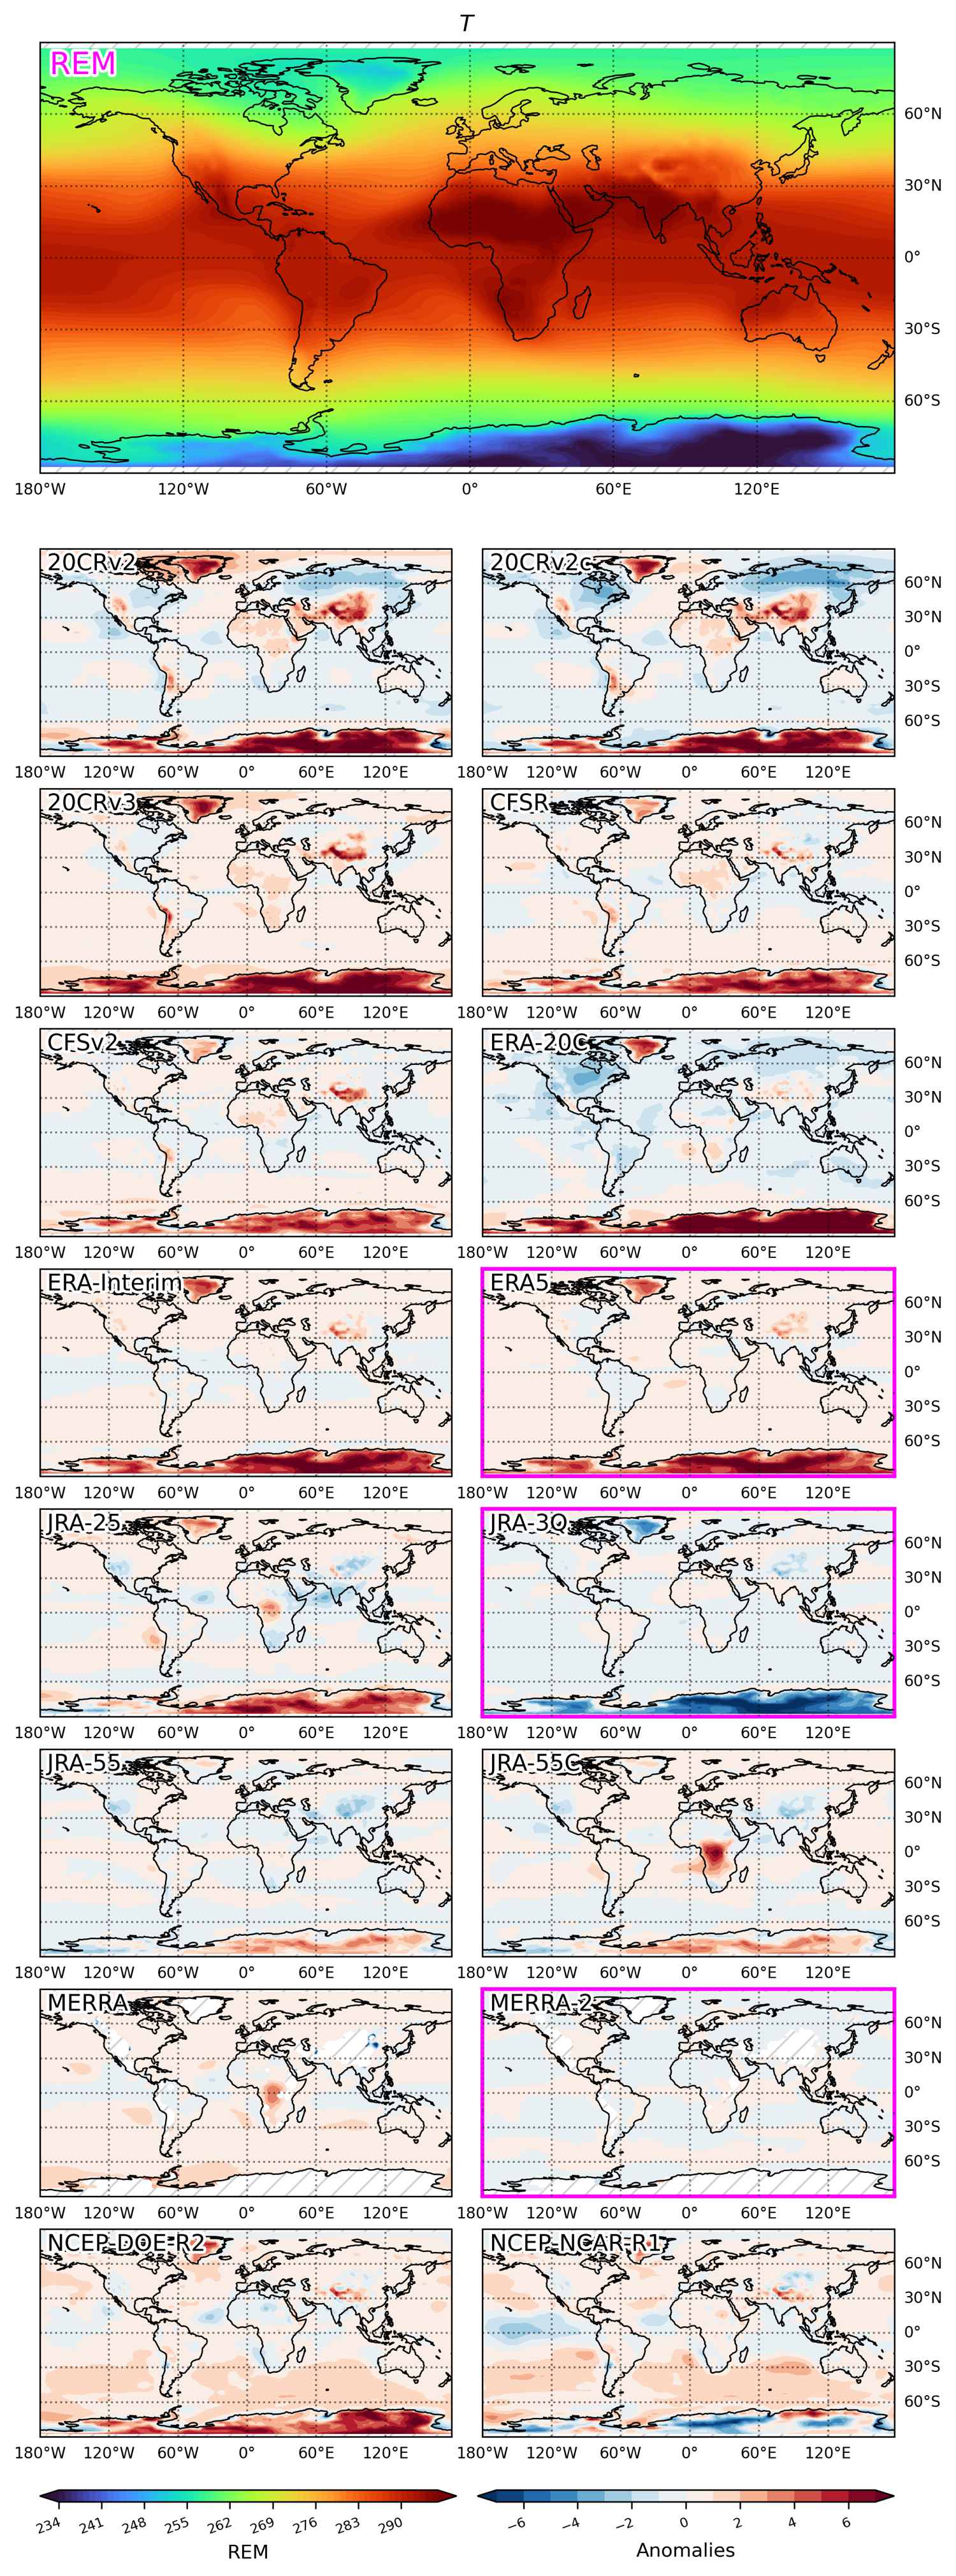
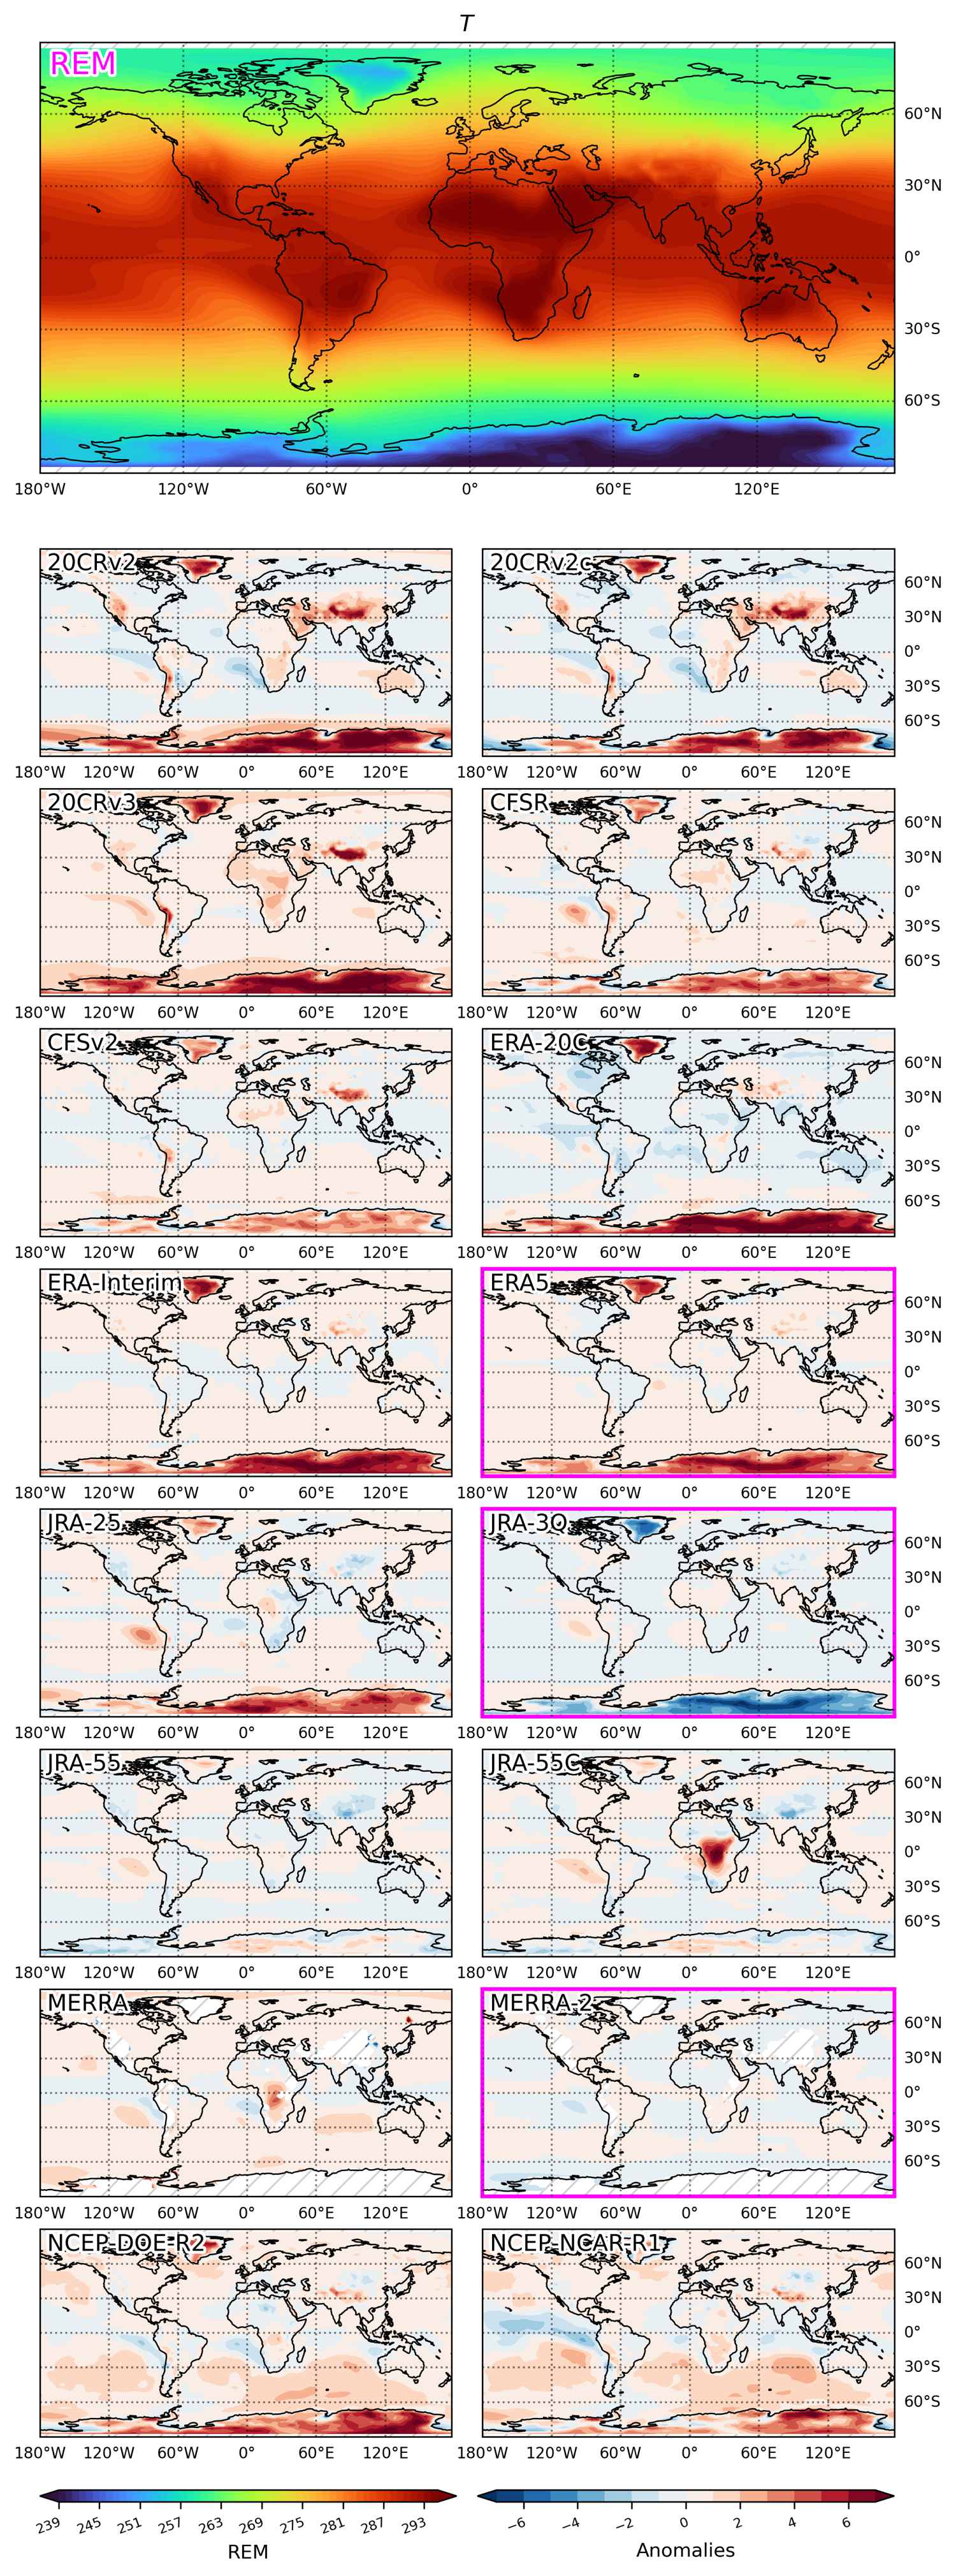
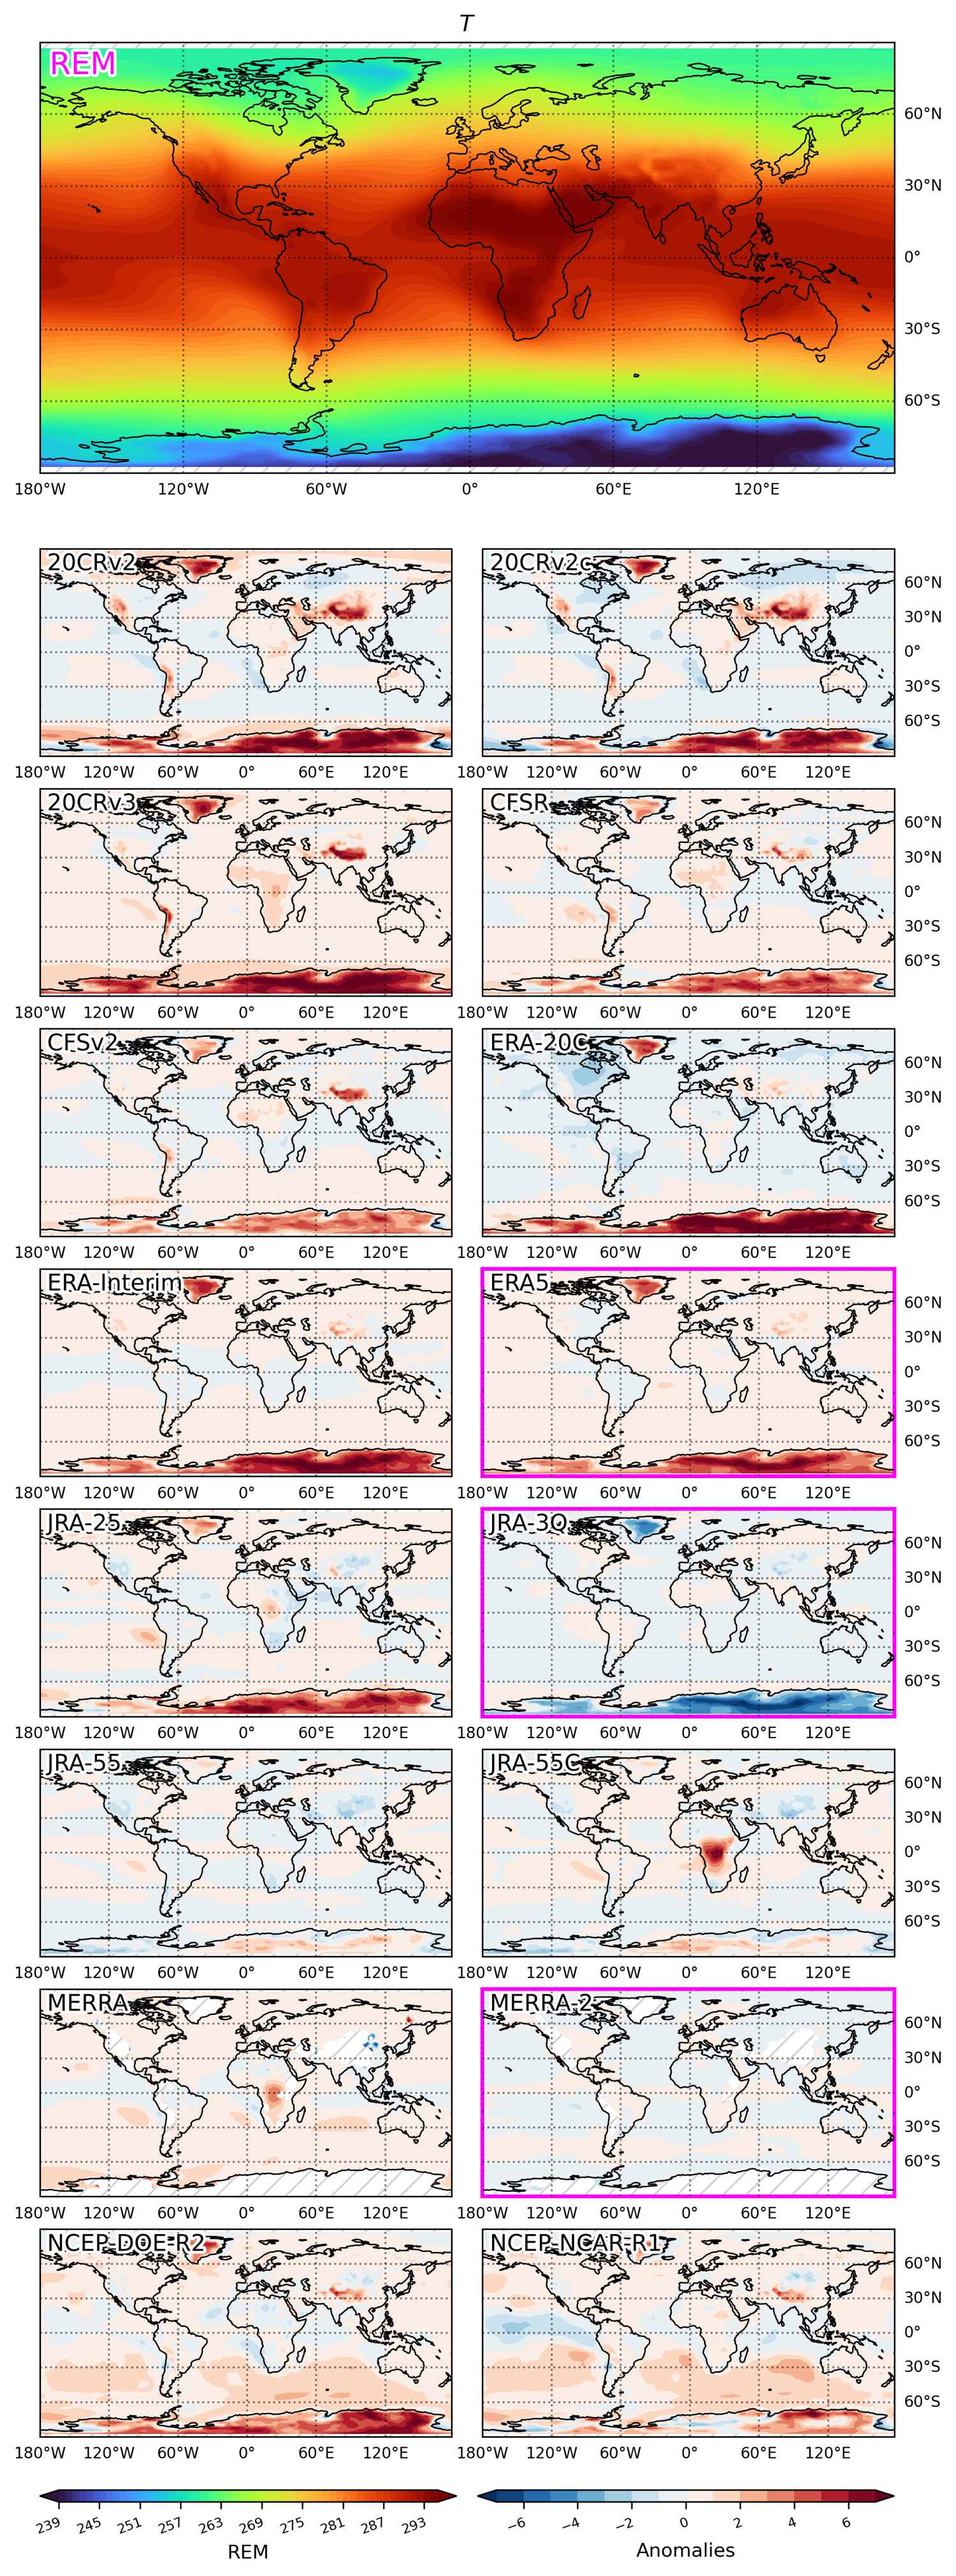
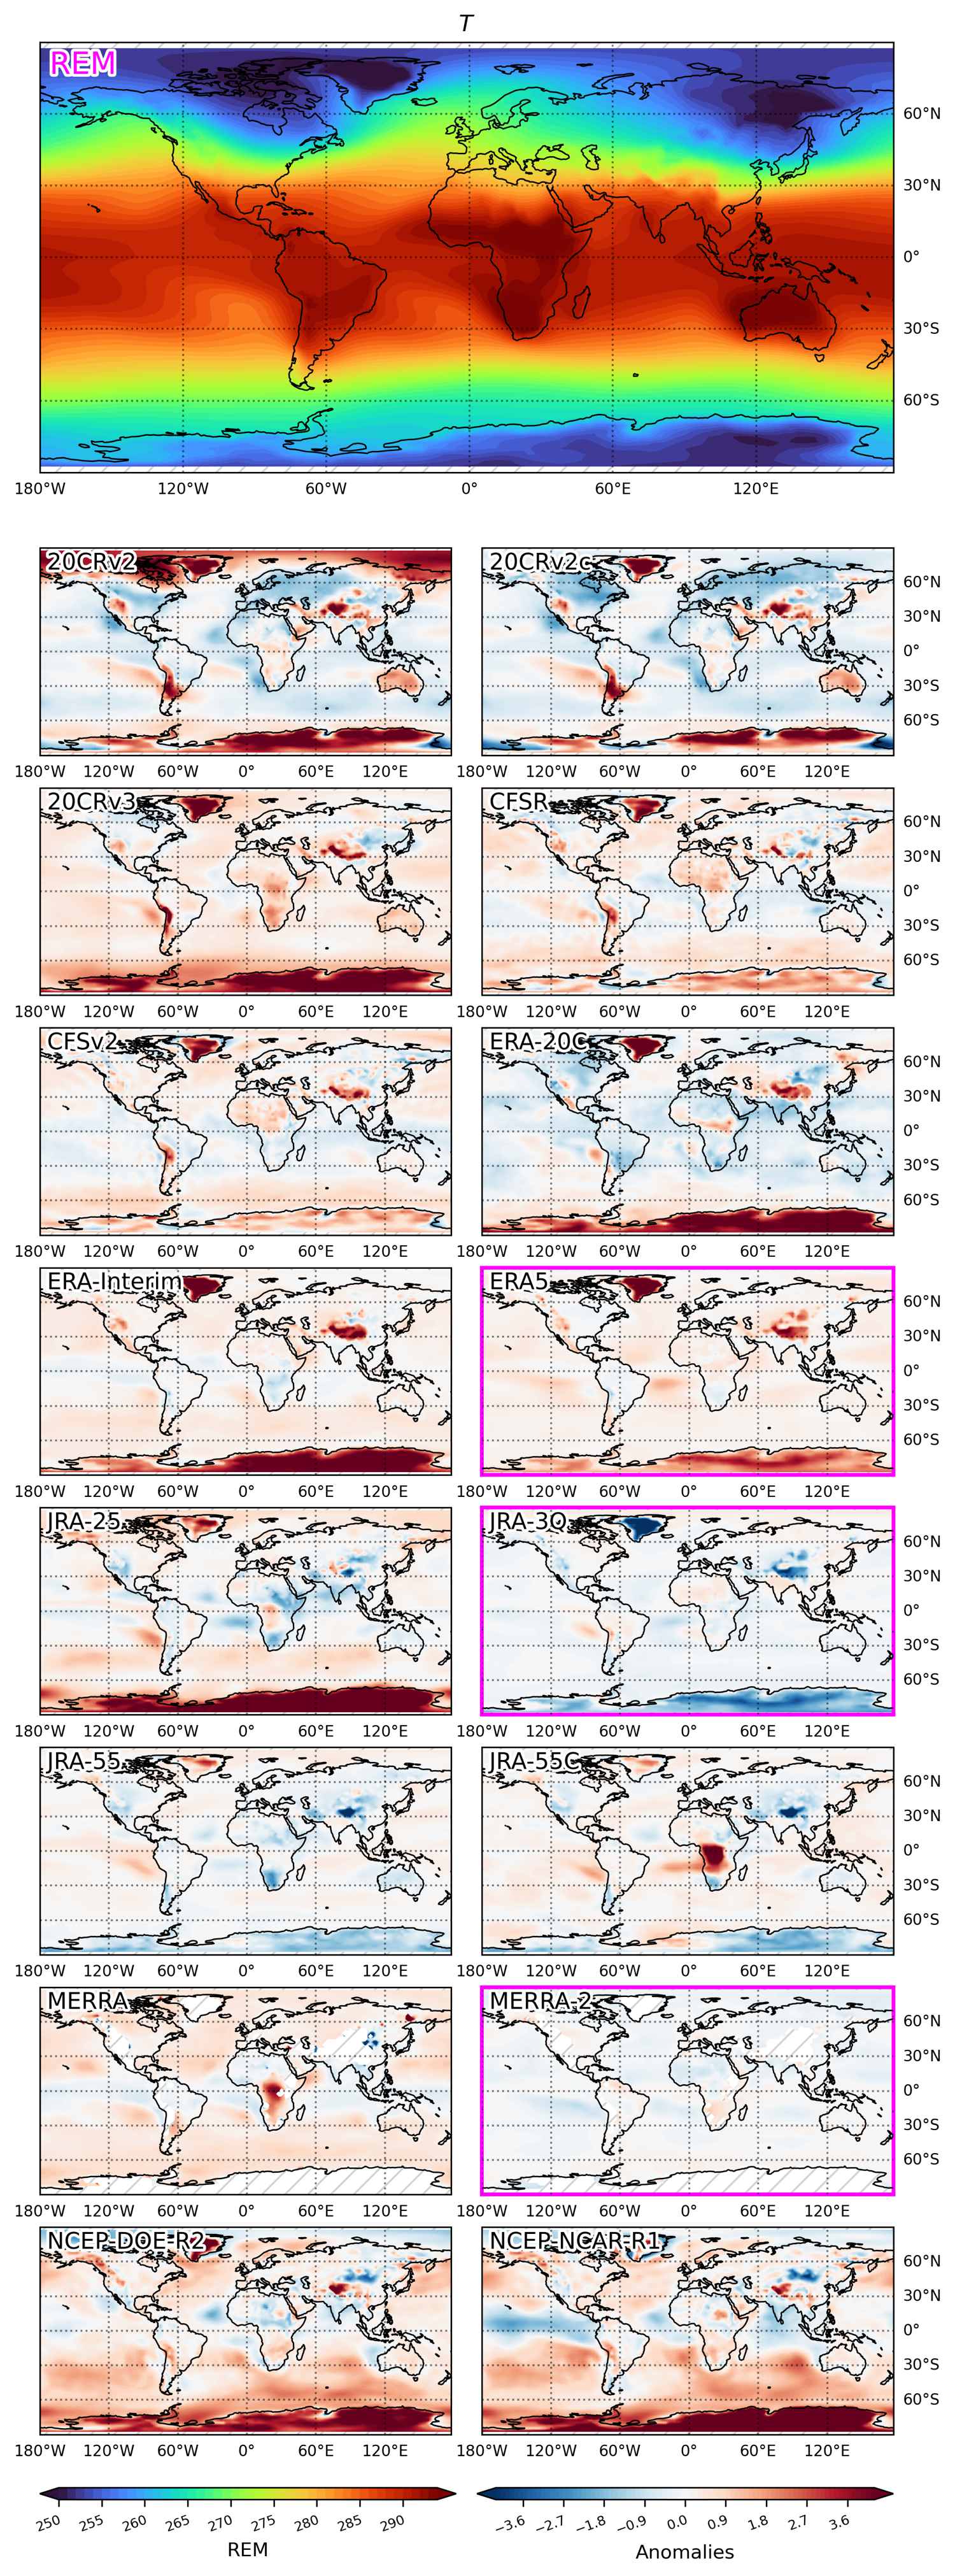
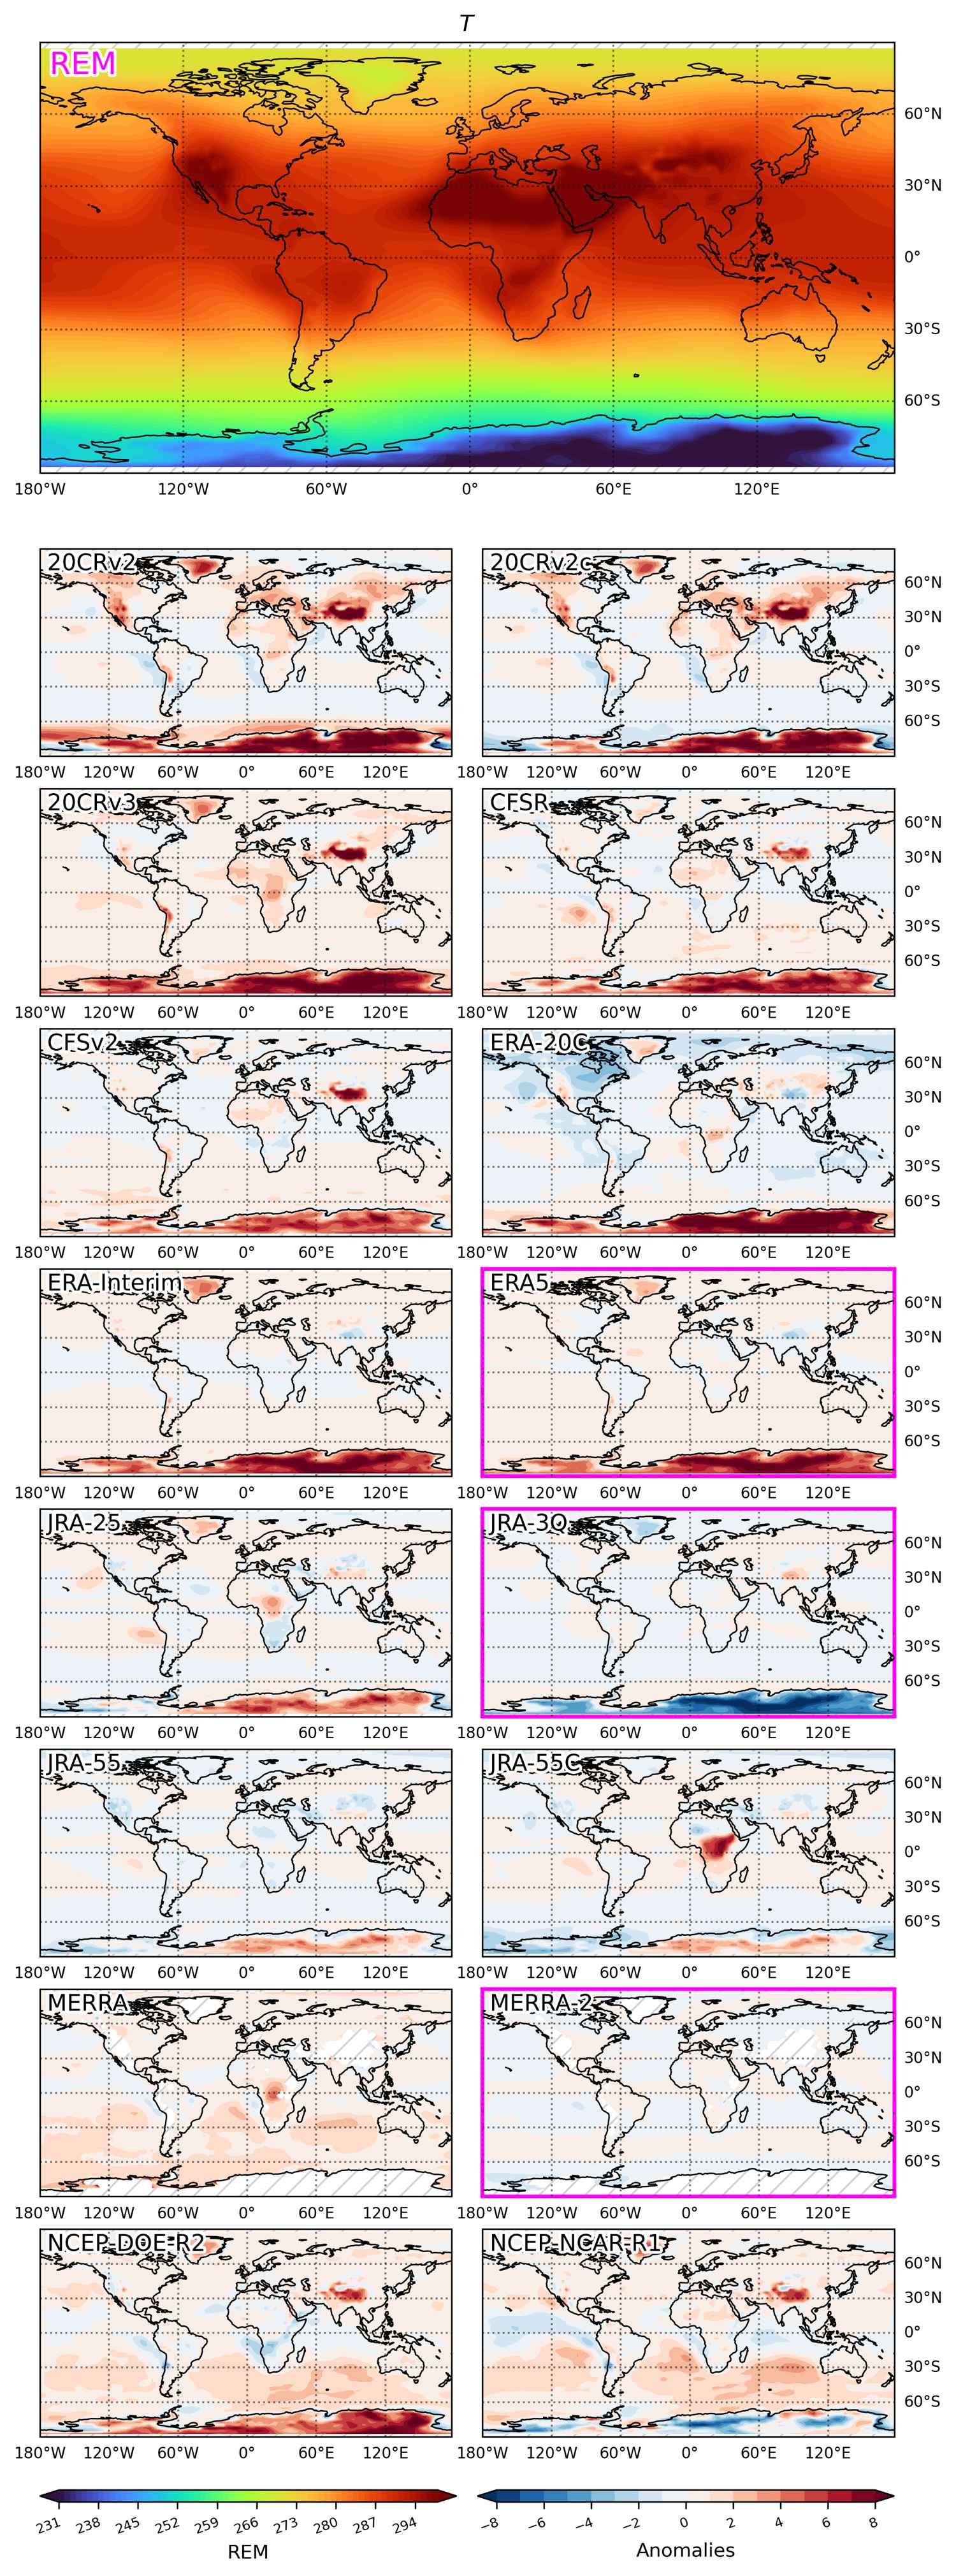
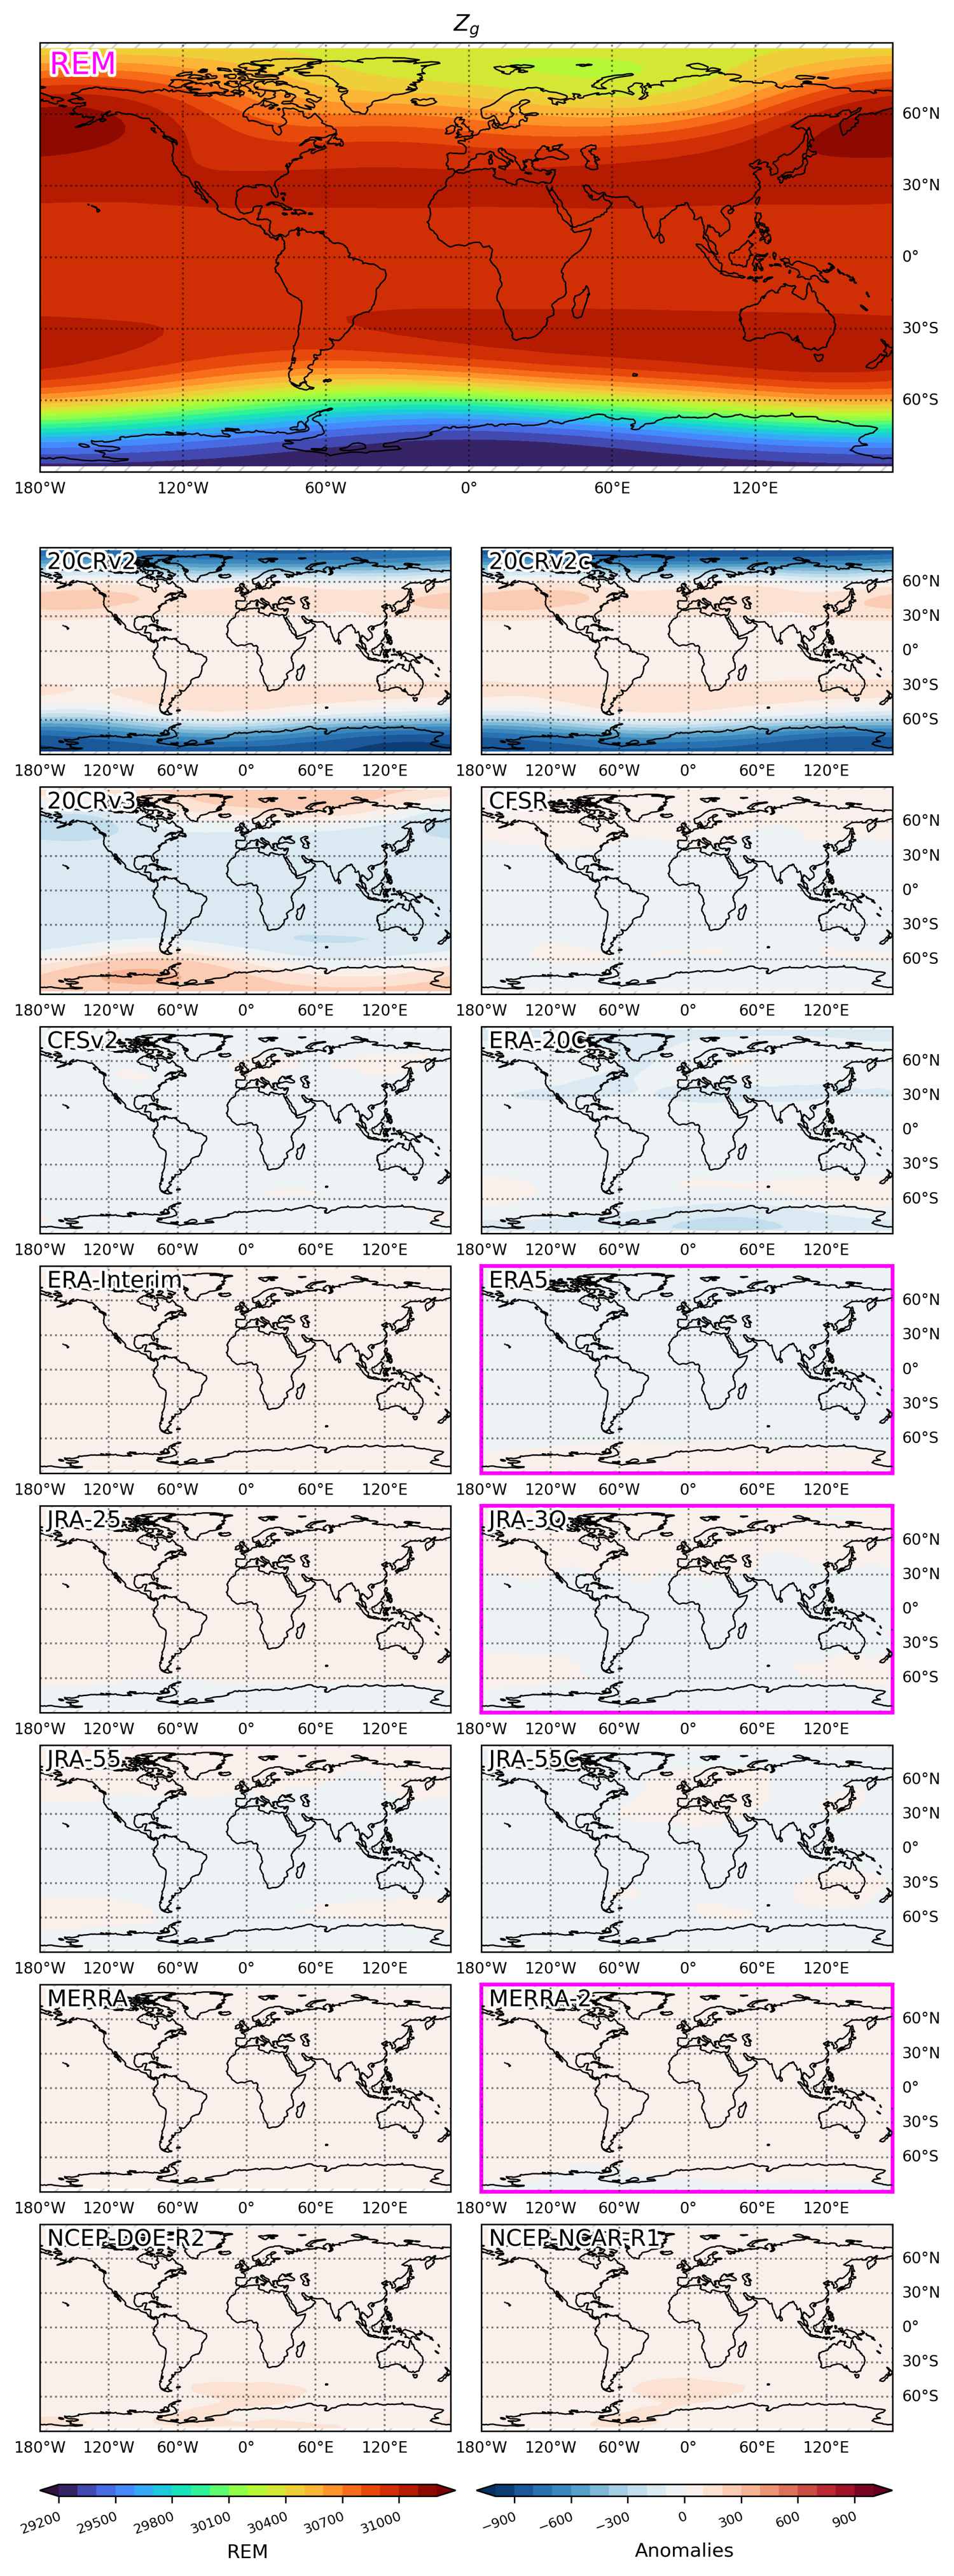
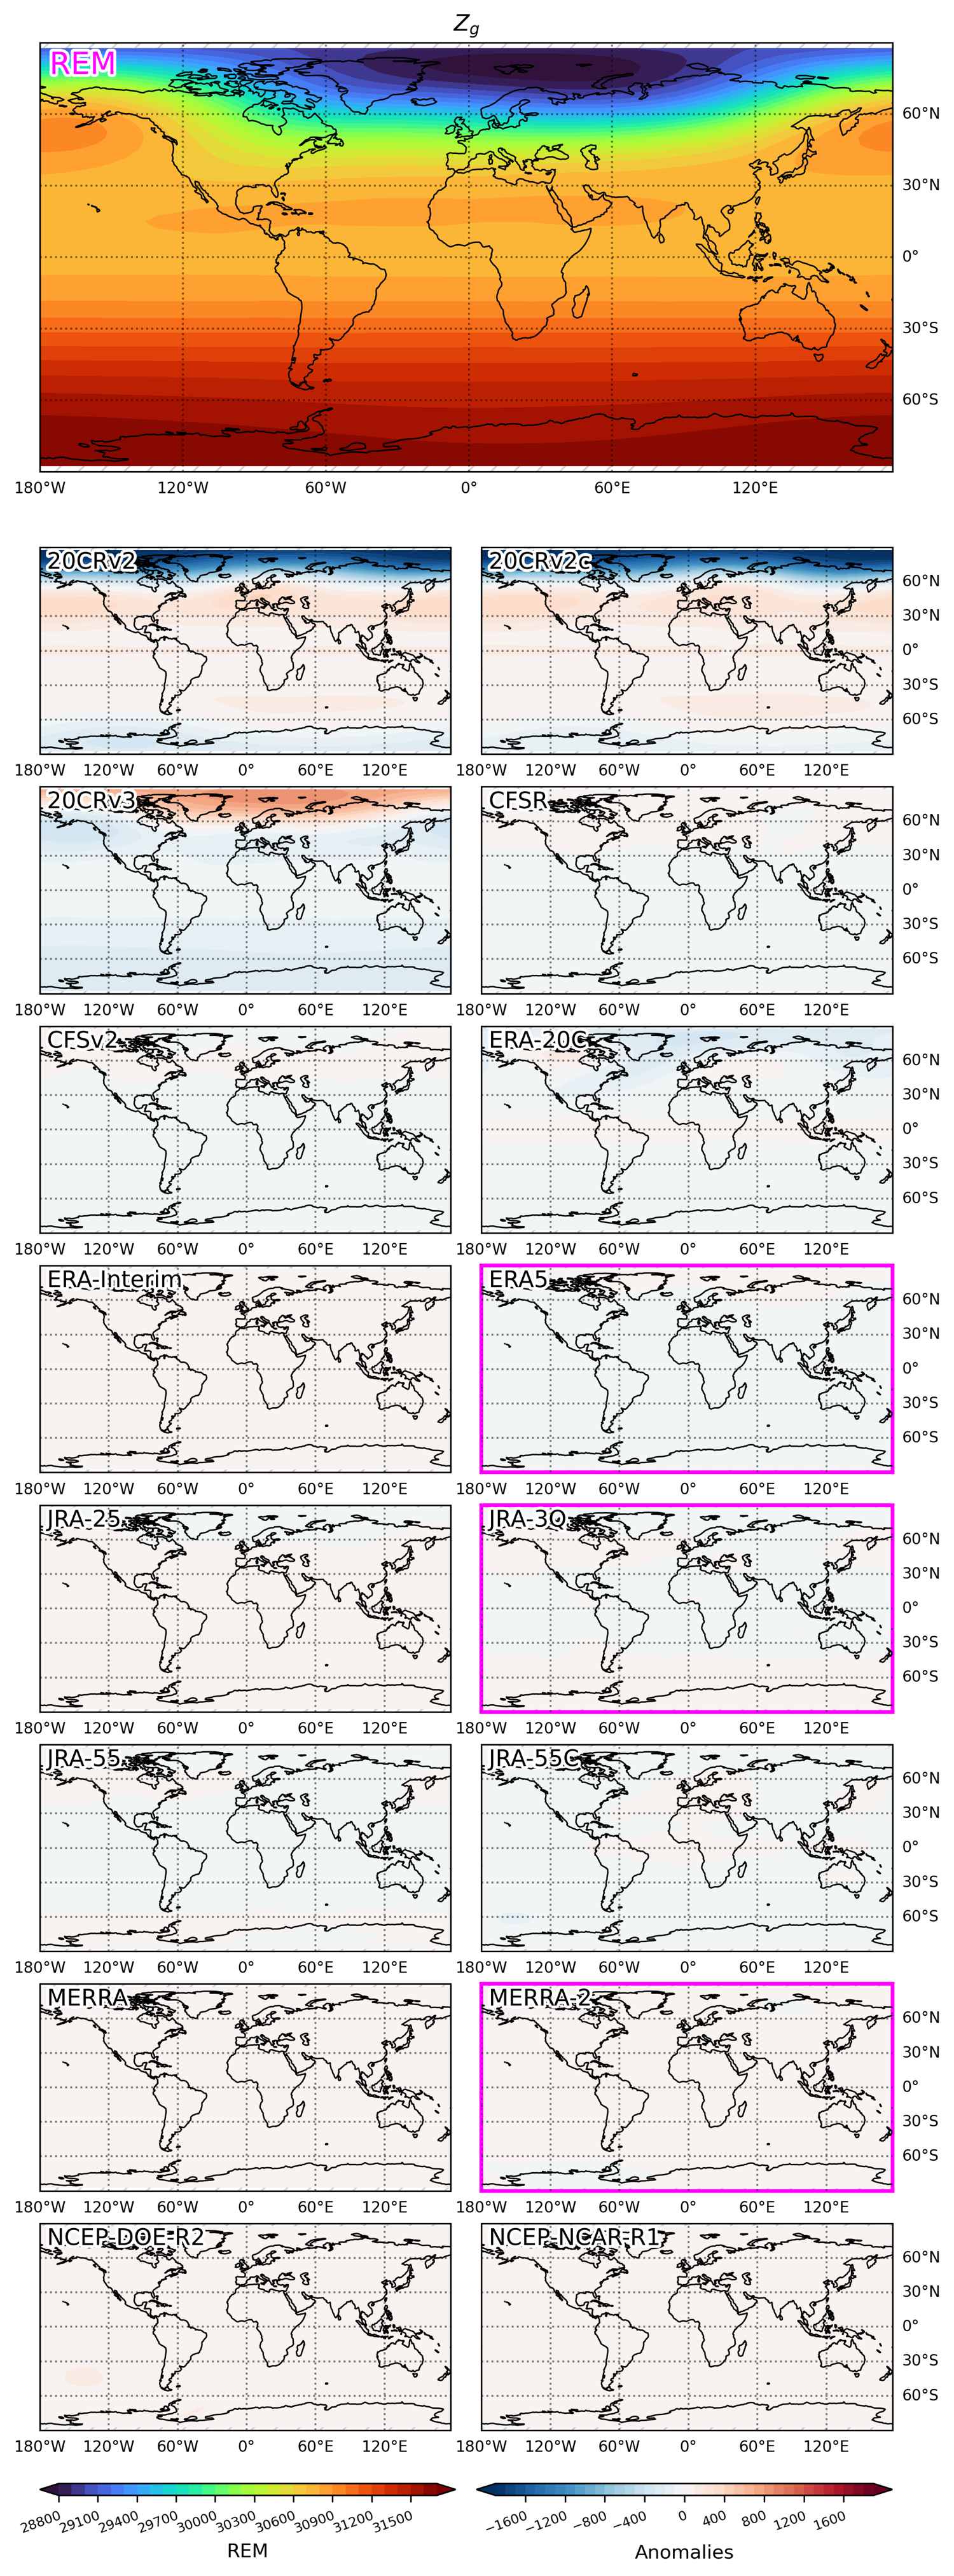
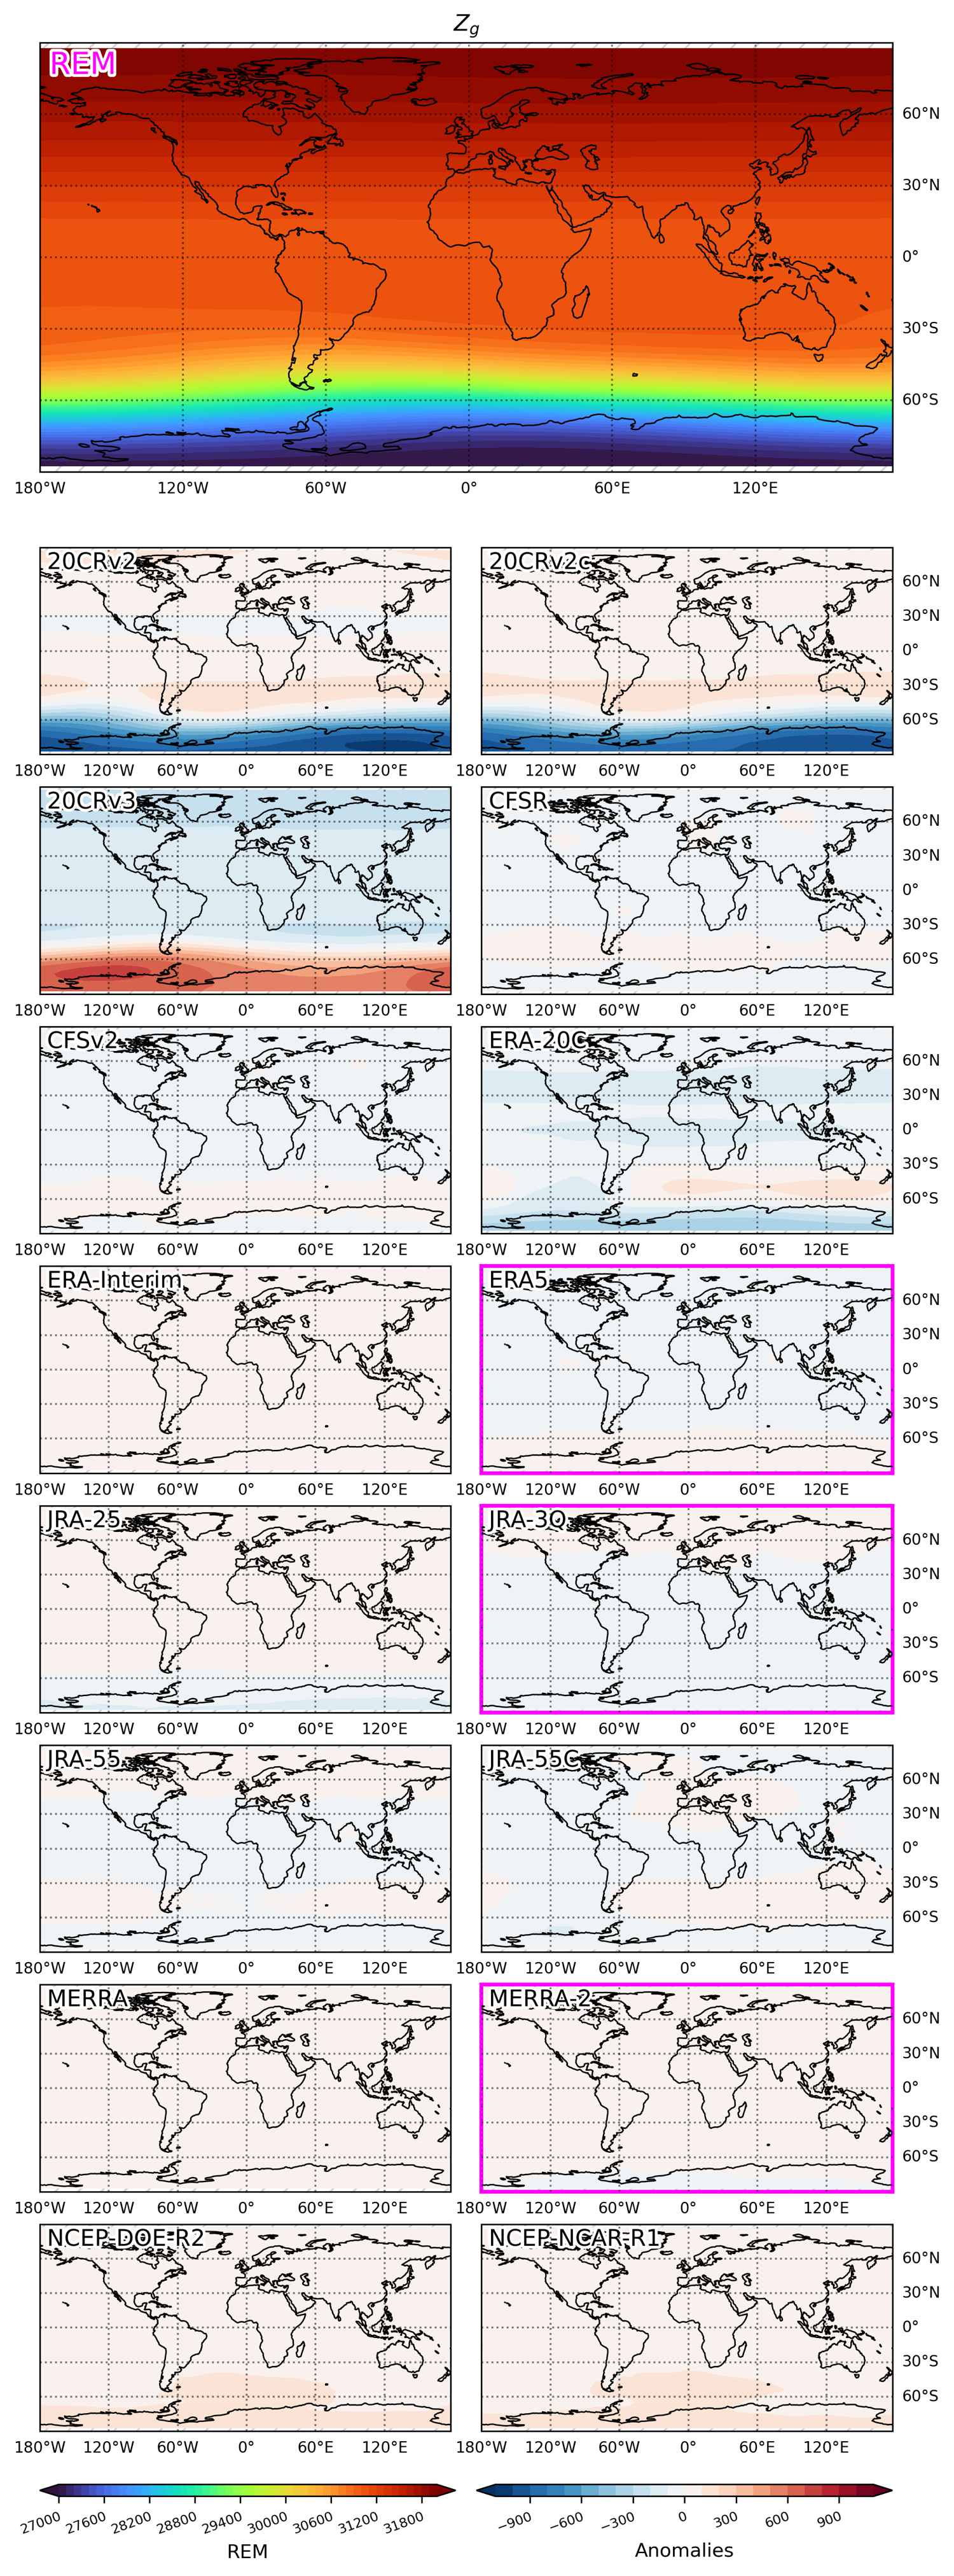
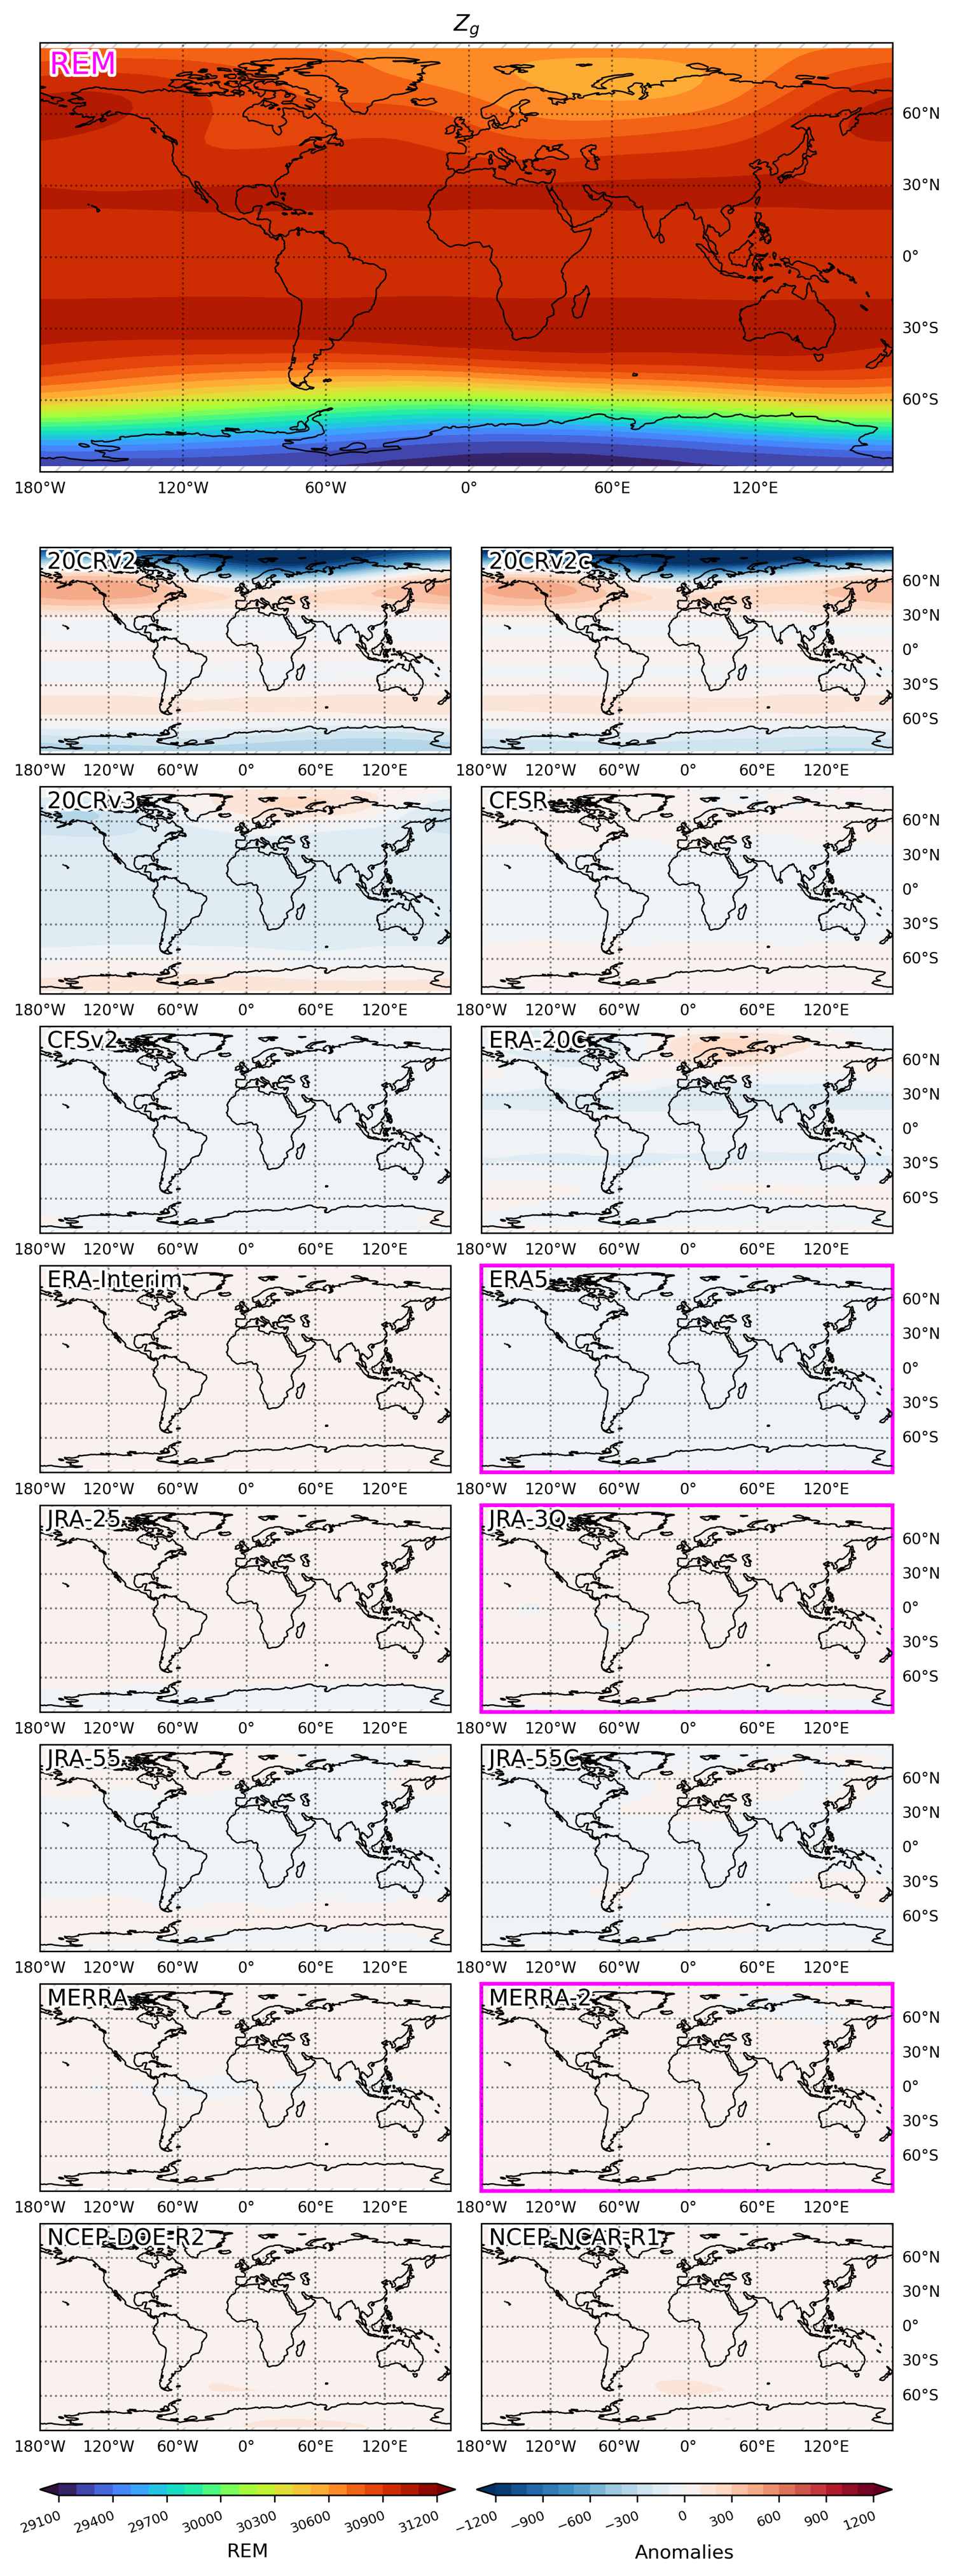
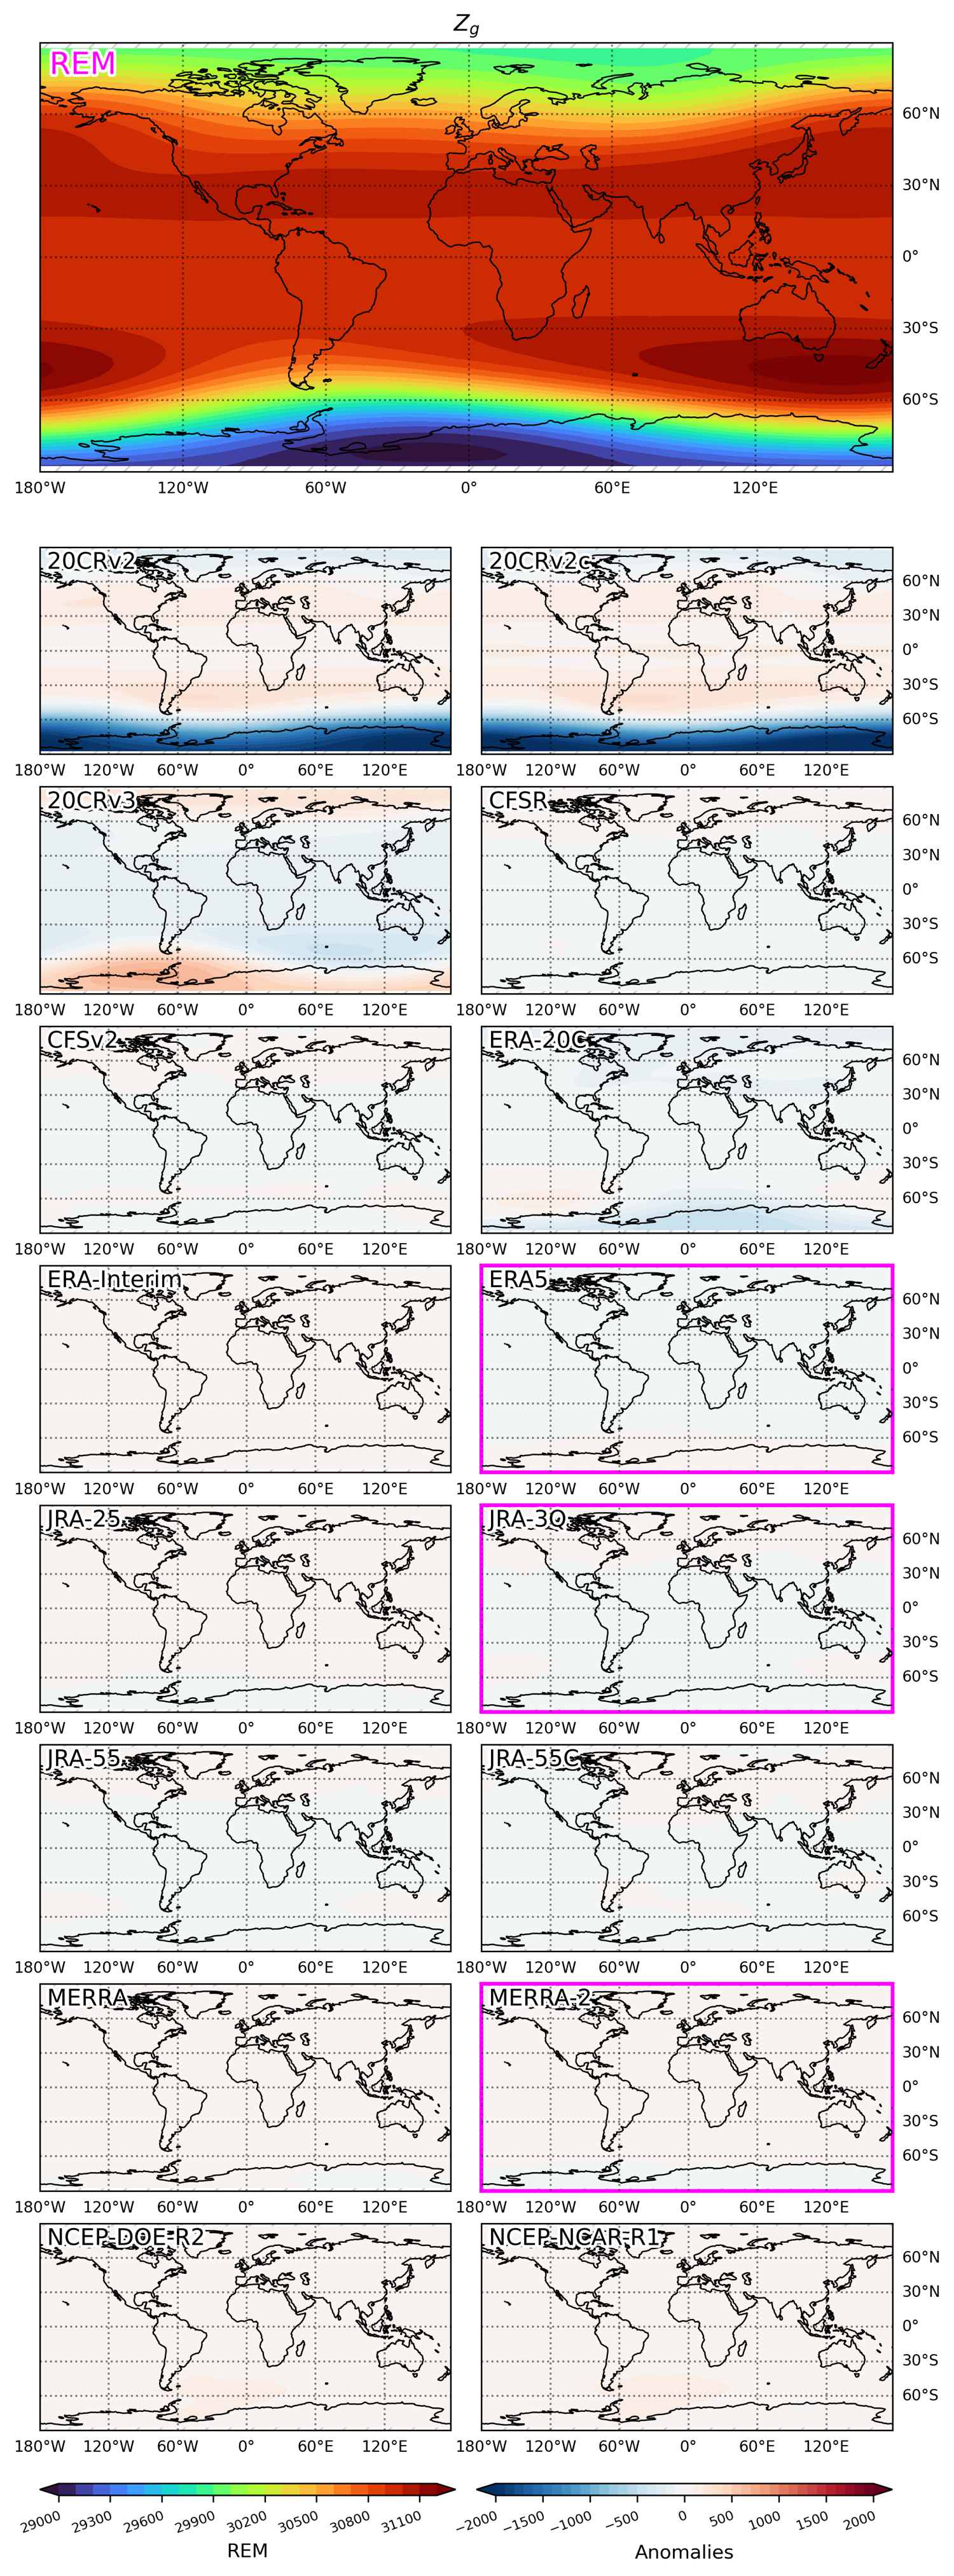
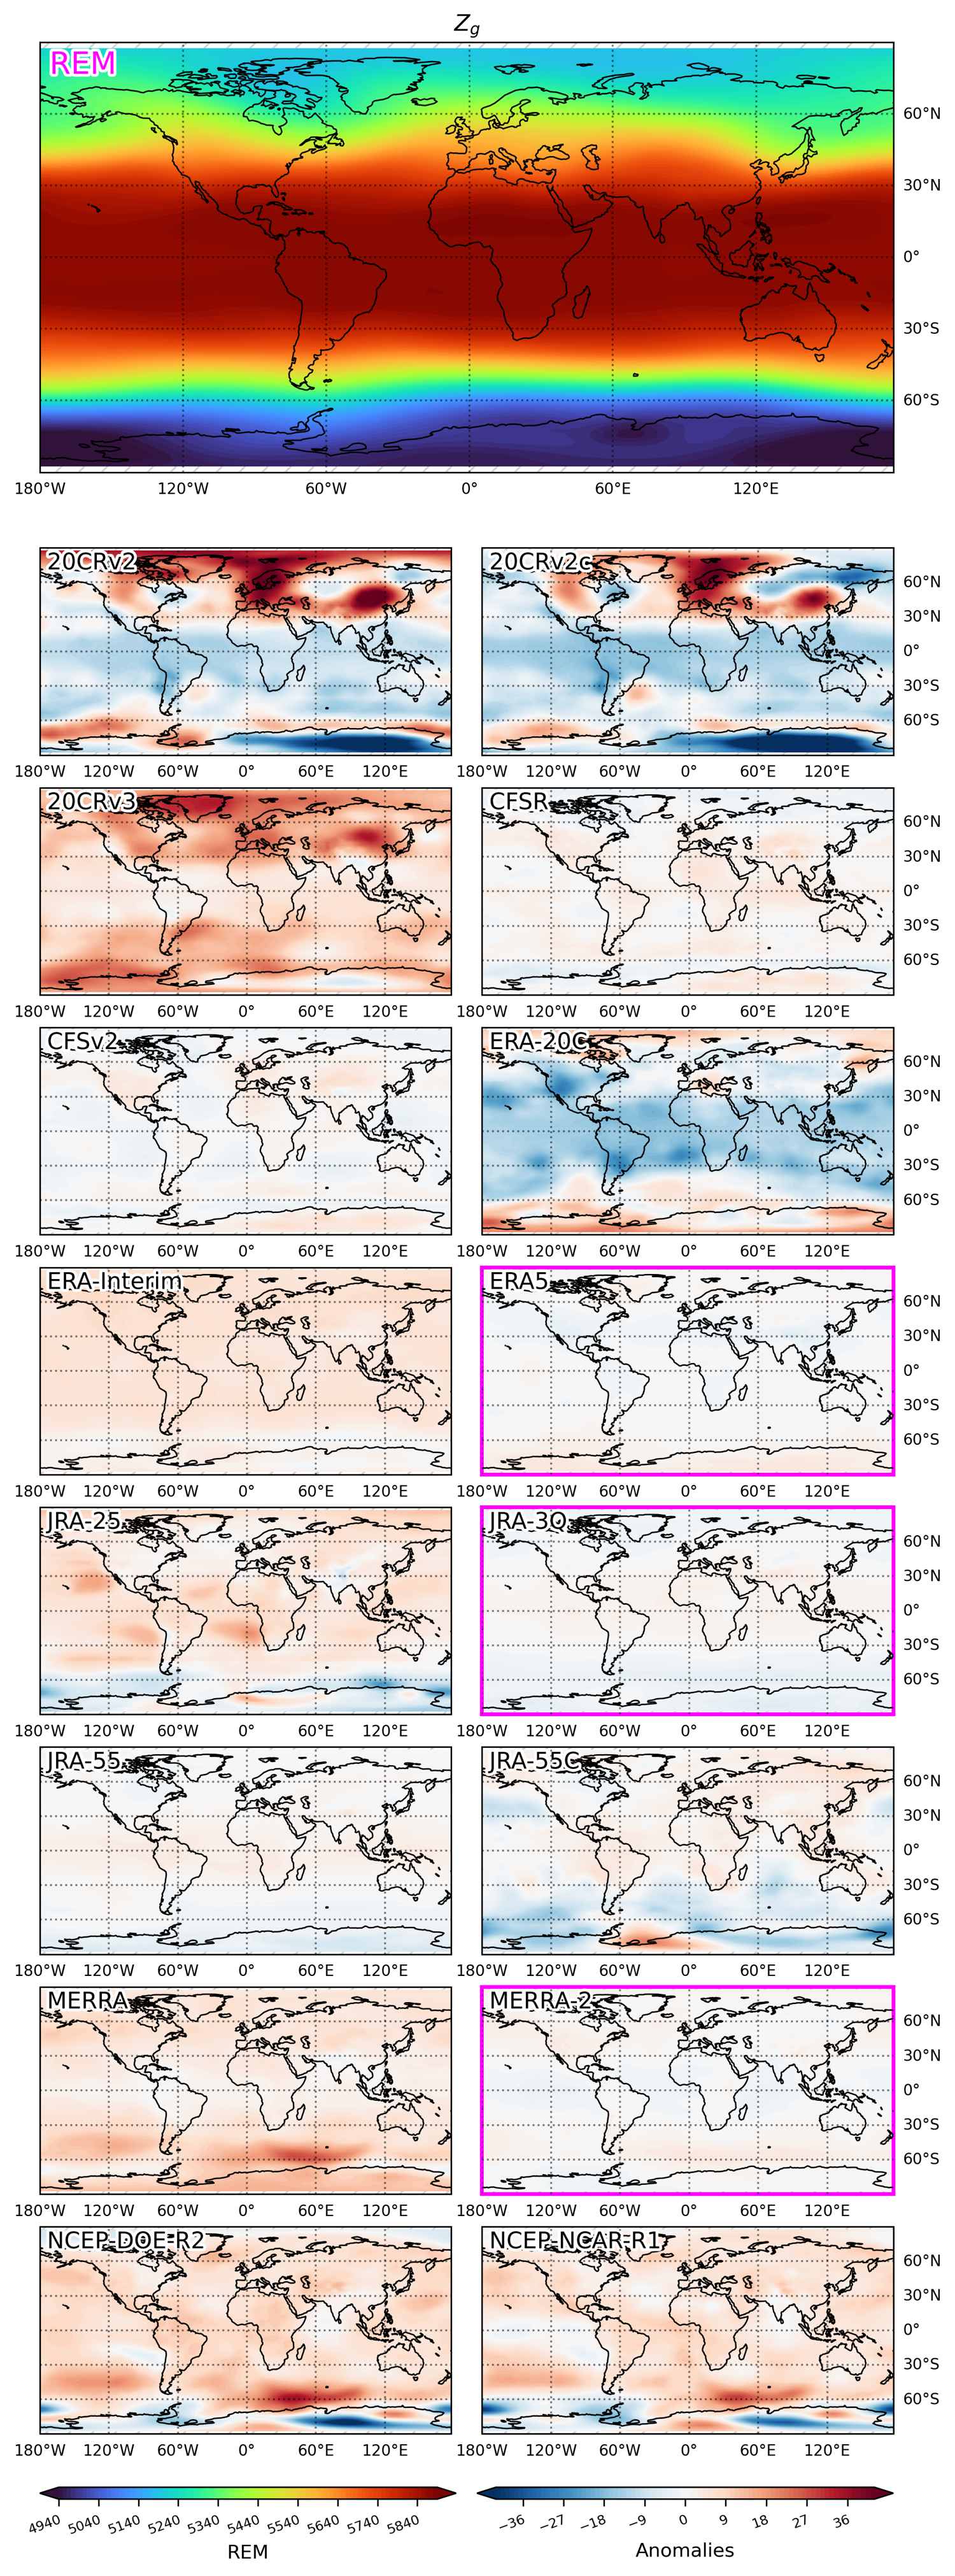
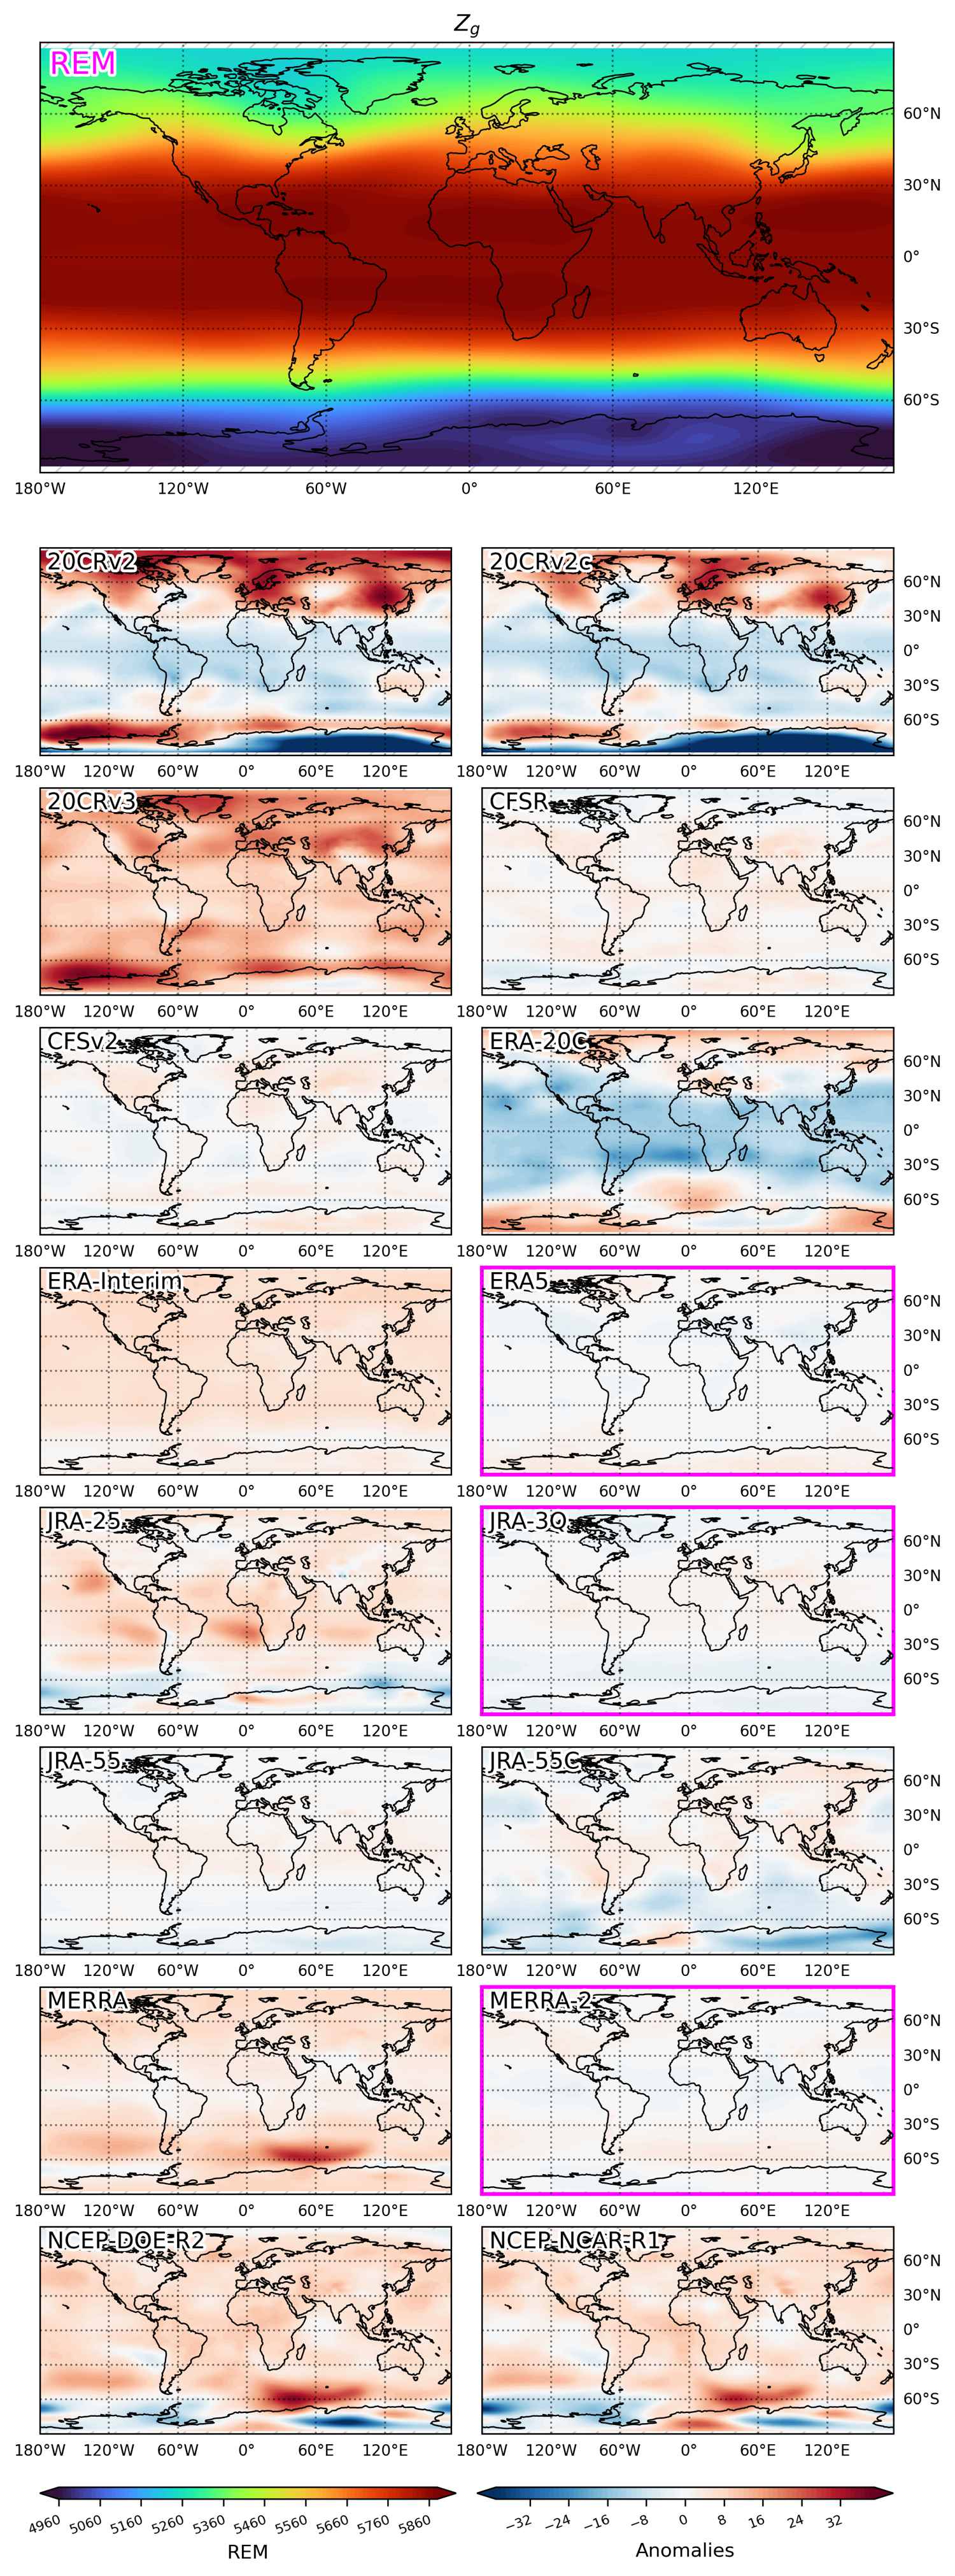
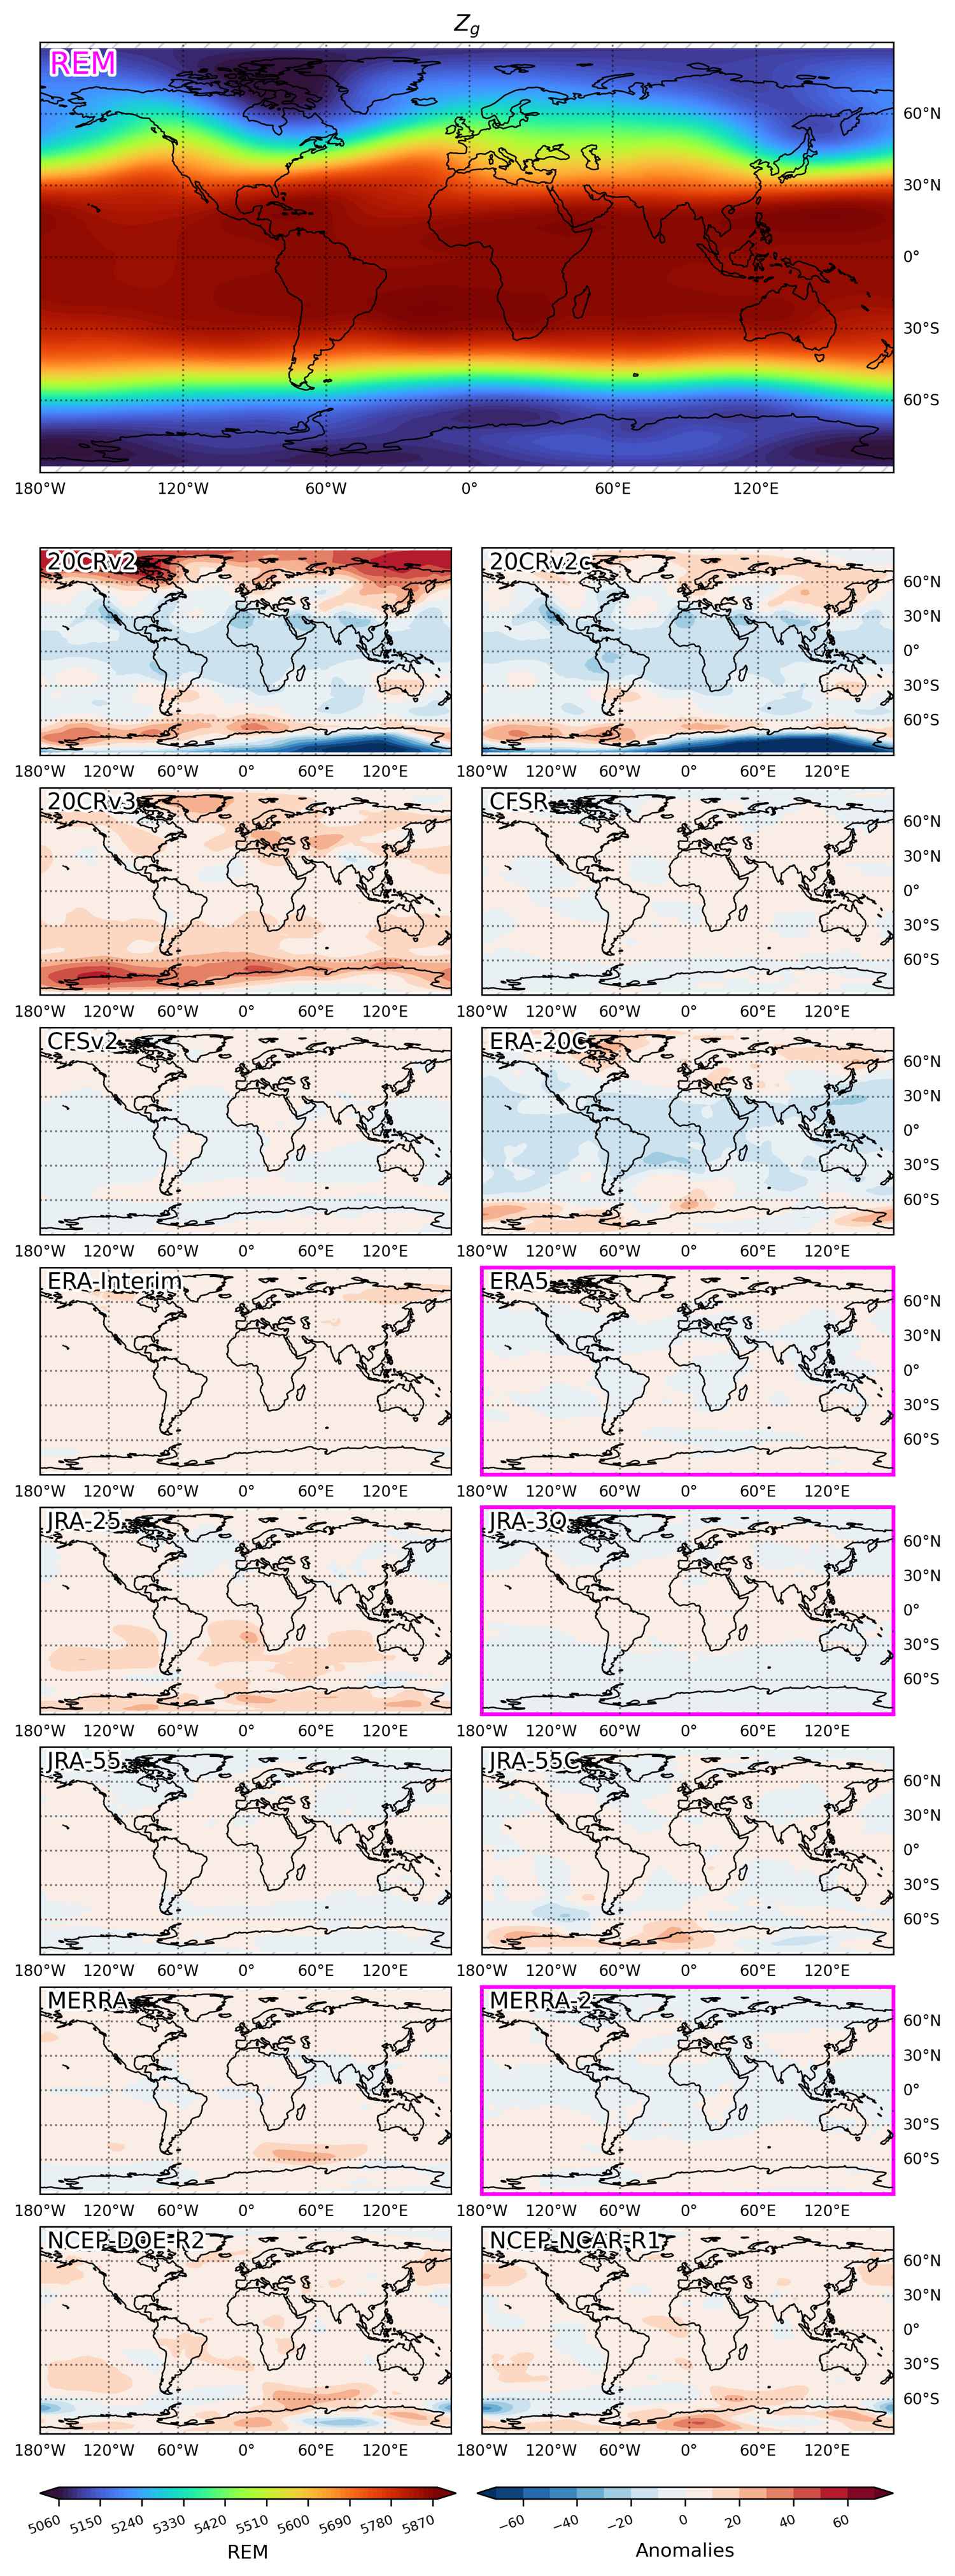
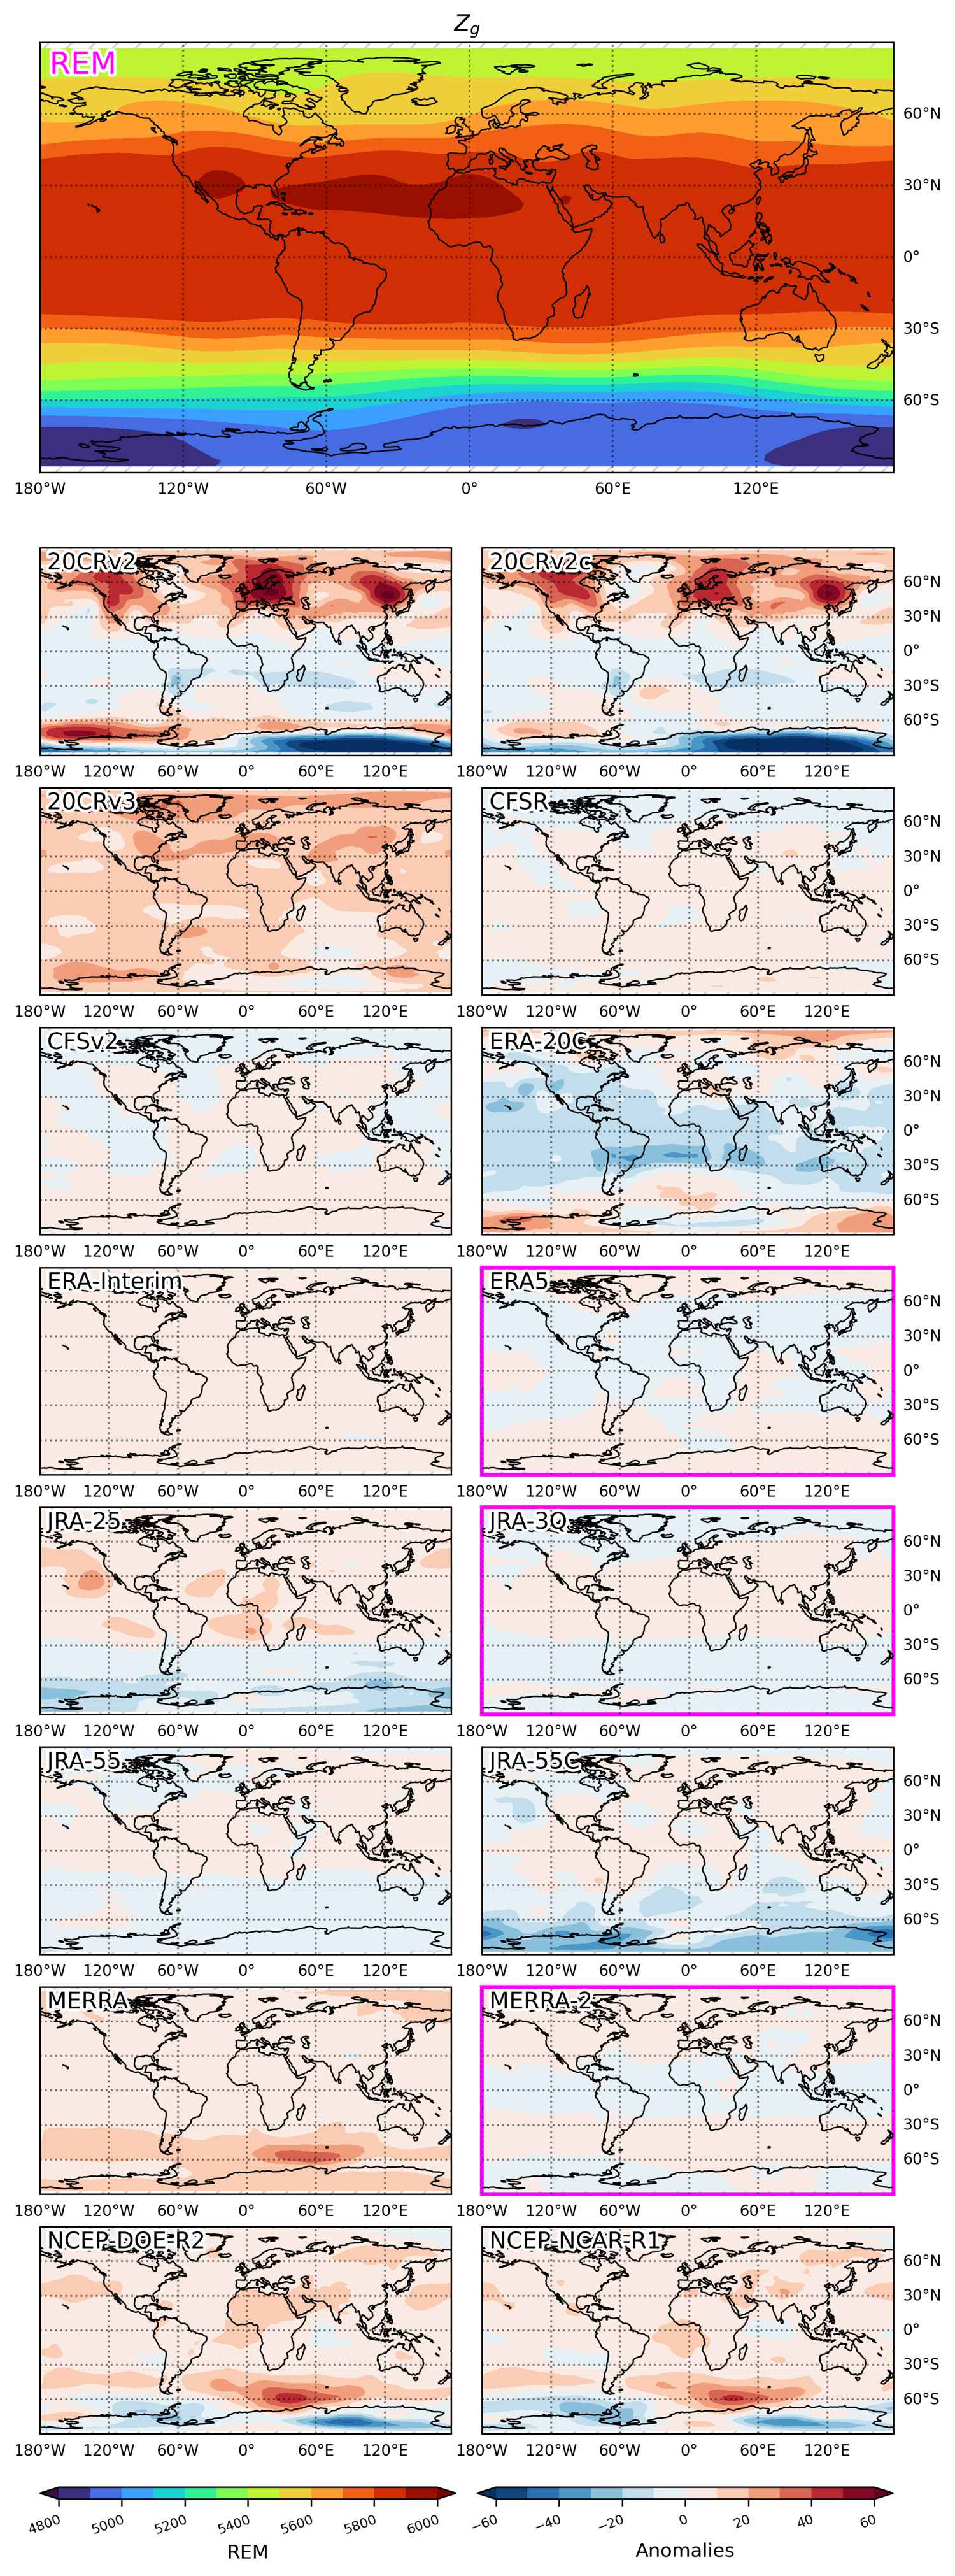
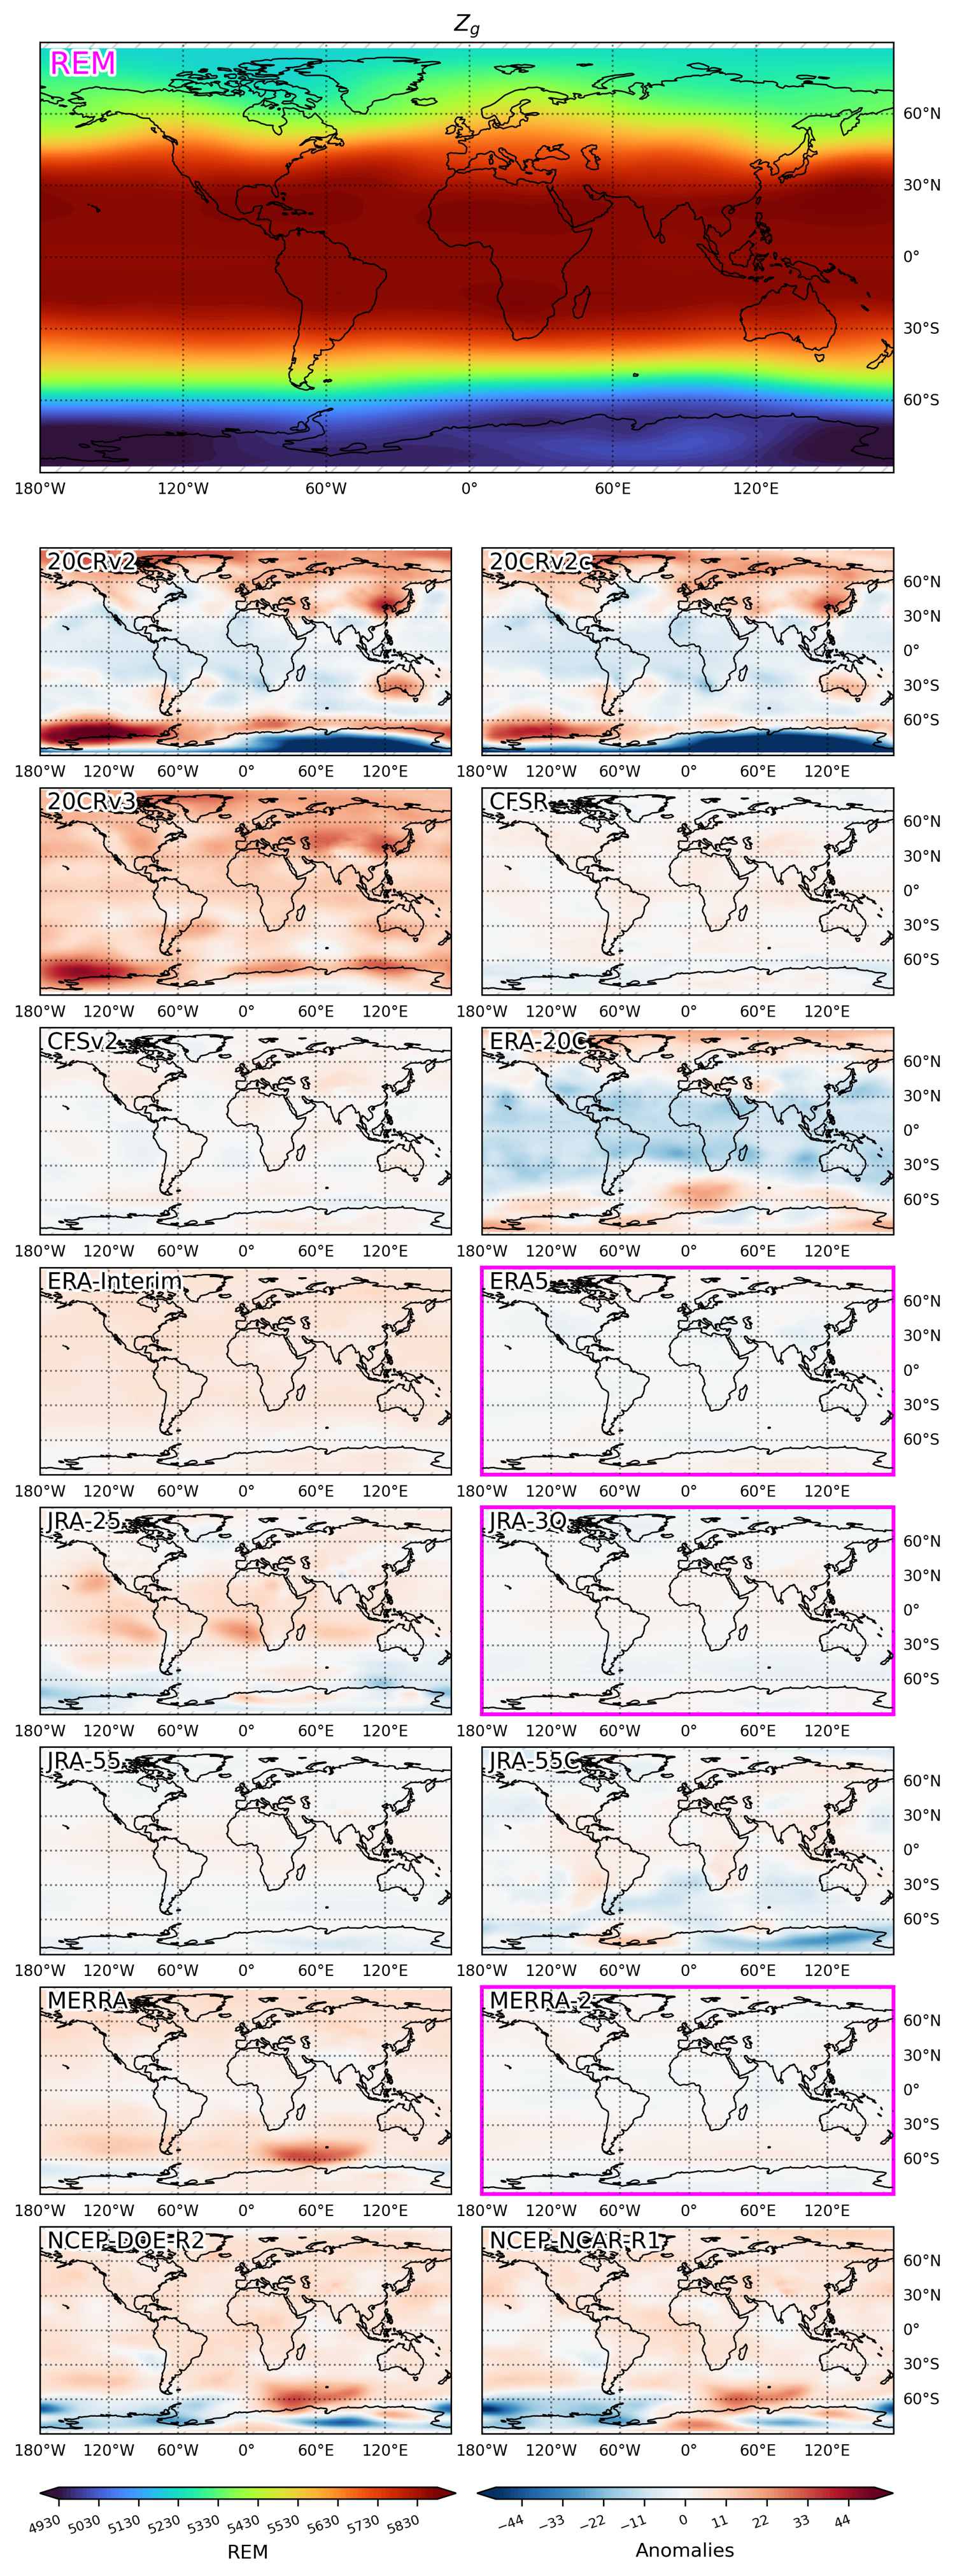
The 2010-2020 climatology is shown for a selection of variables on pressure levels. The upper panel shows the reanalysis ensemble mean (REM) which comprises the datasets bordered in magenta. The lower panels show the bias of each dataset with respect to the REM.
Climatology of q850 (Specific humidity at 850 hPa) at 850 hPa
Climatology of t850 (Temperature at 850 hPa) at 850 hPa
Climatology of z10 (Geopotential height at 10 hPa) at 10 hPa
Climatology of z500 (Geopotential height at 500 hPa) at 500 hPa