NetCDF variable name: flux_term
Data located in zonal >tem-thermo (daily), (monthly)
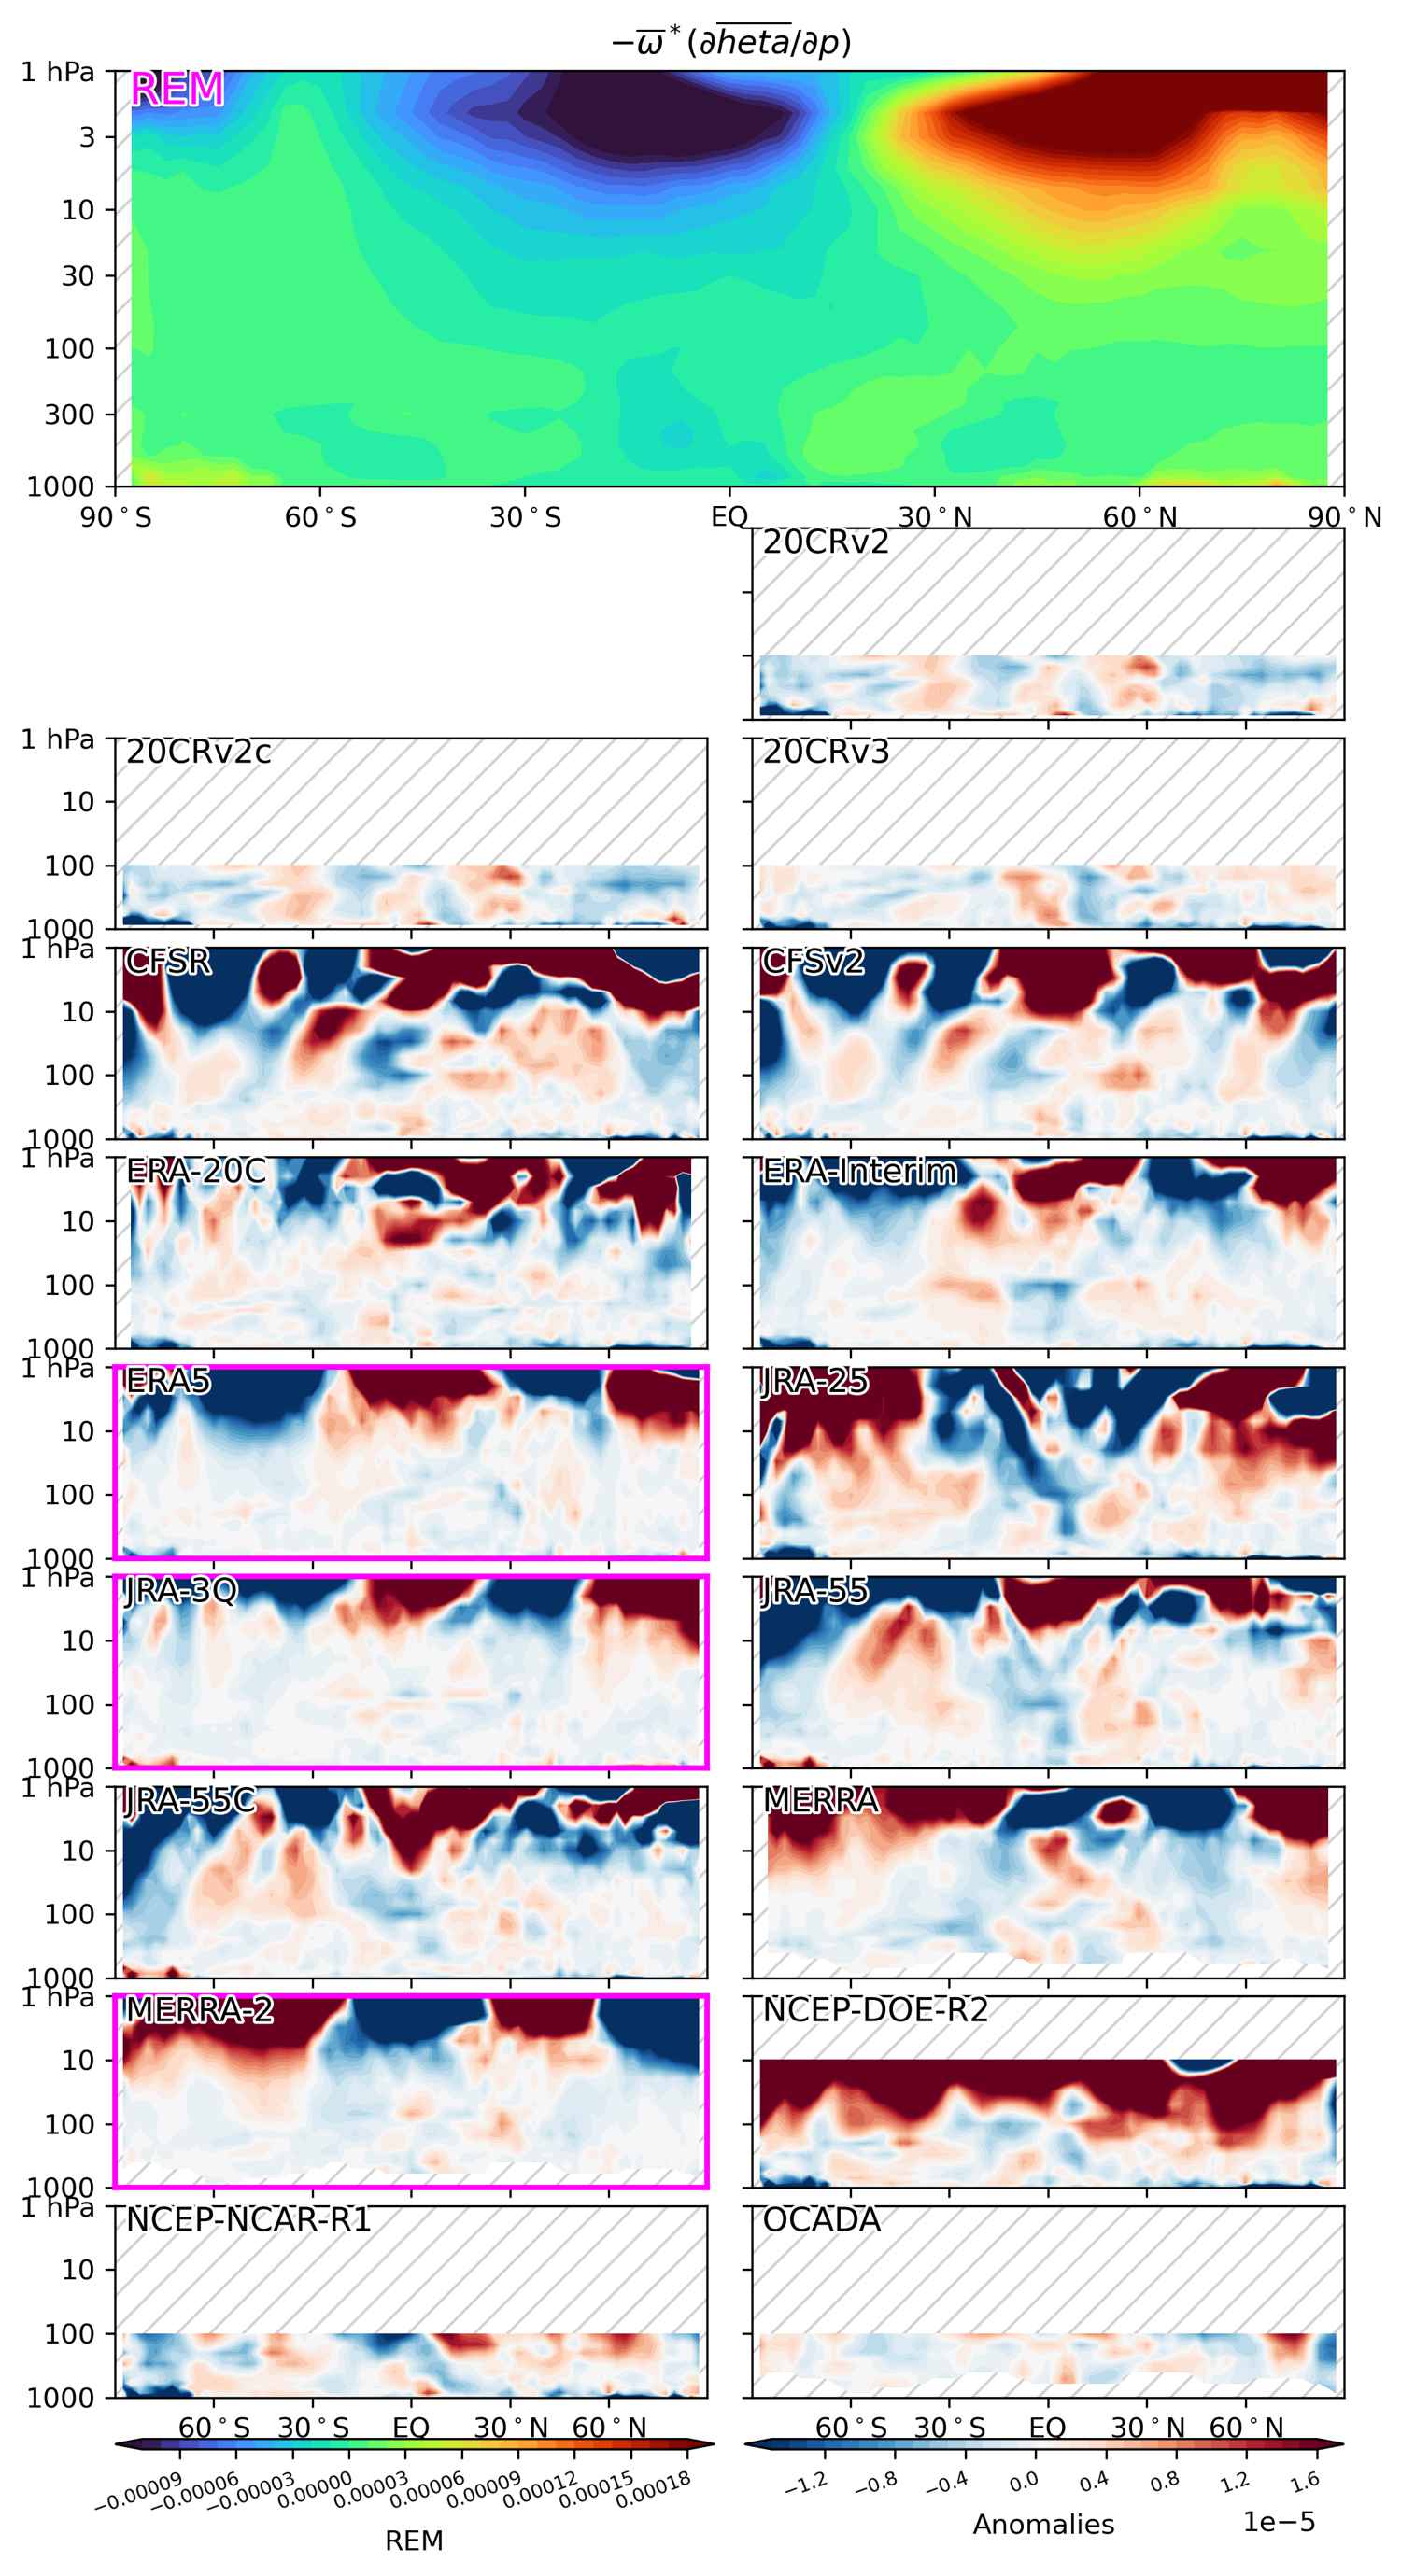
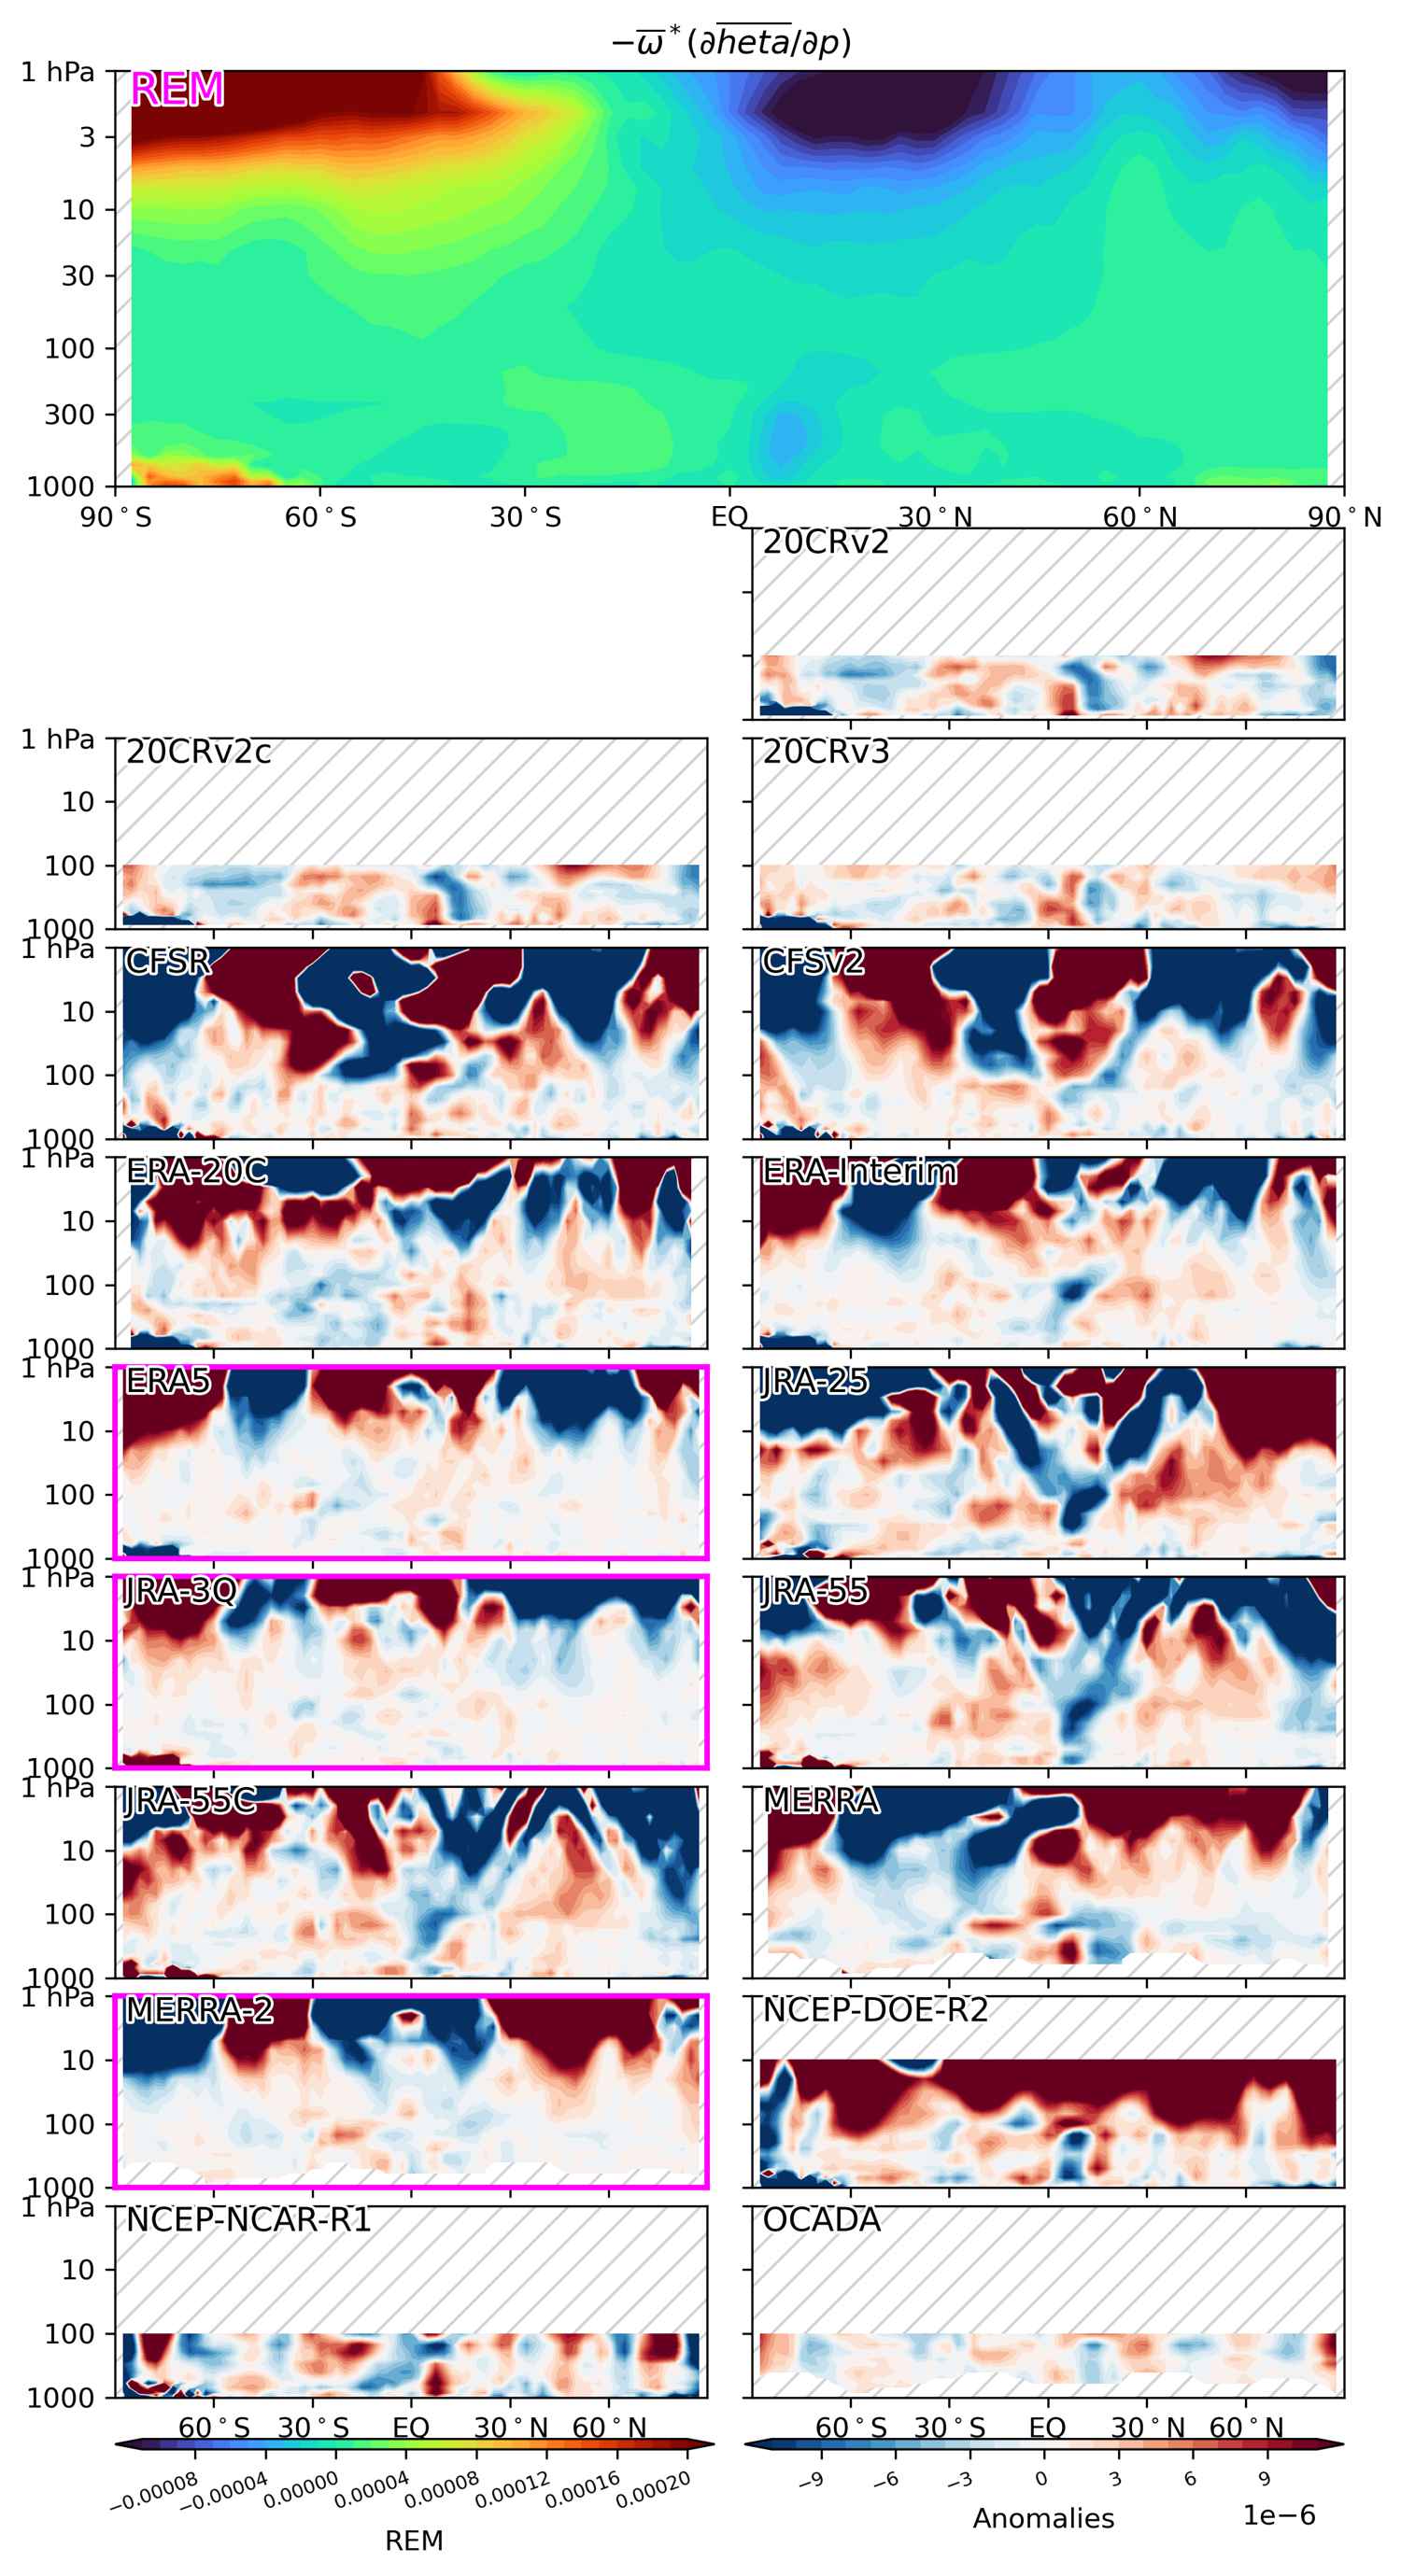
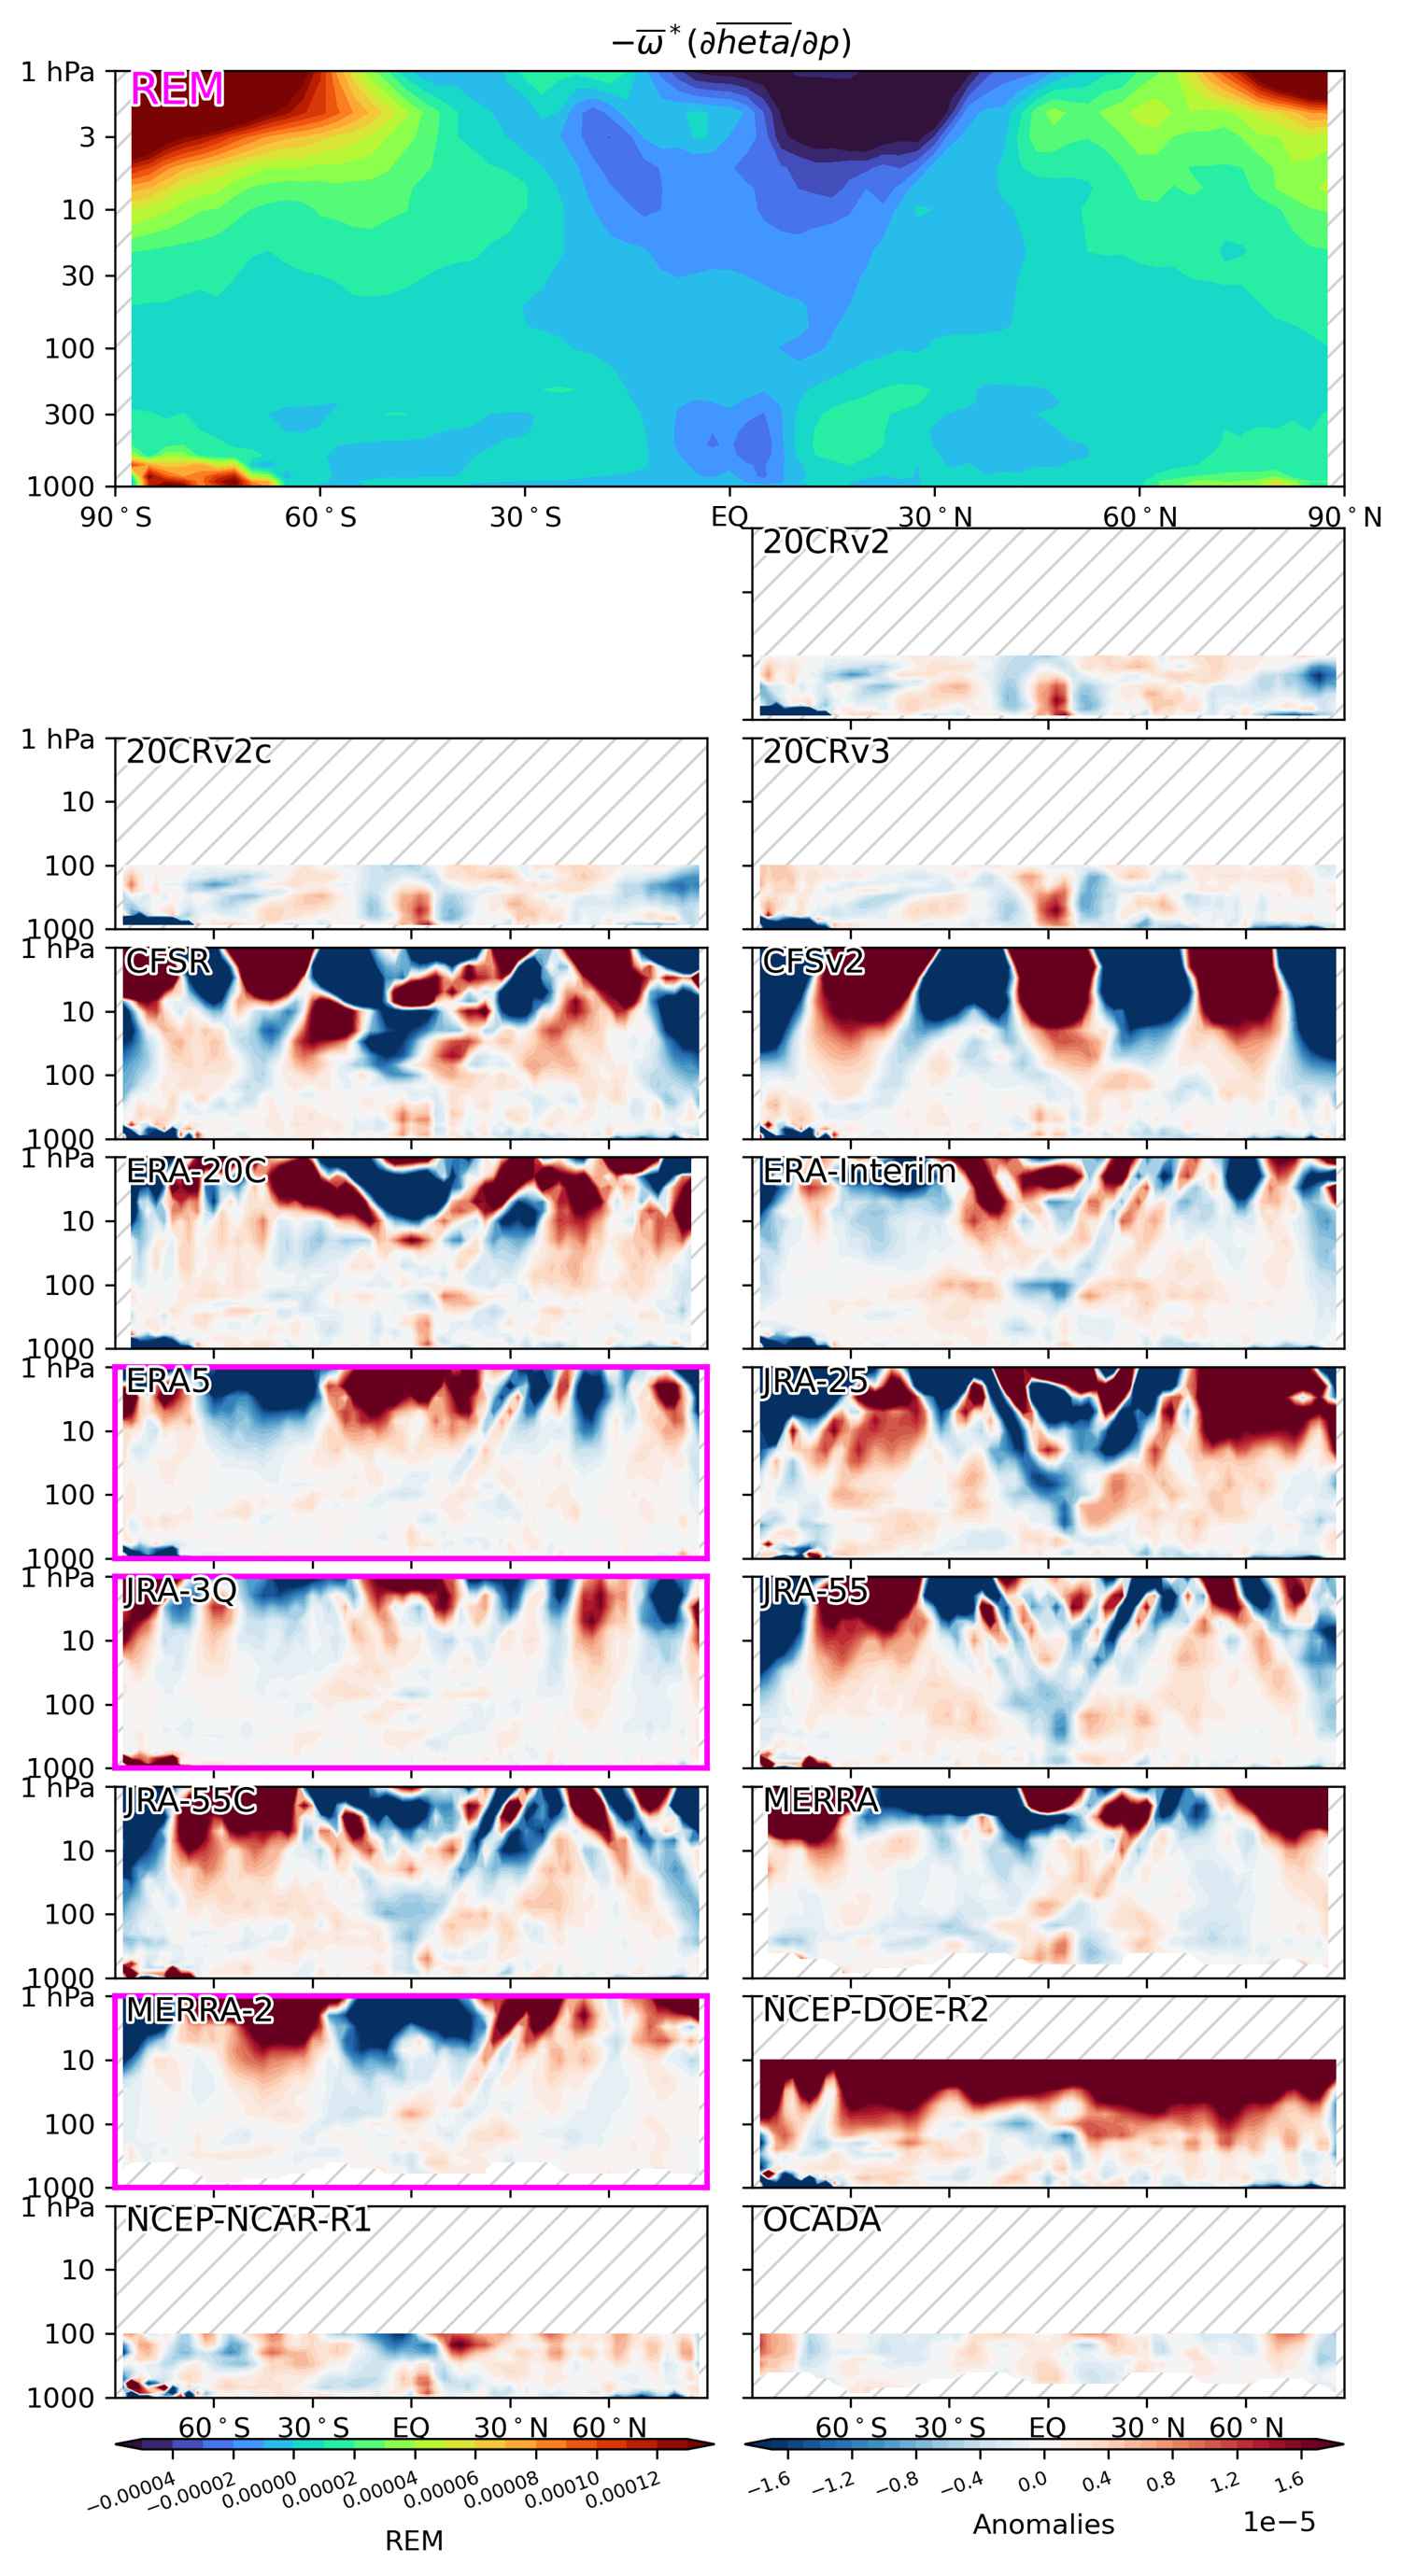
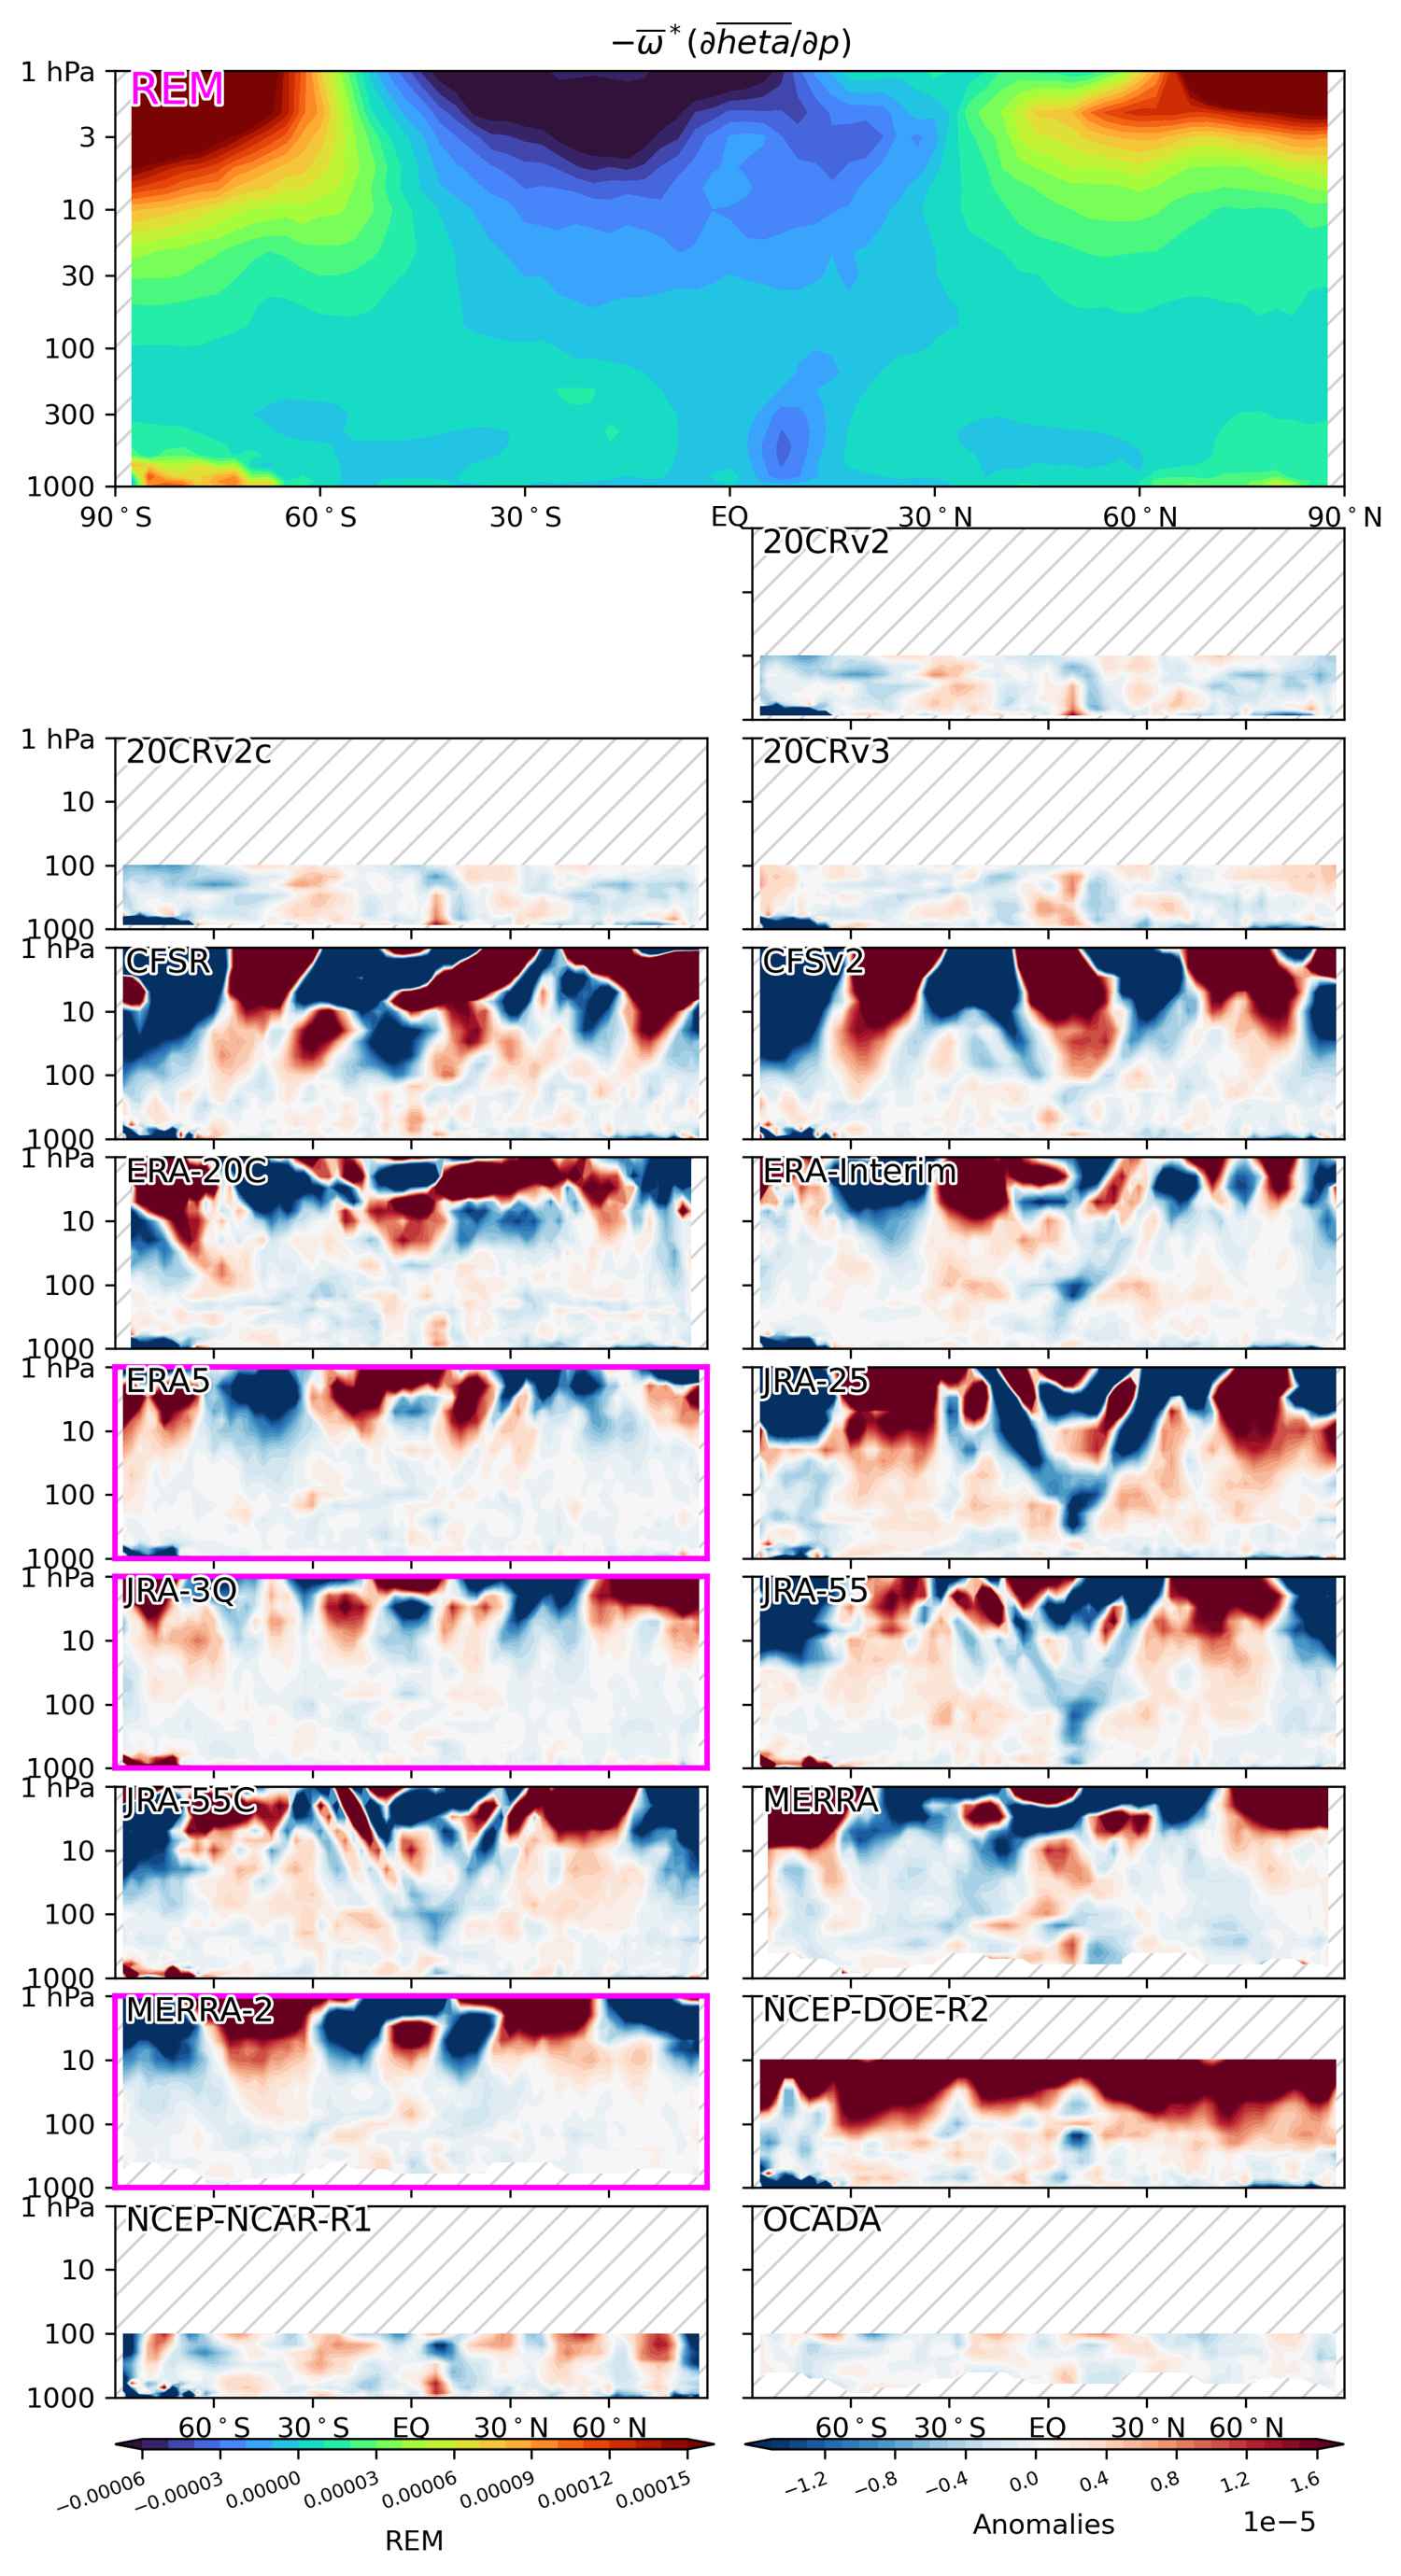
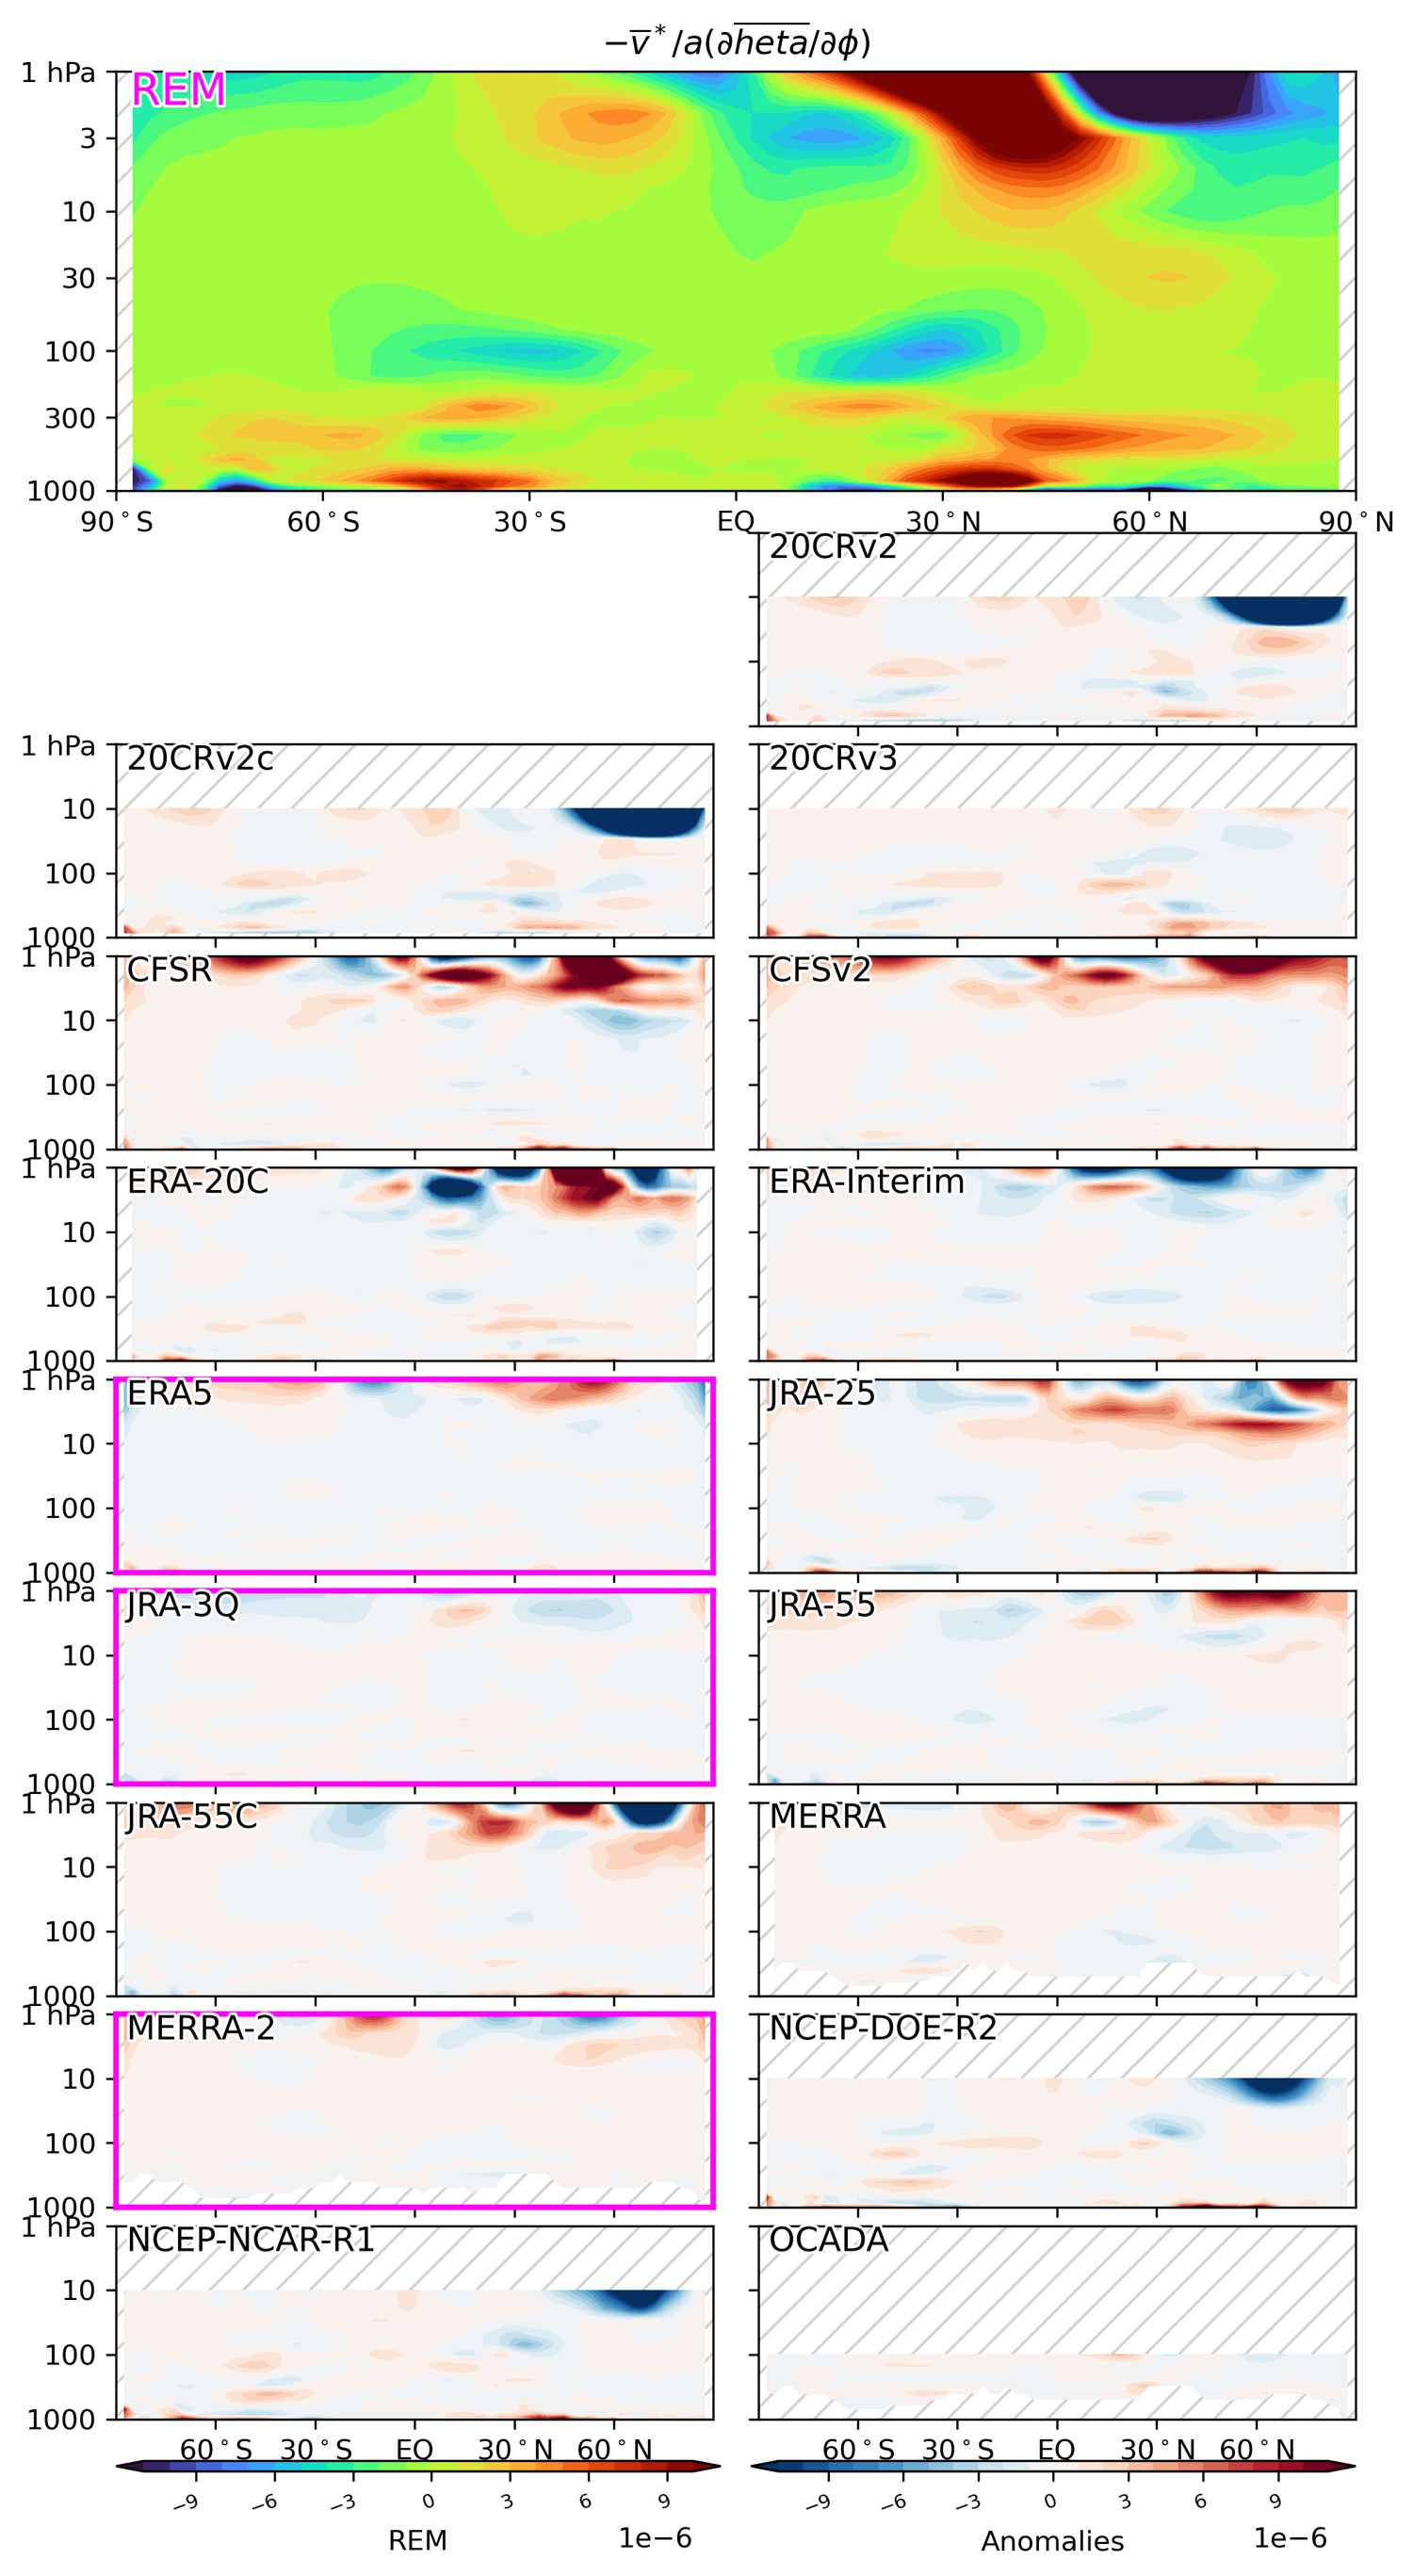
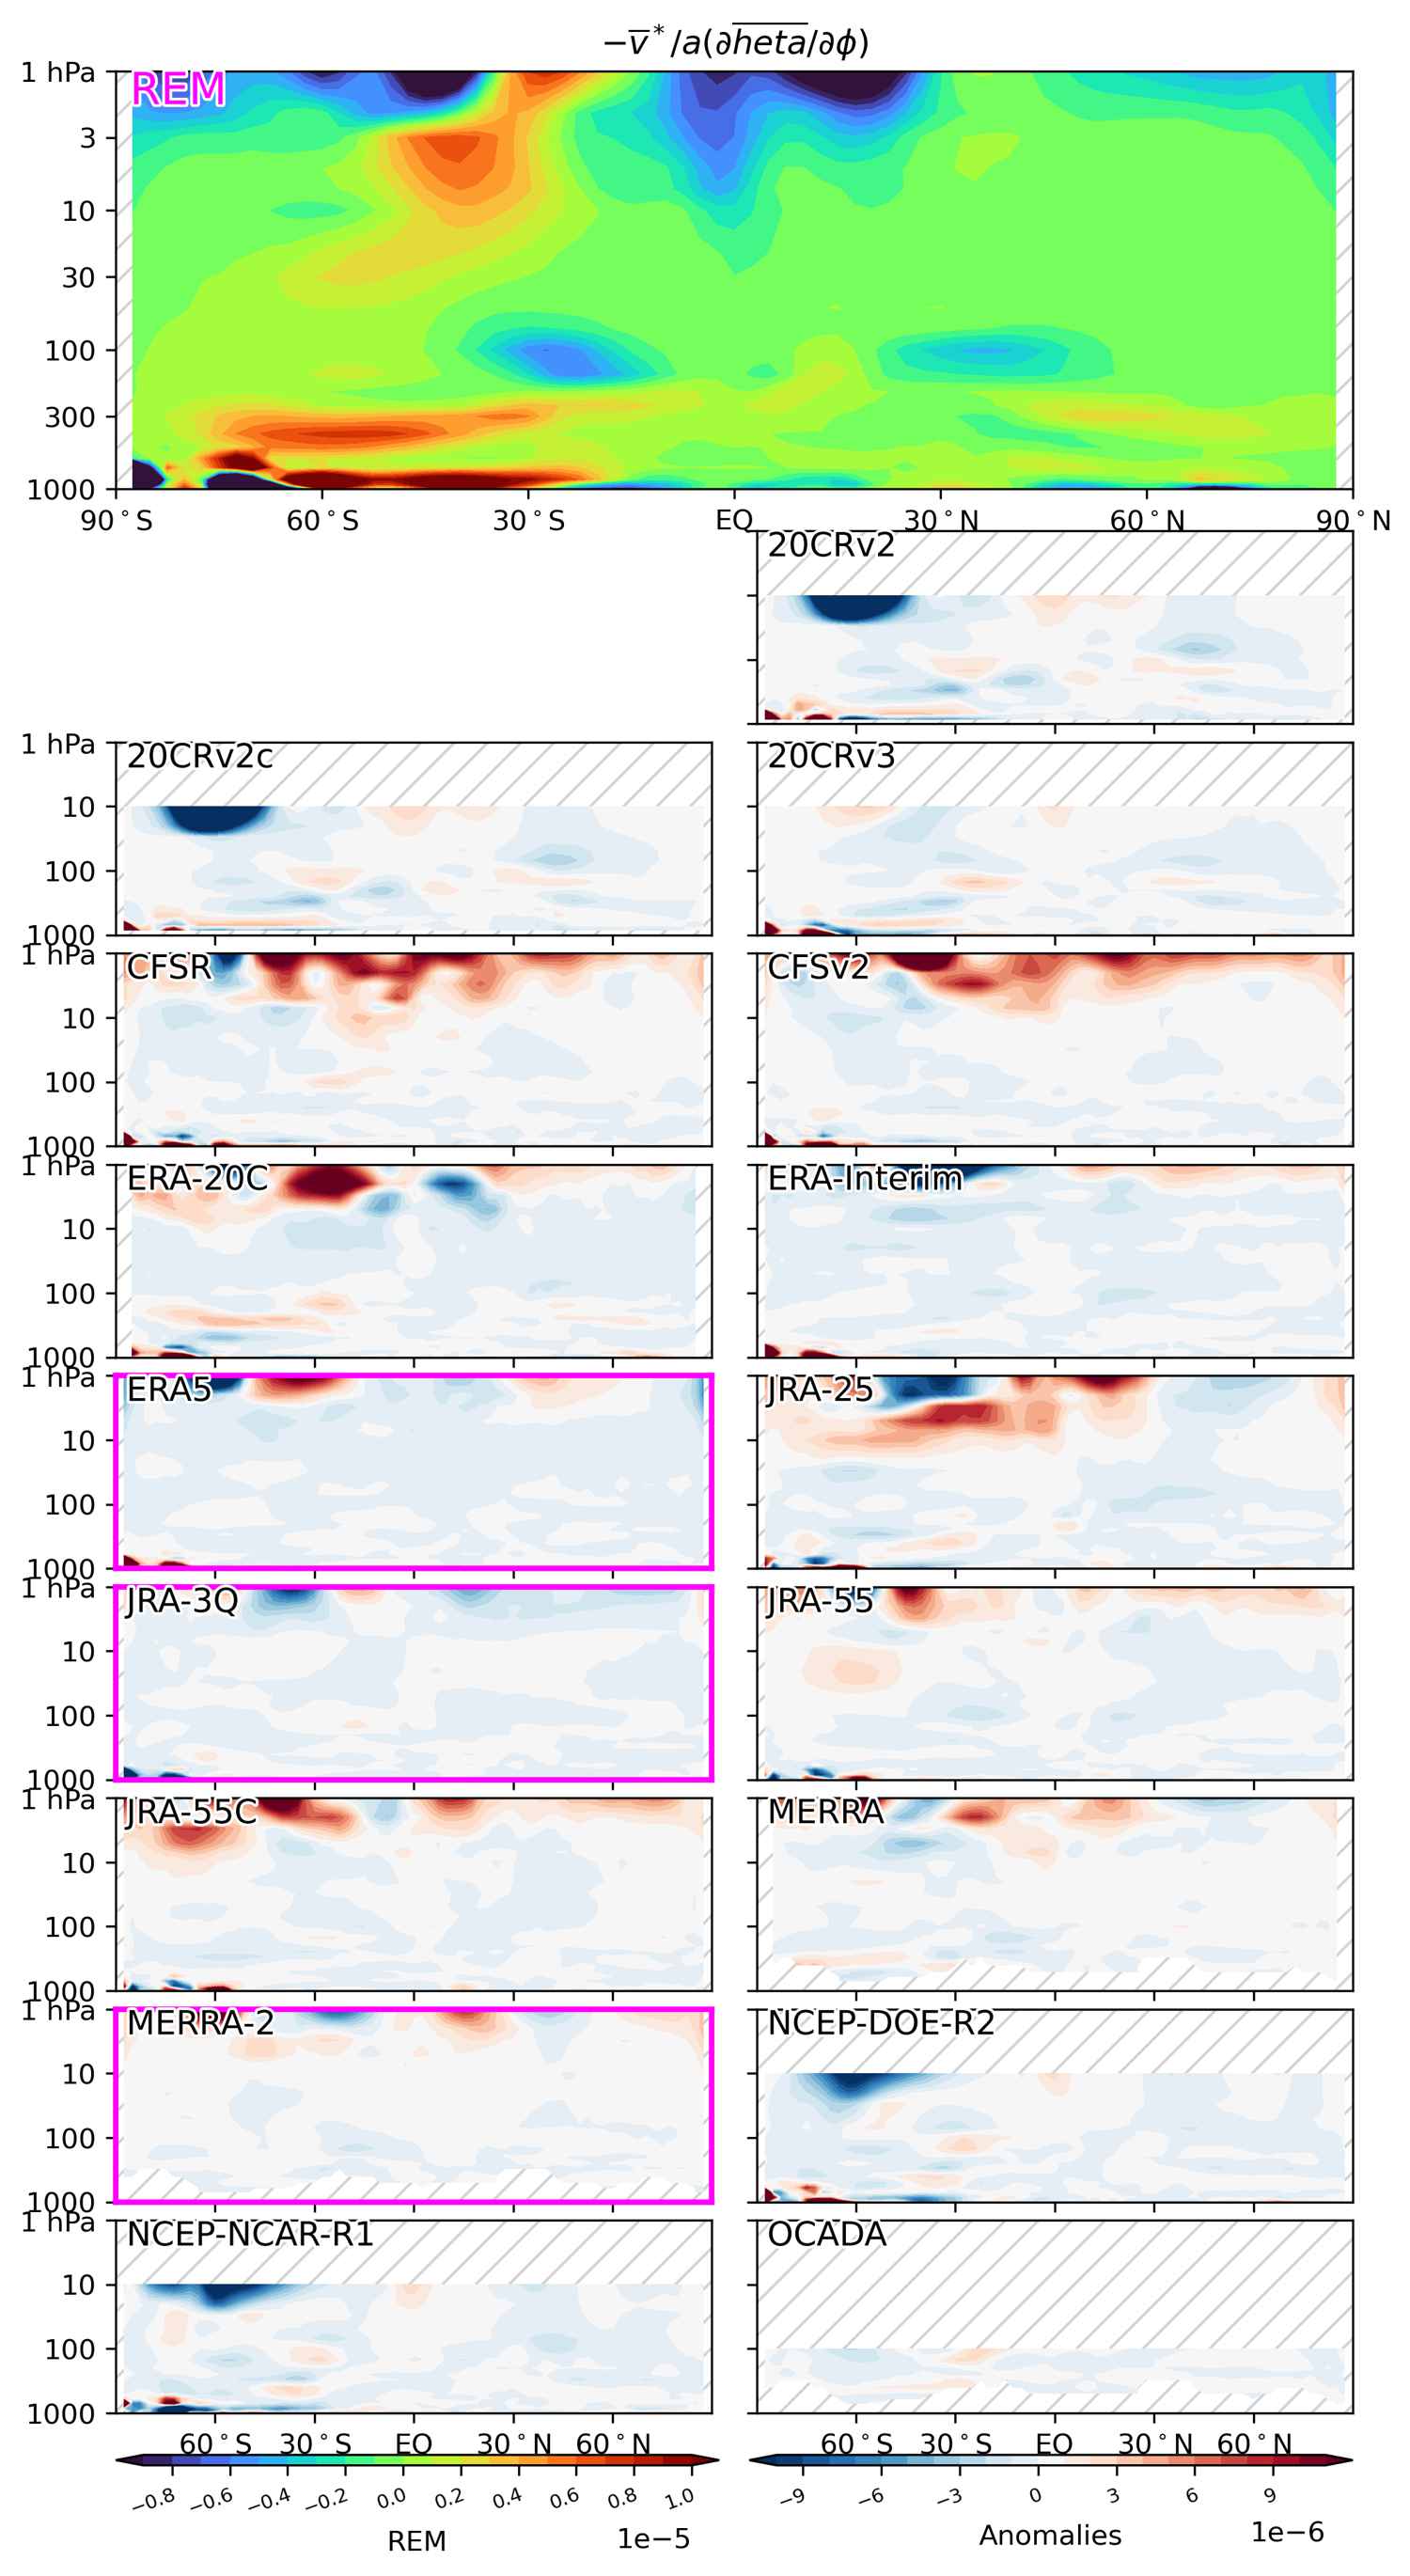
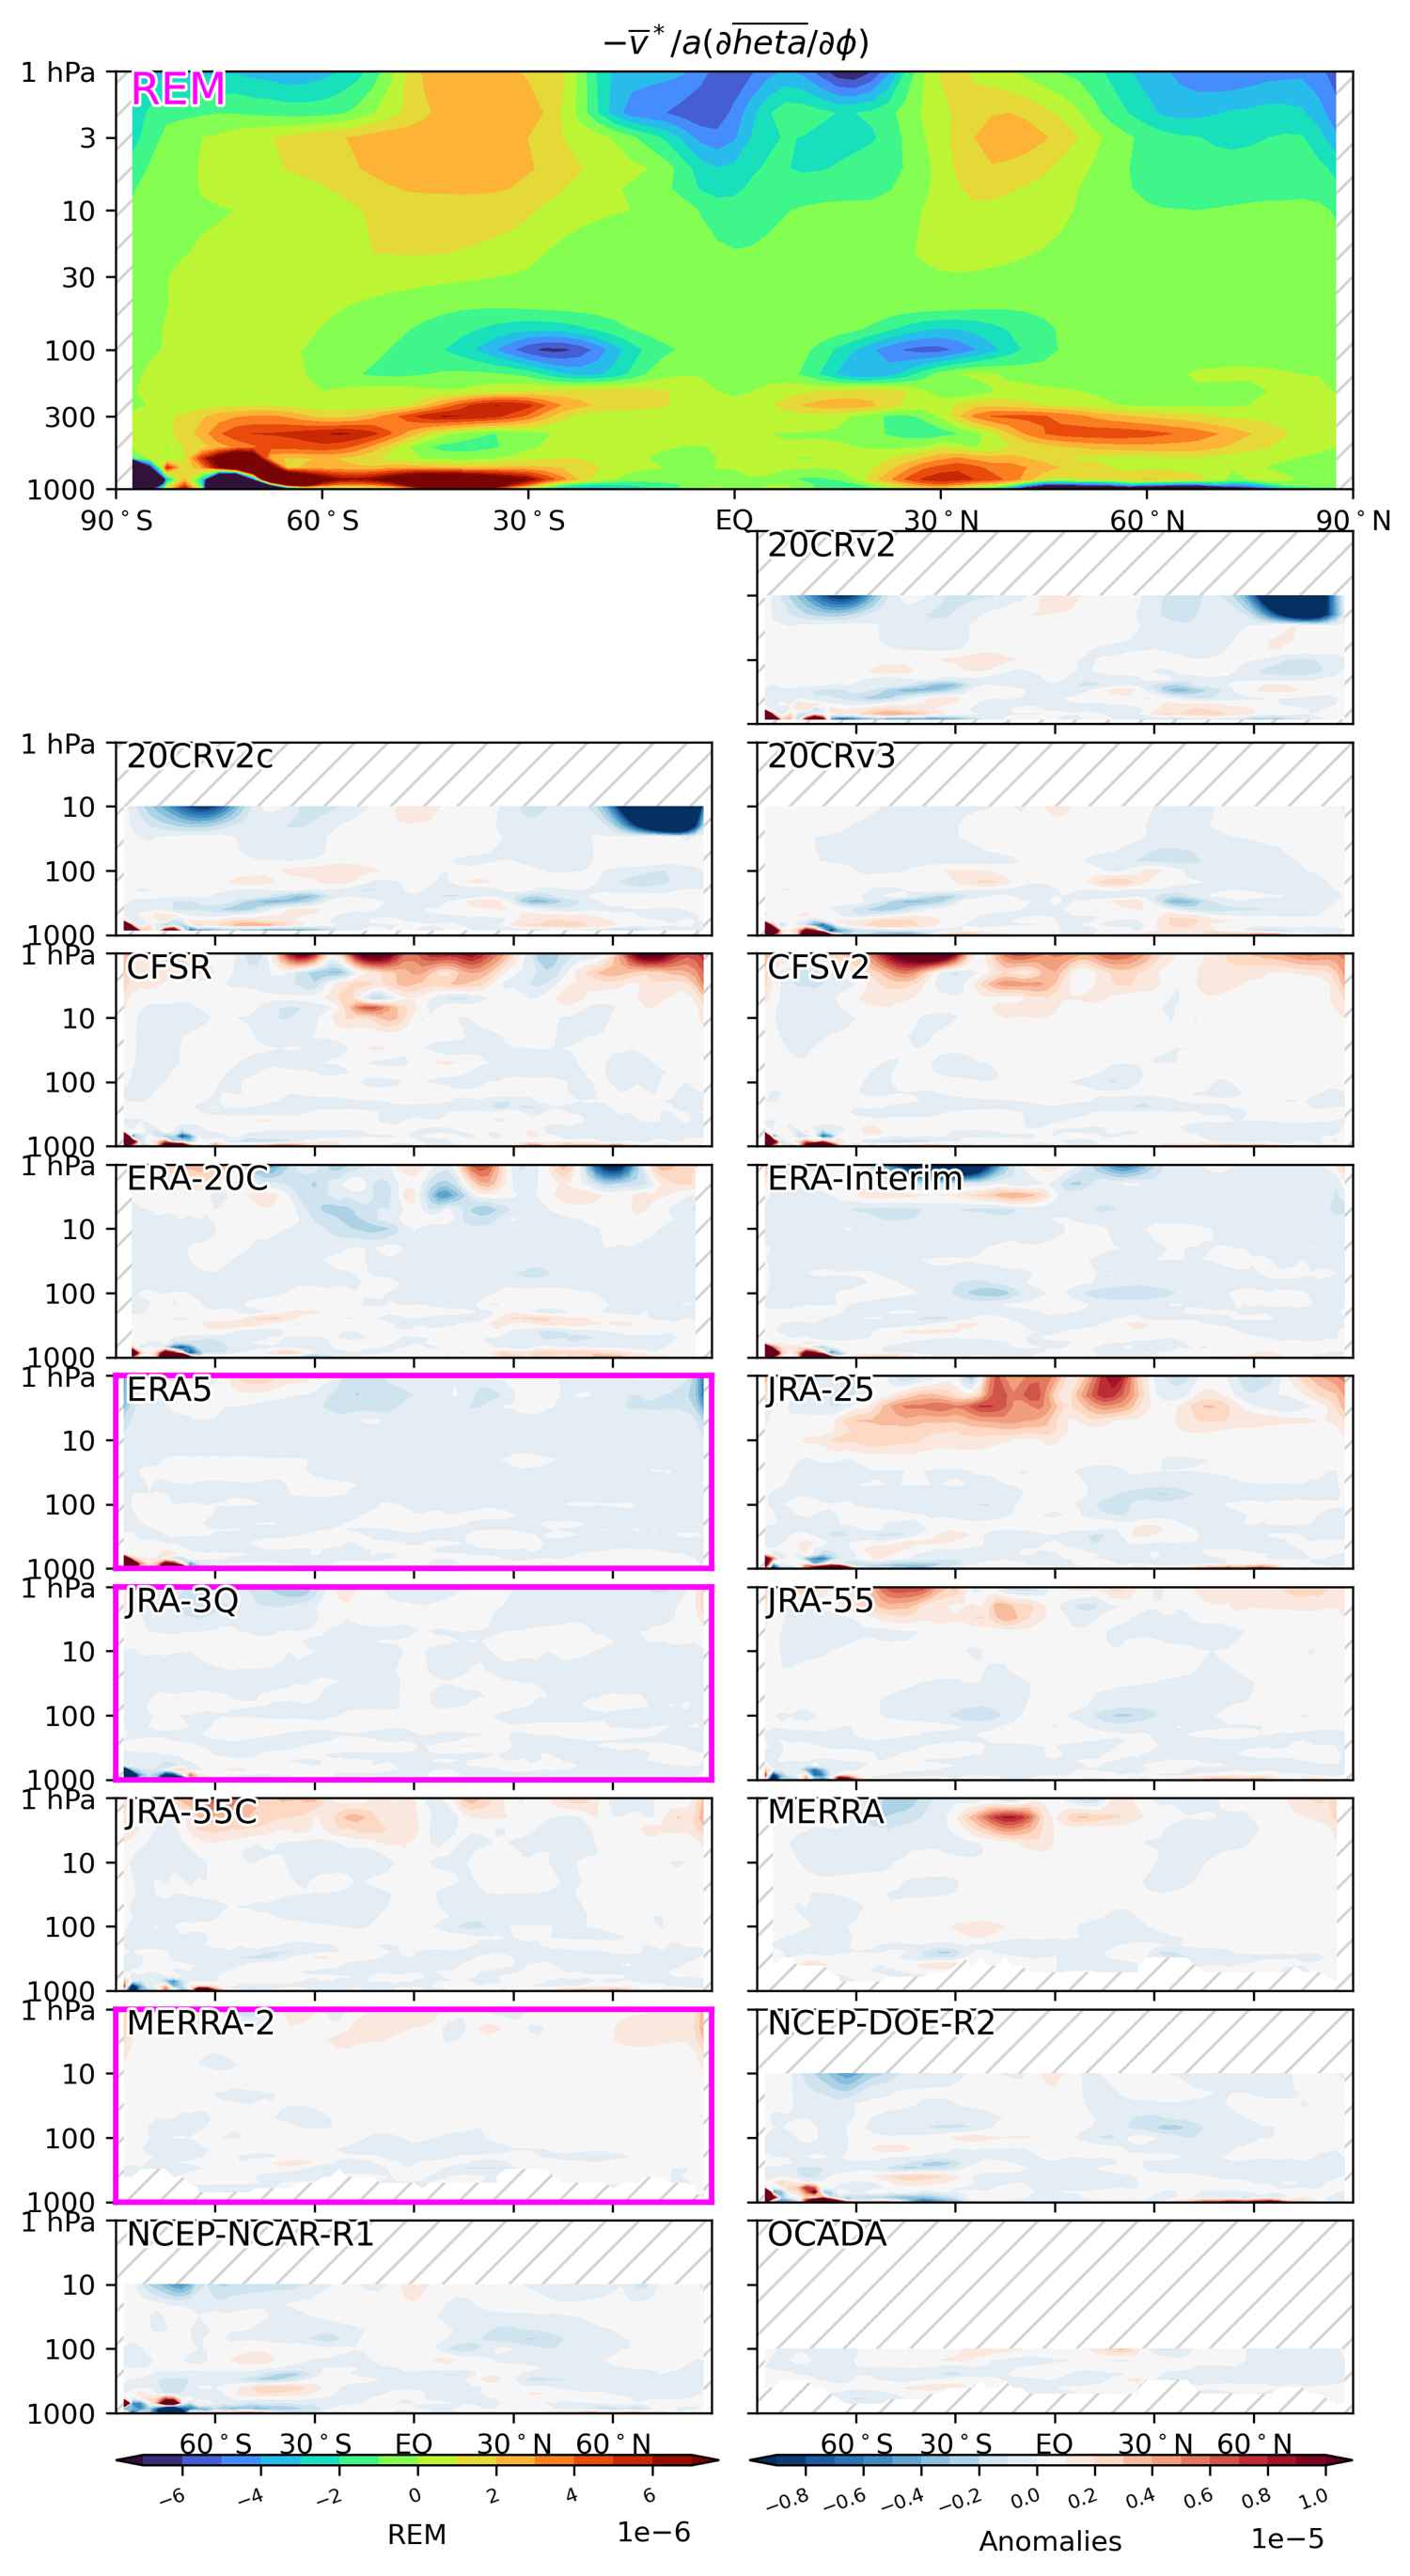
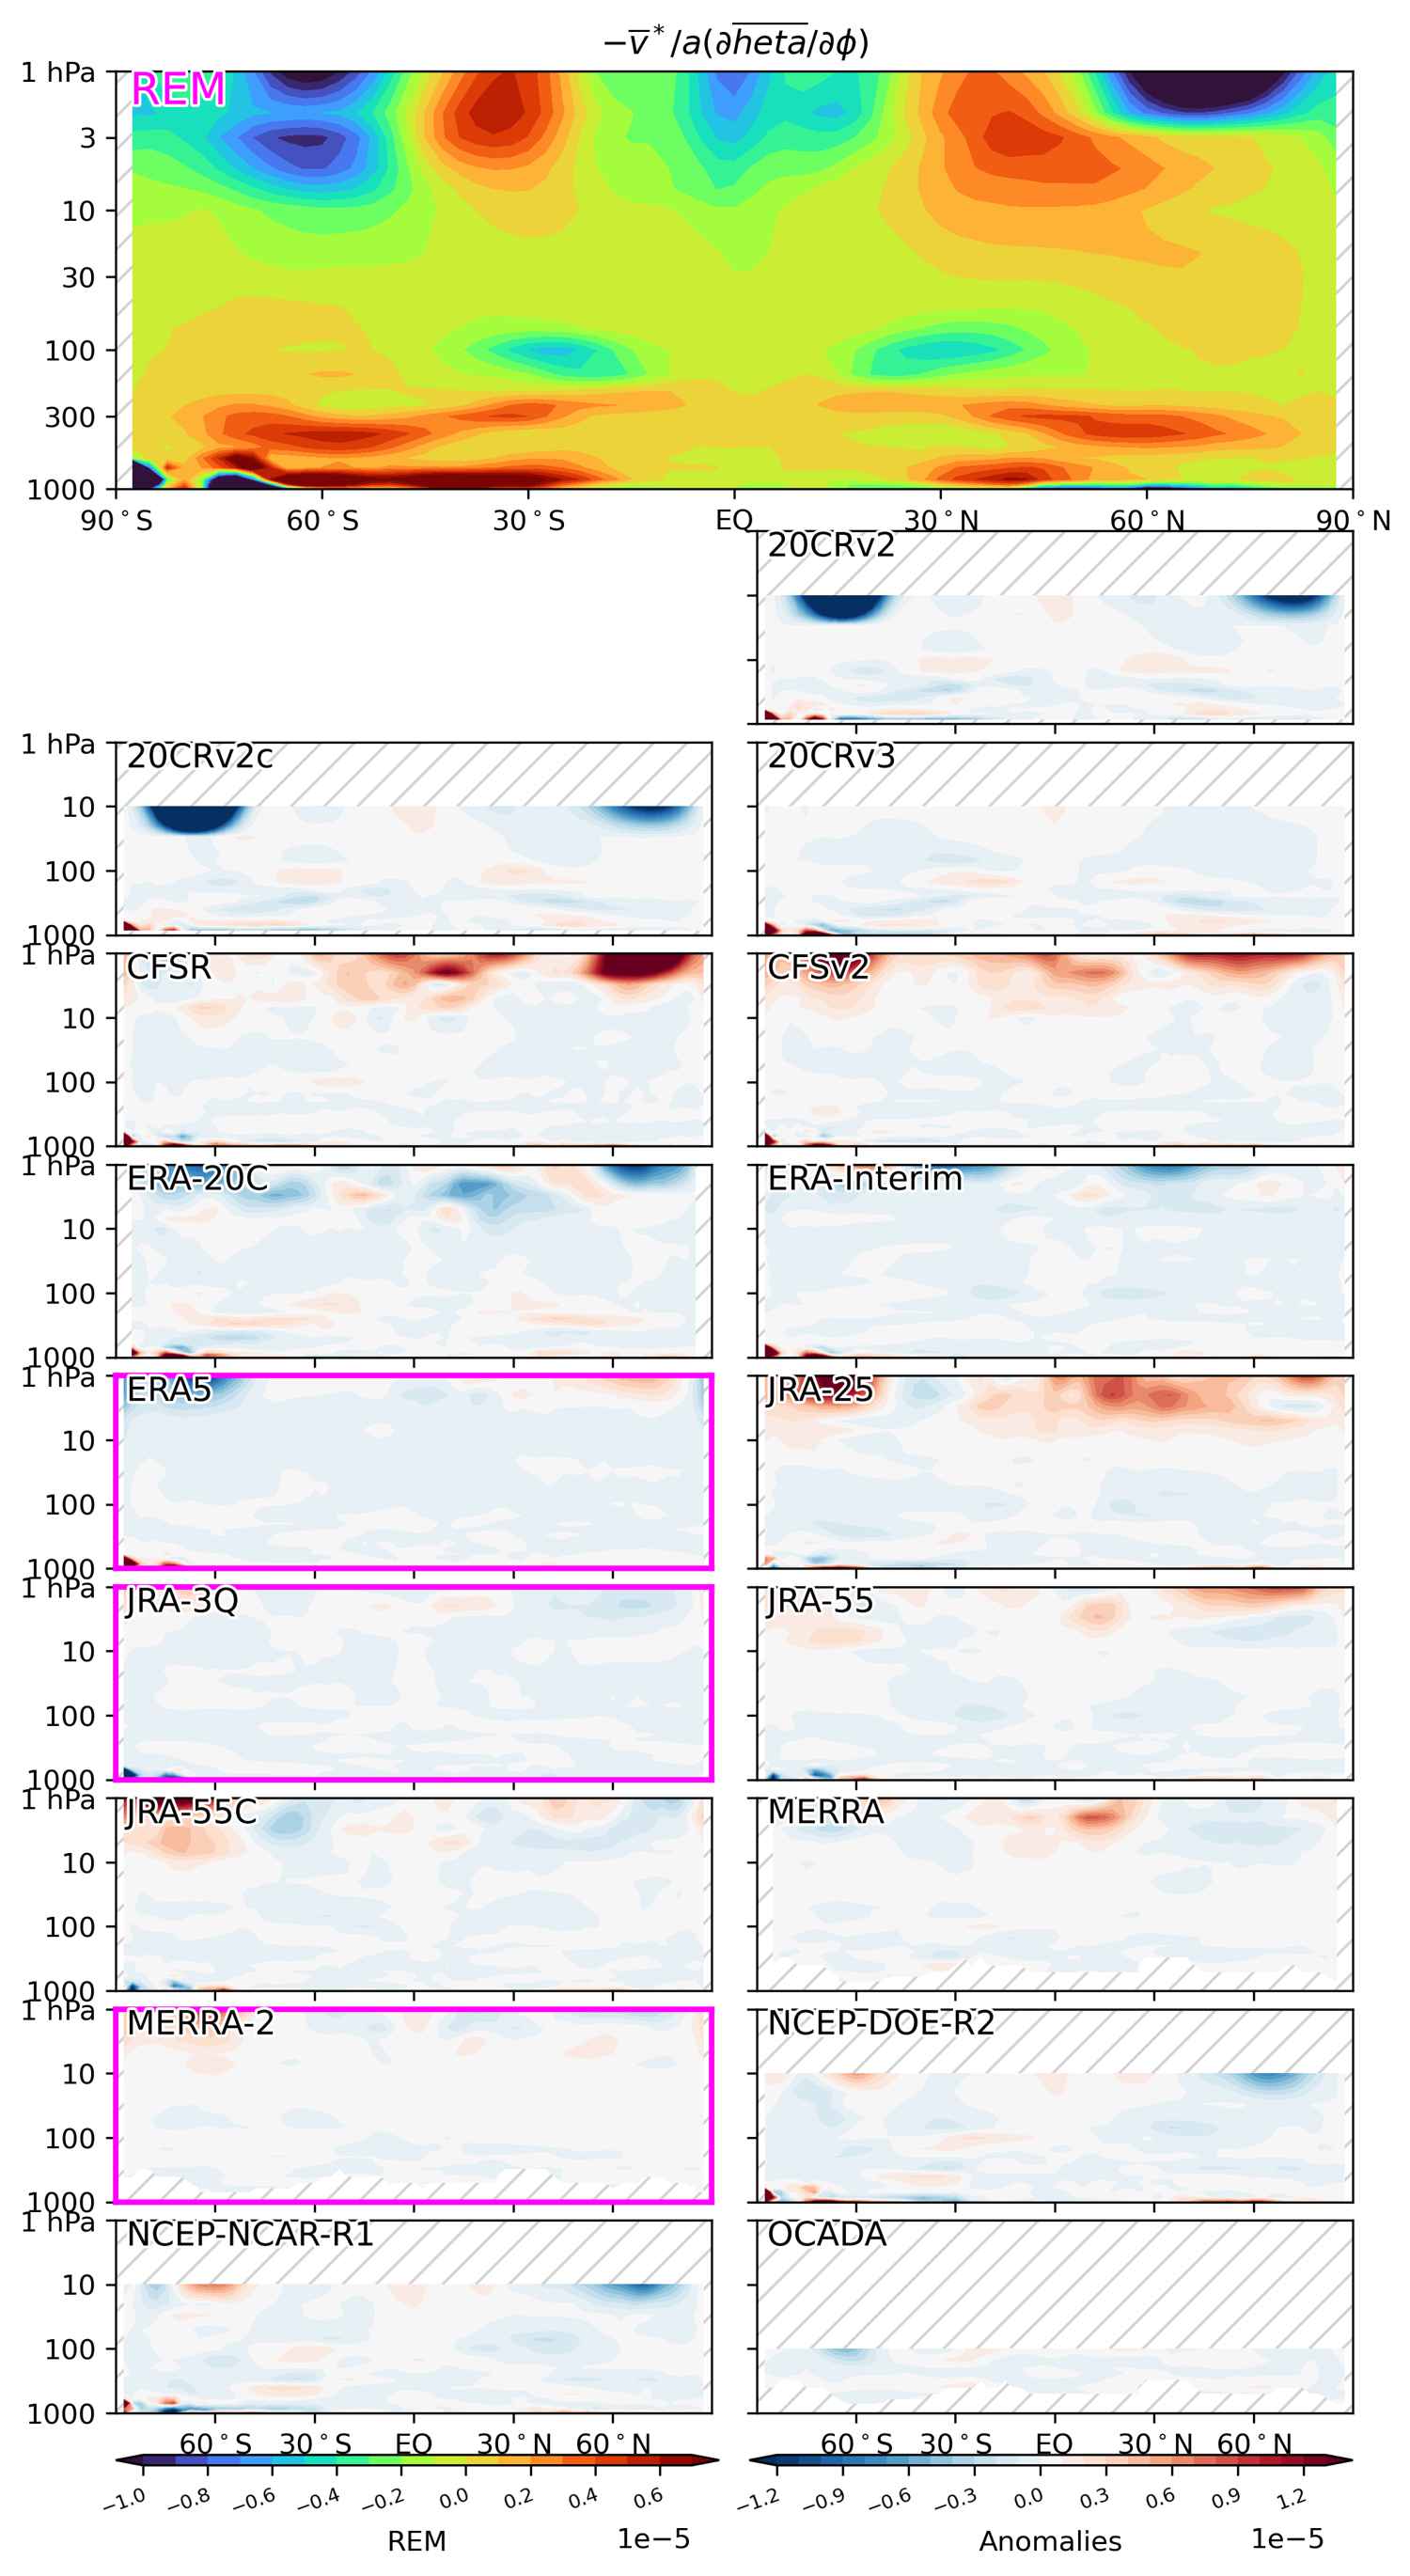
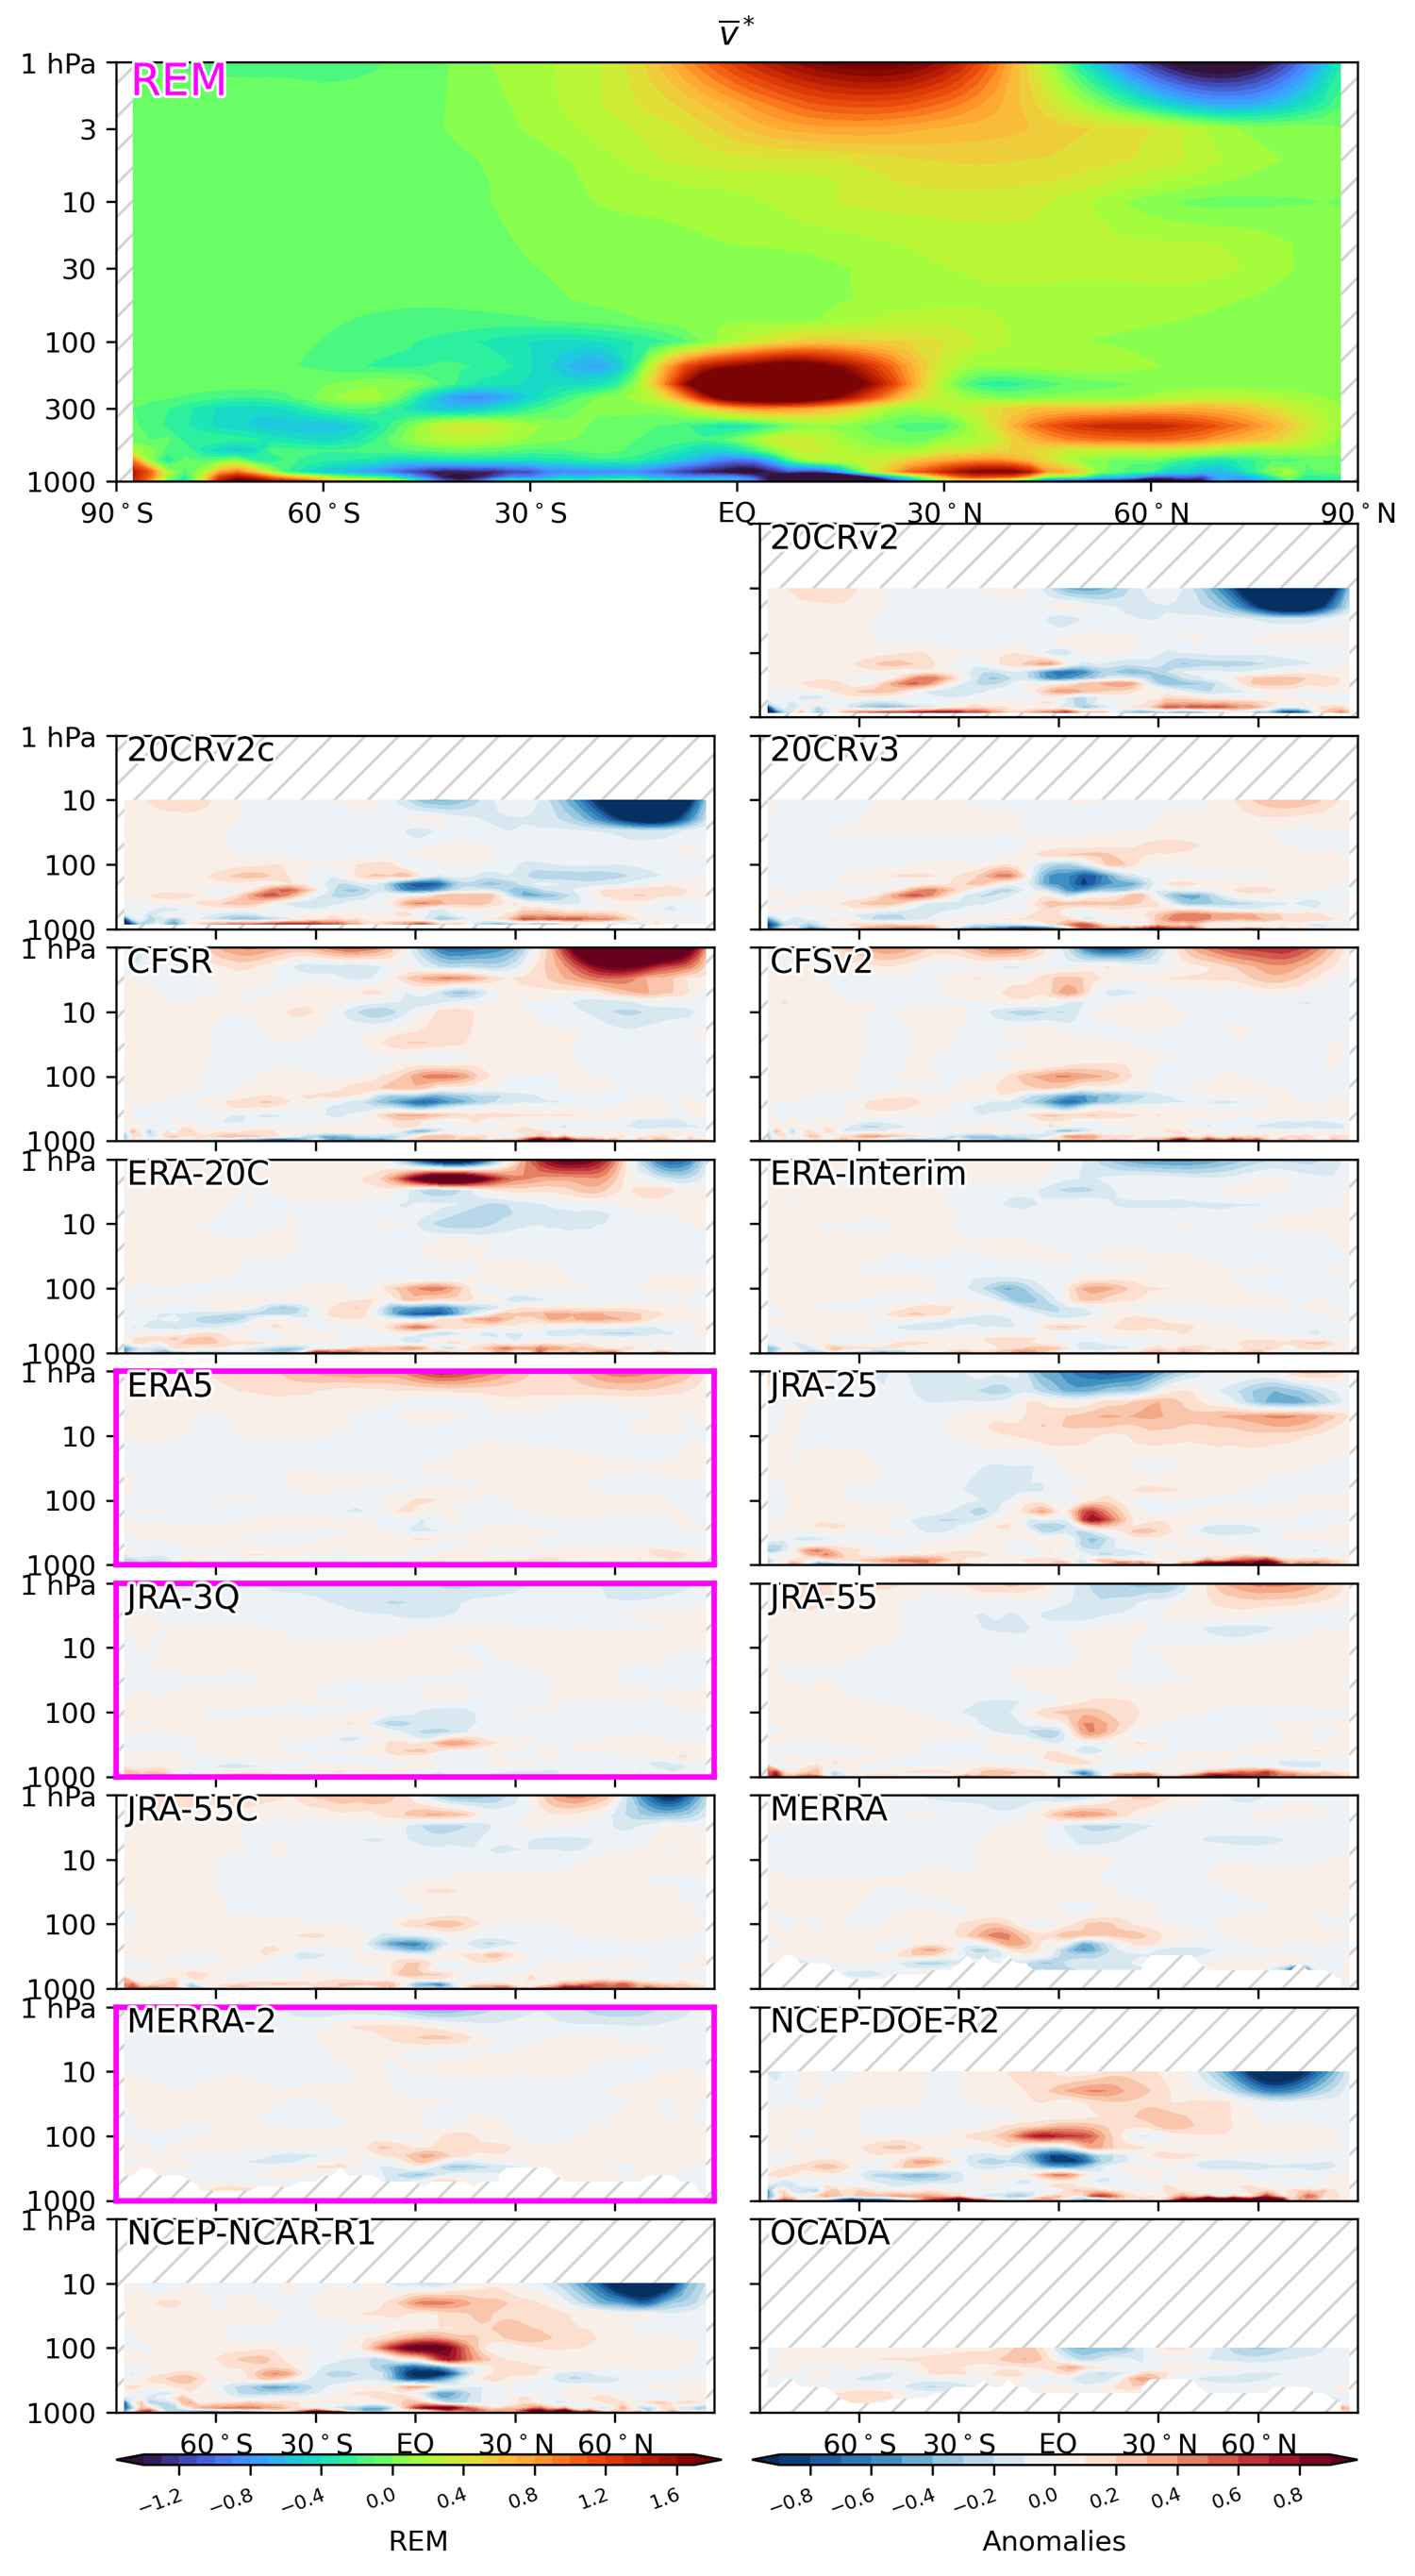
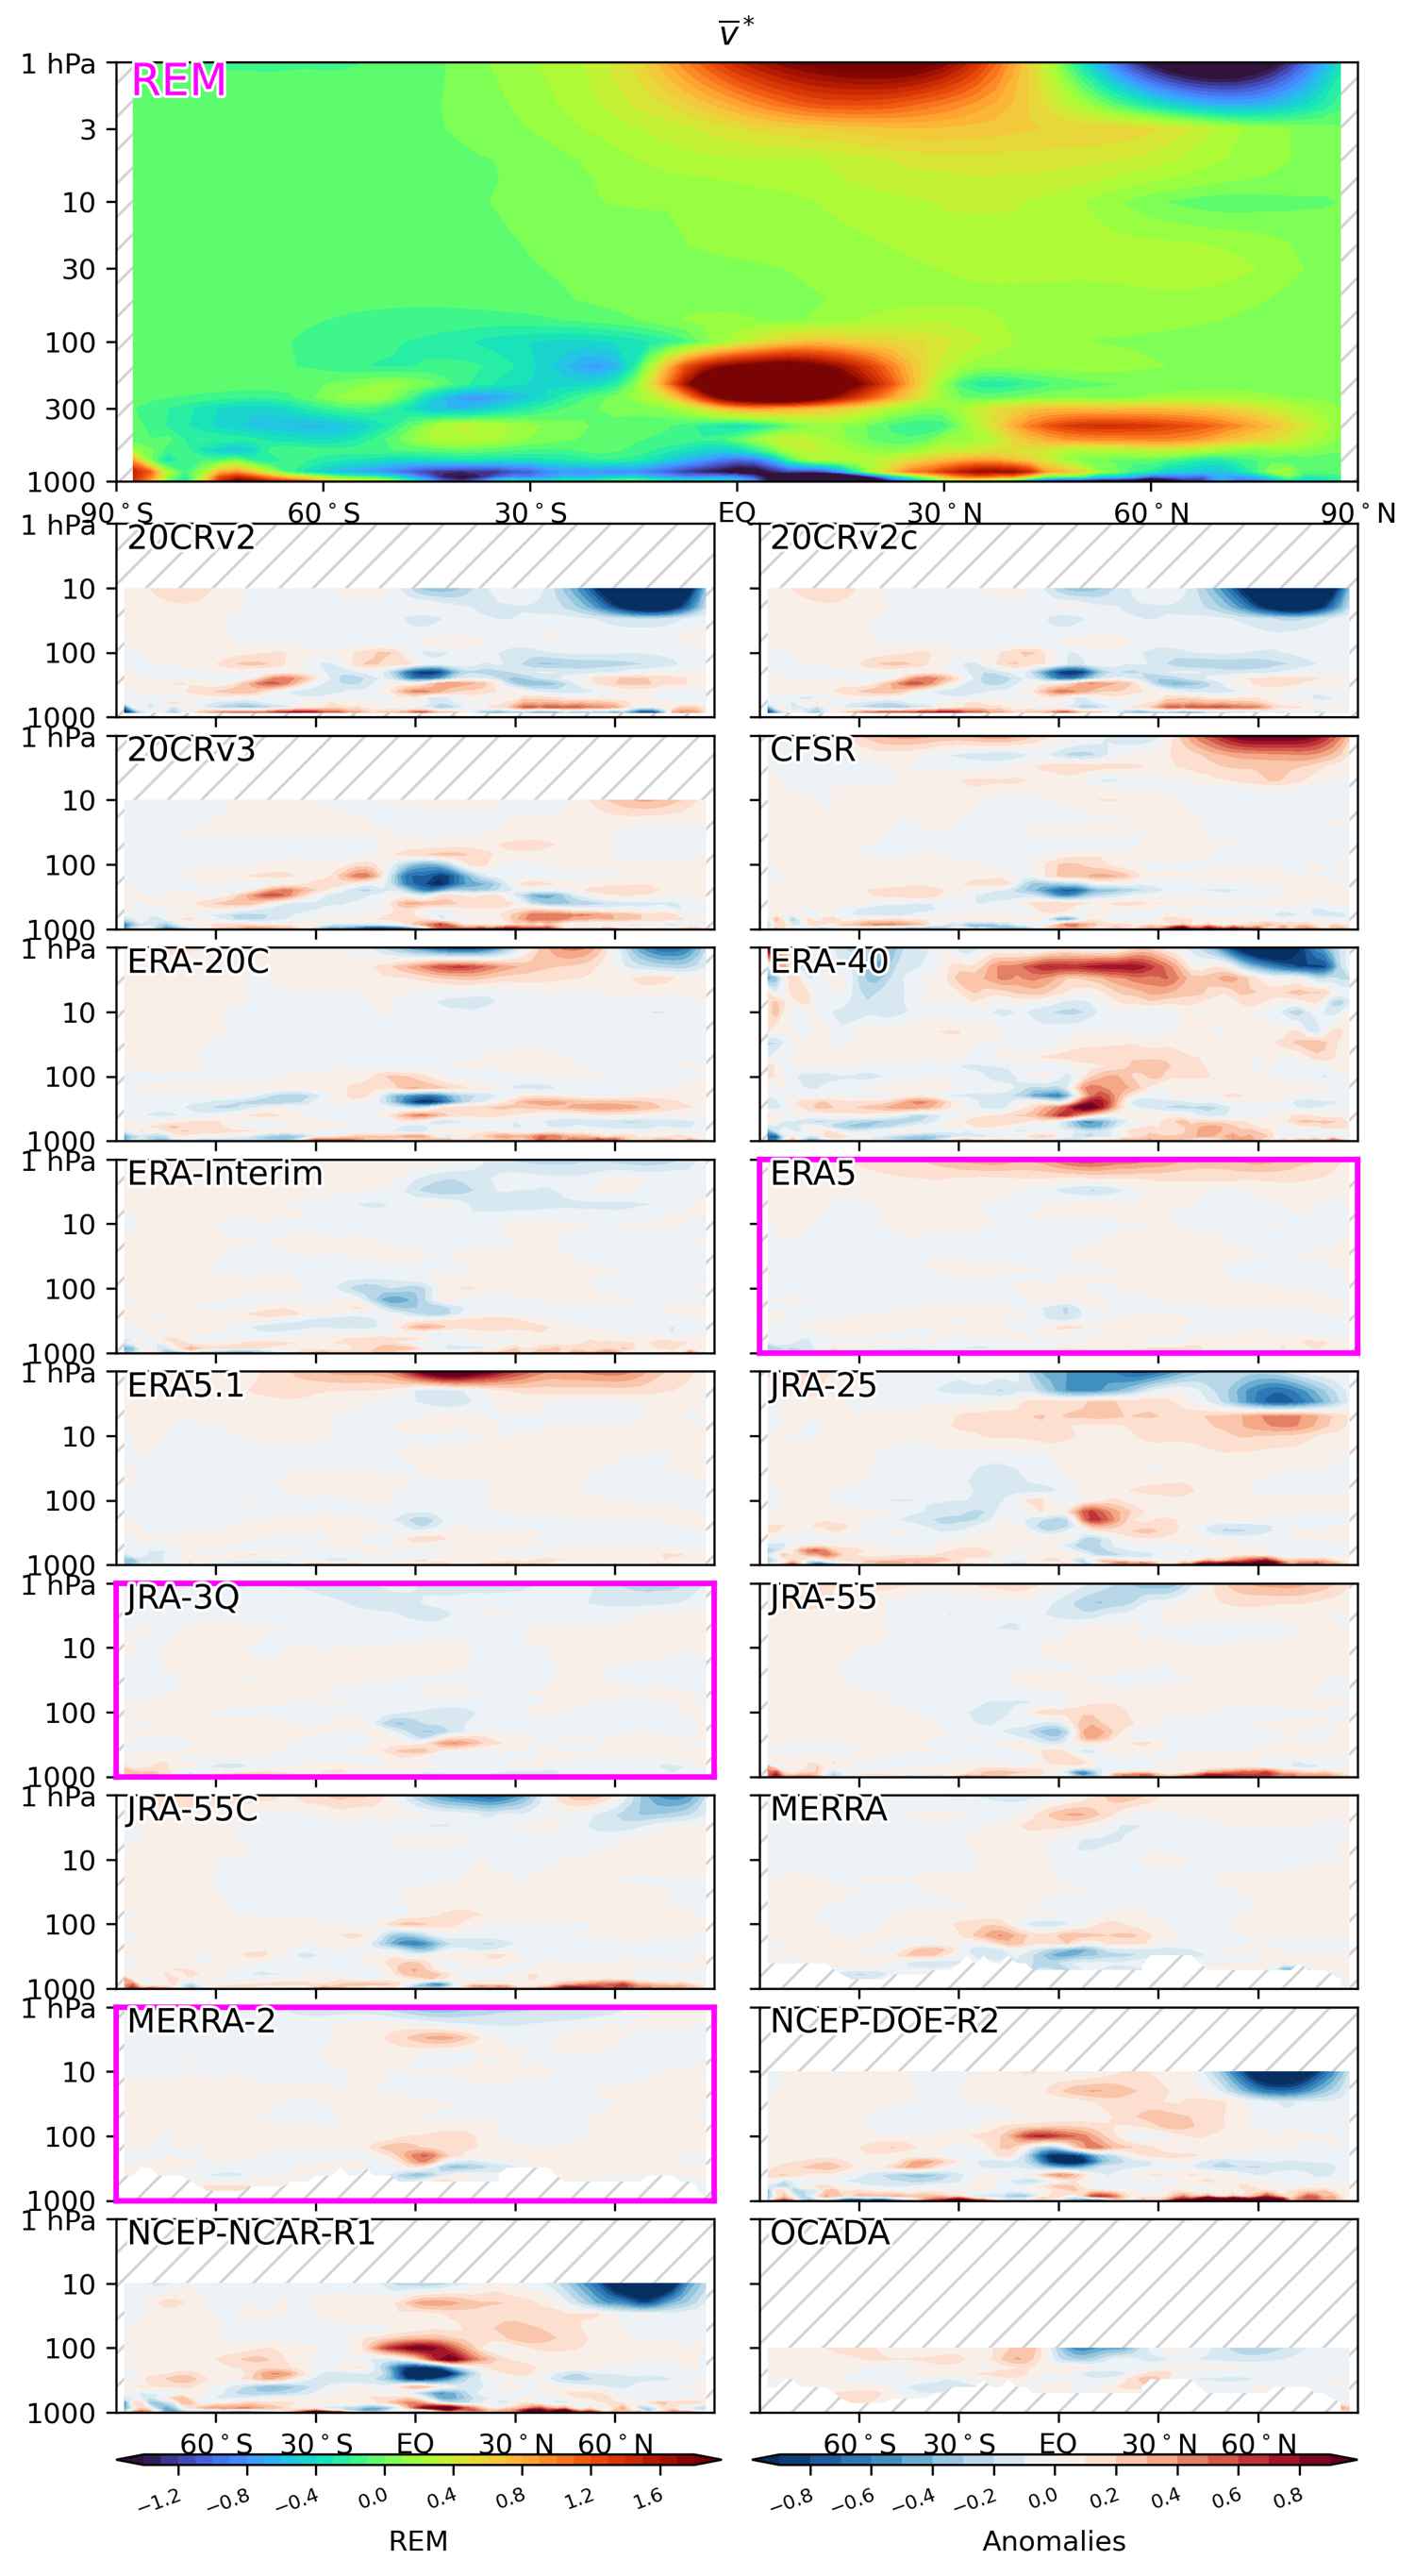
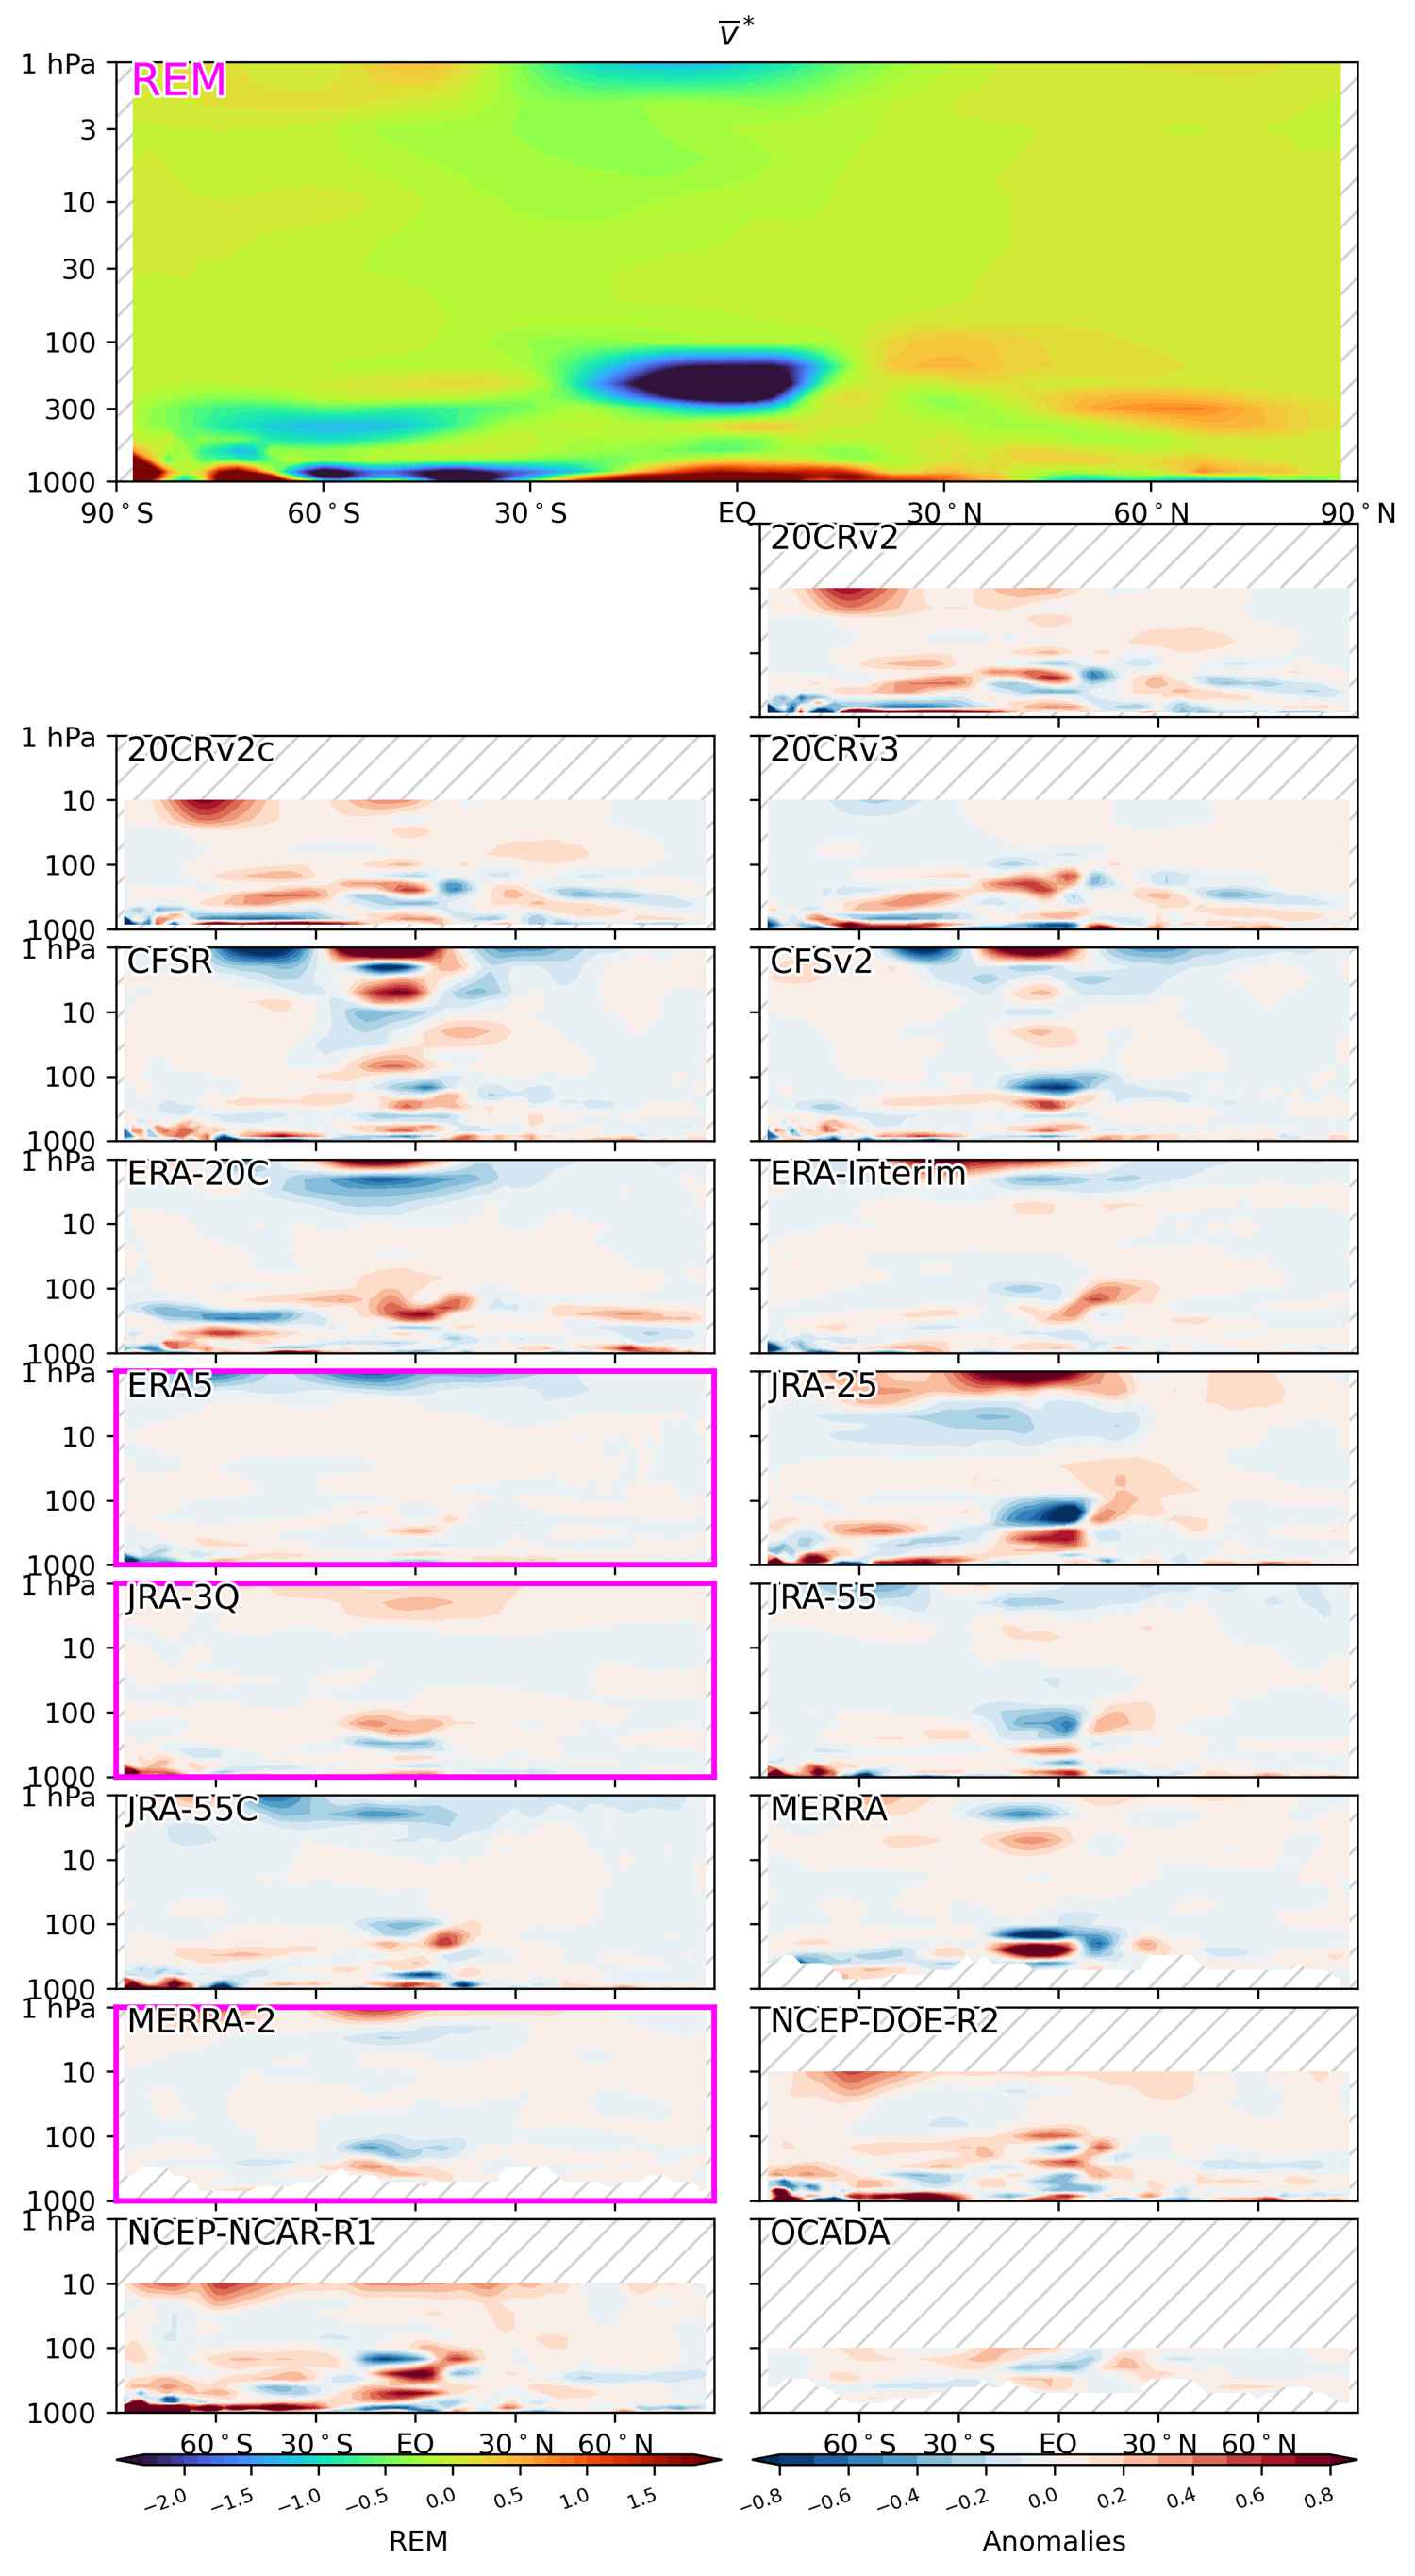
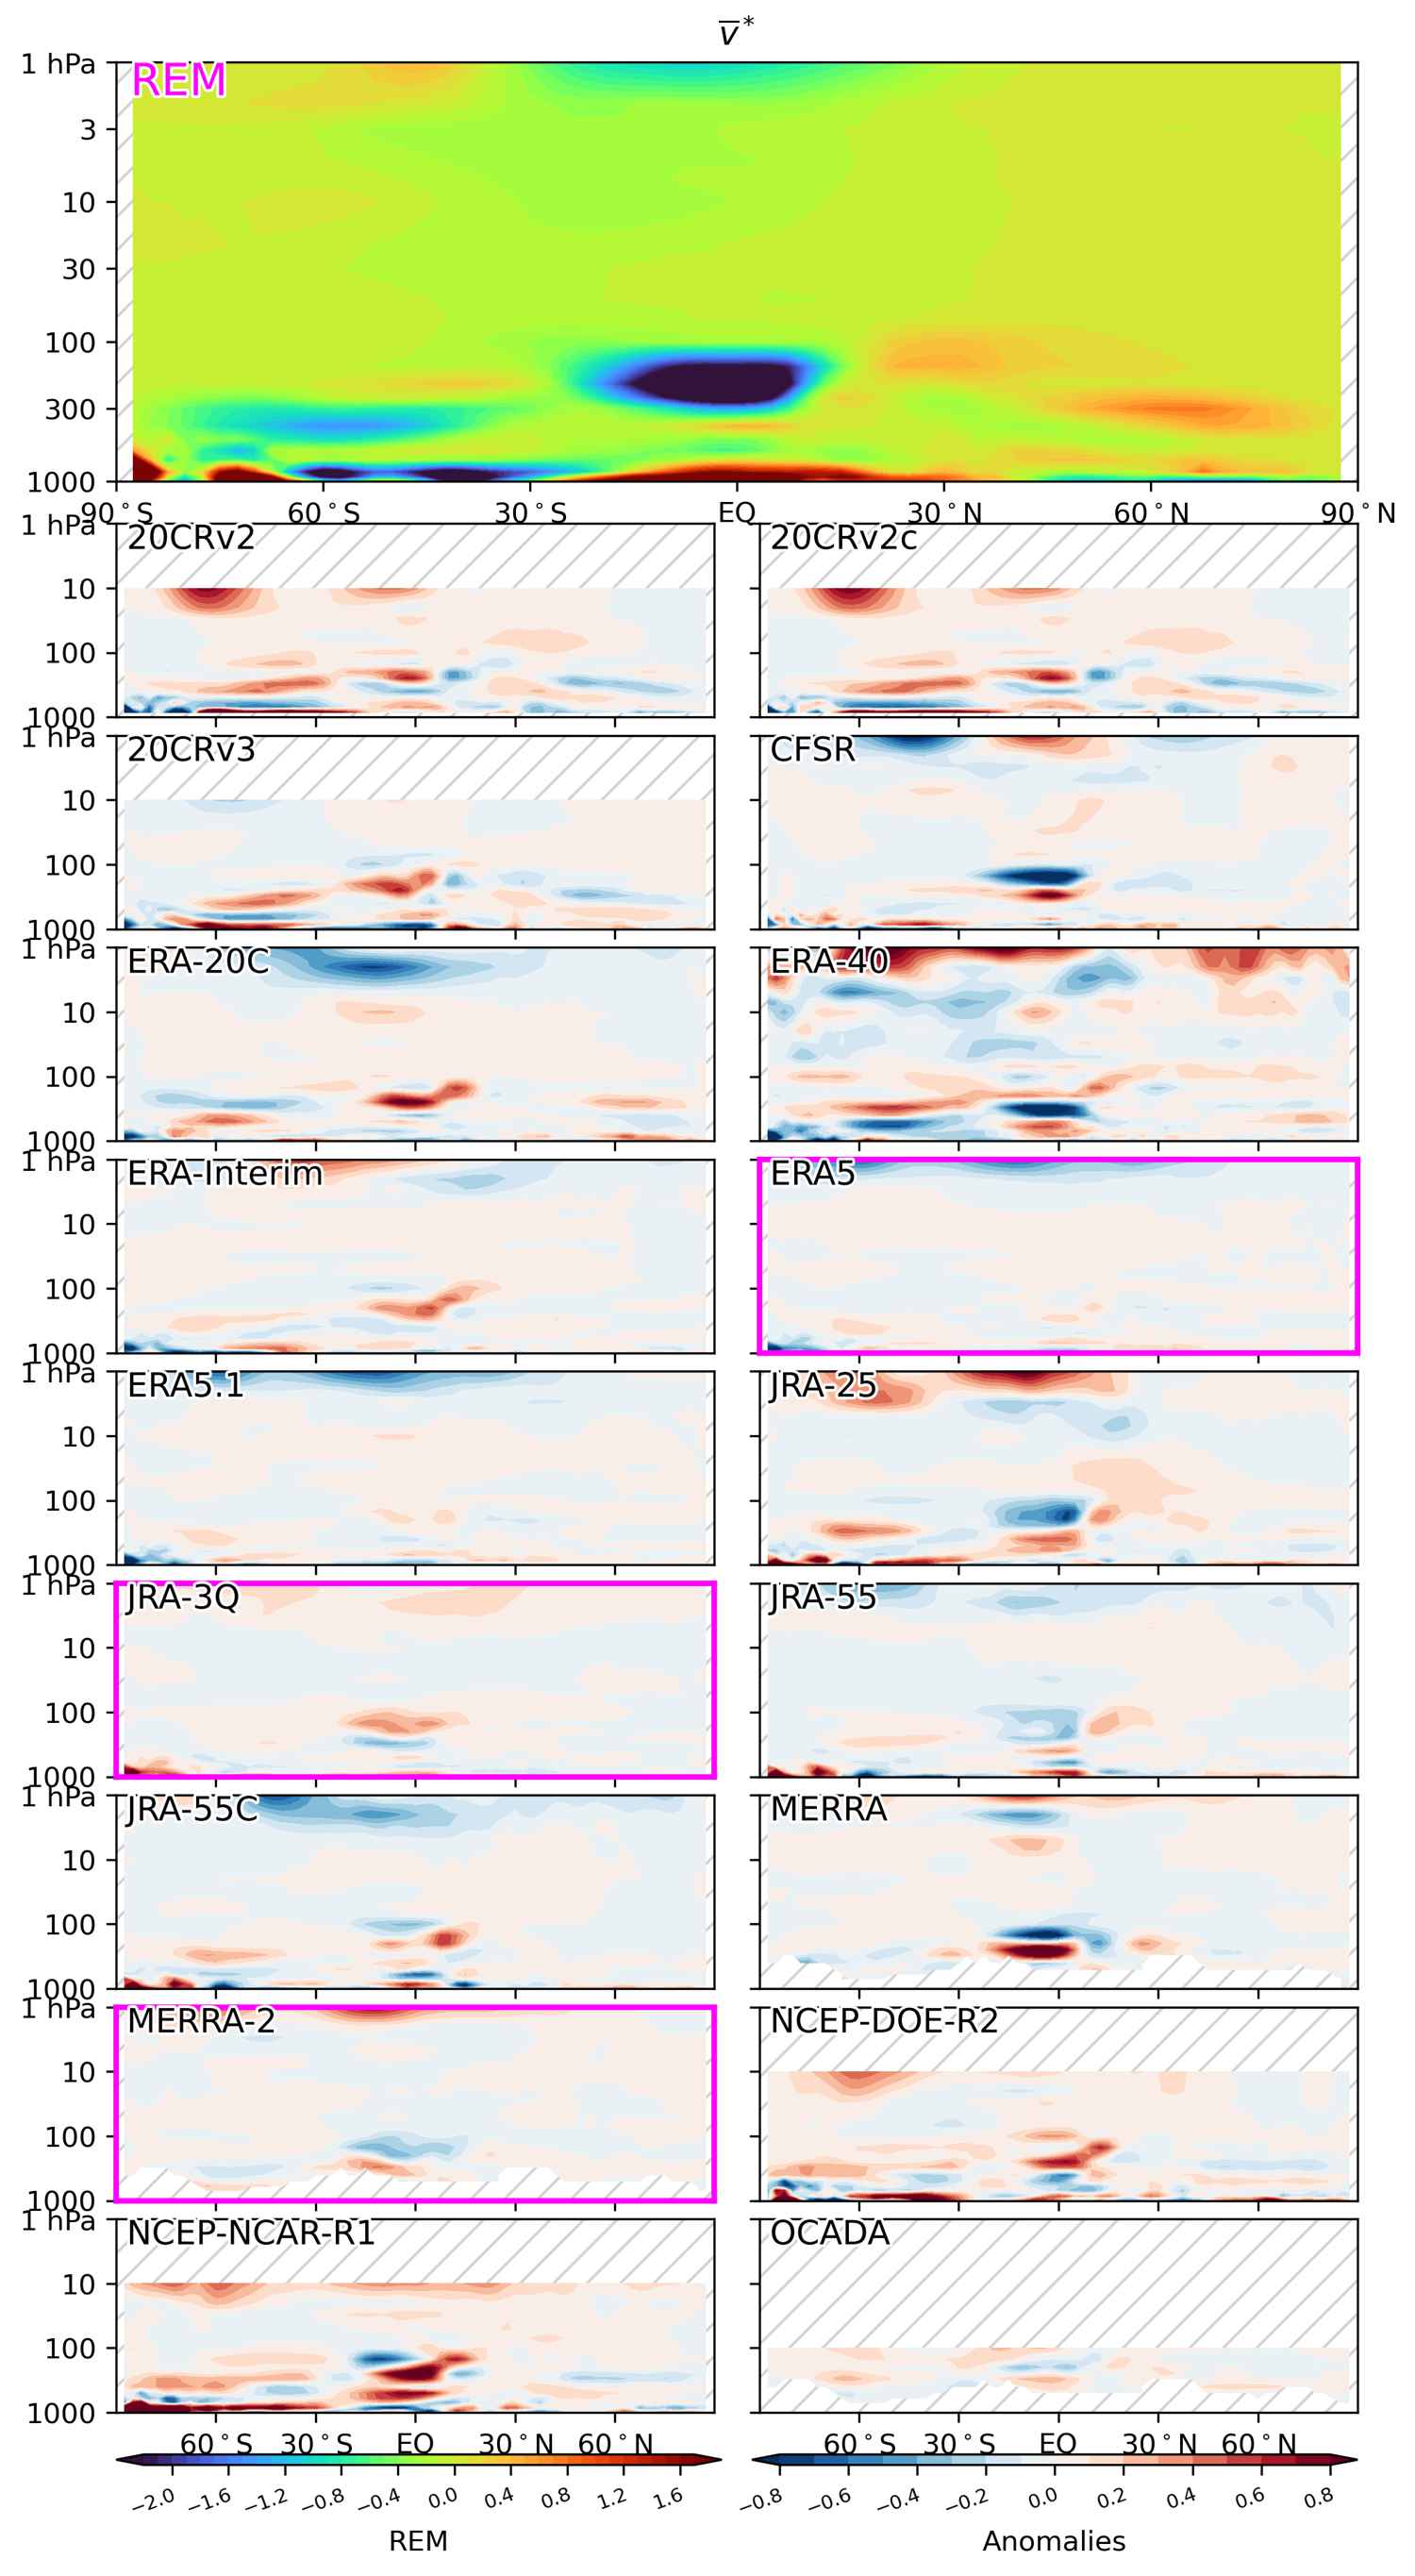
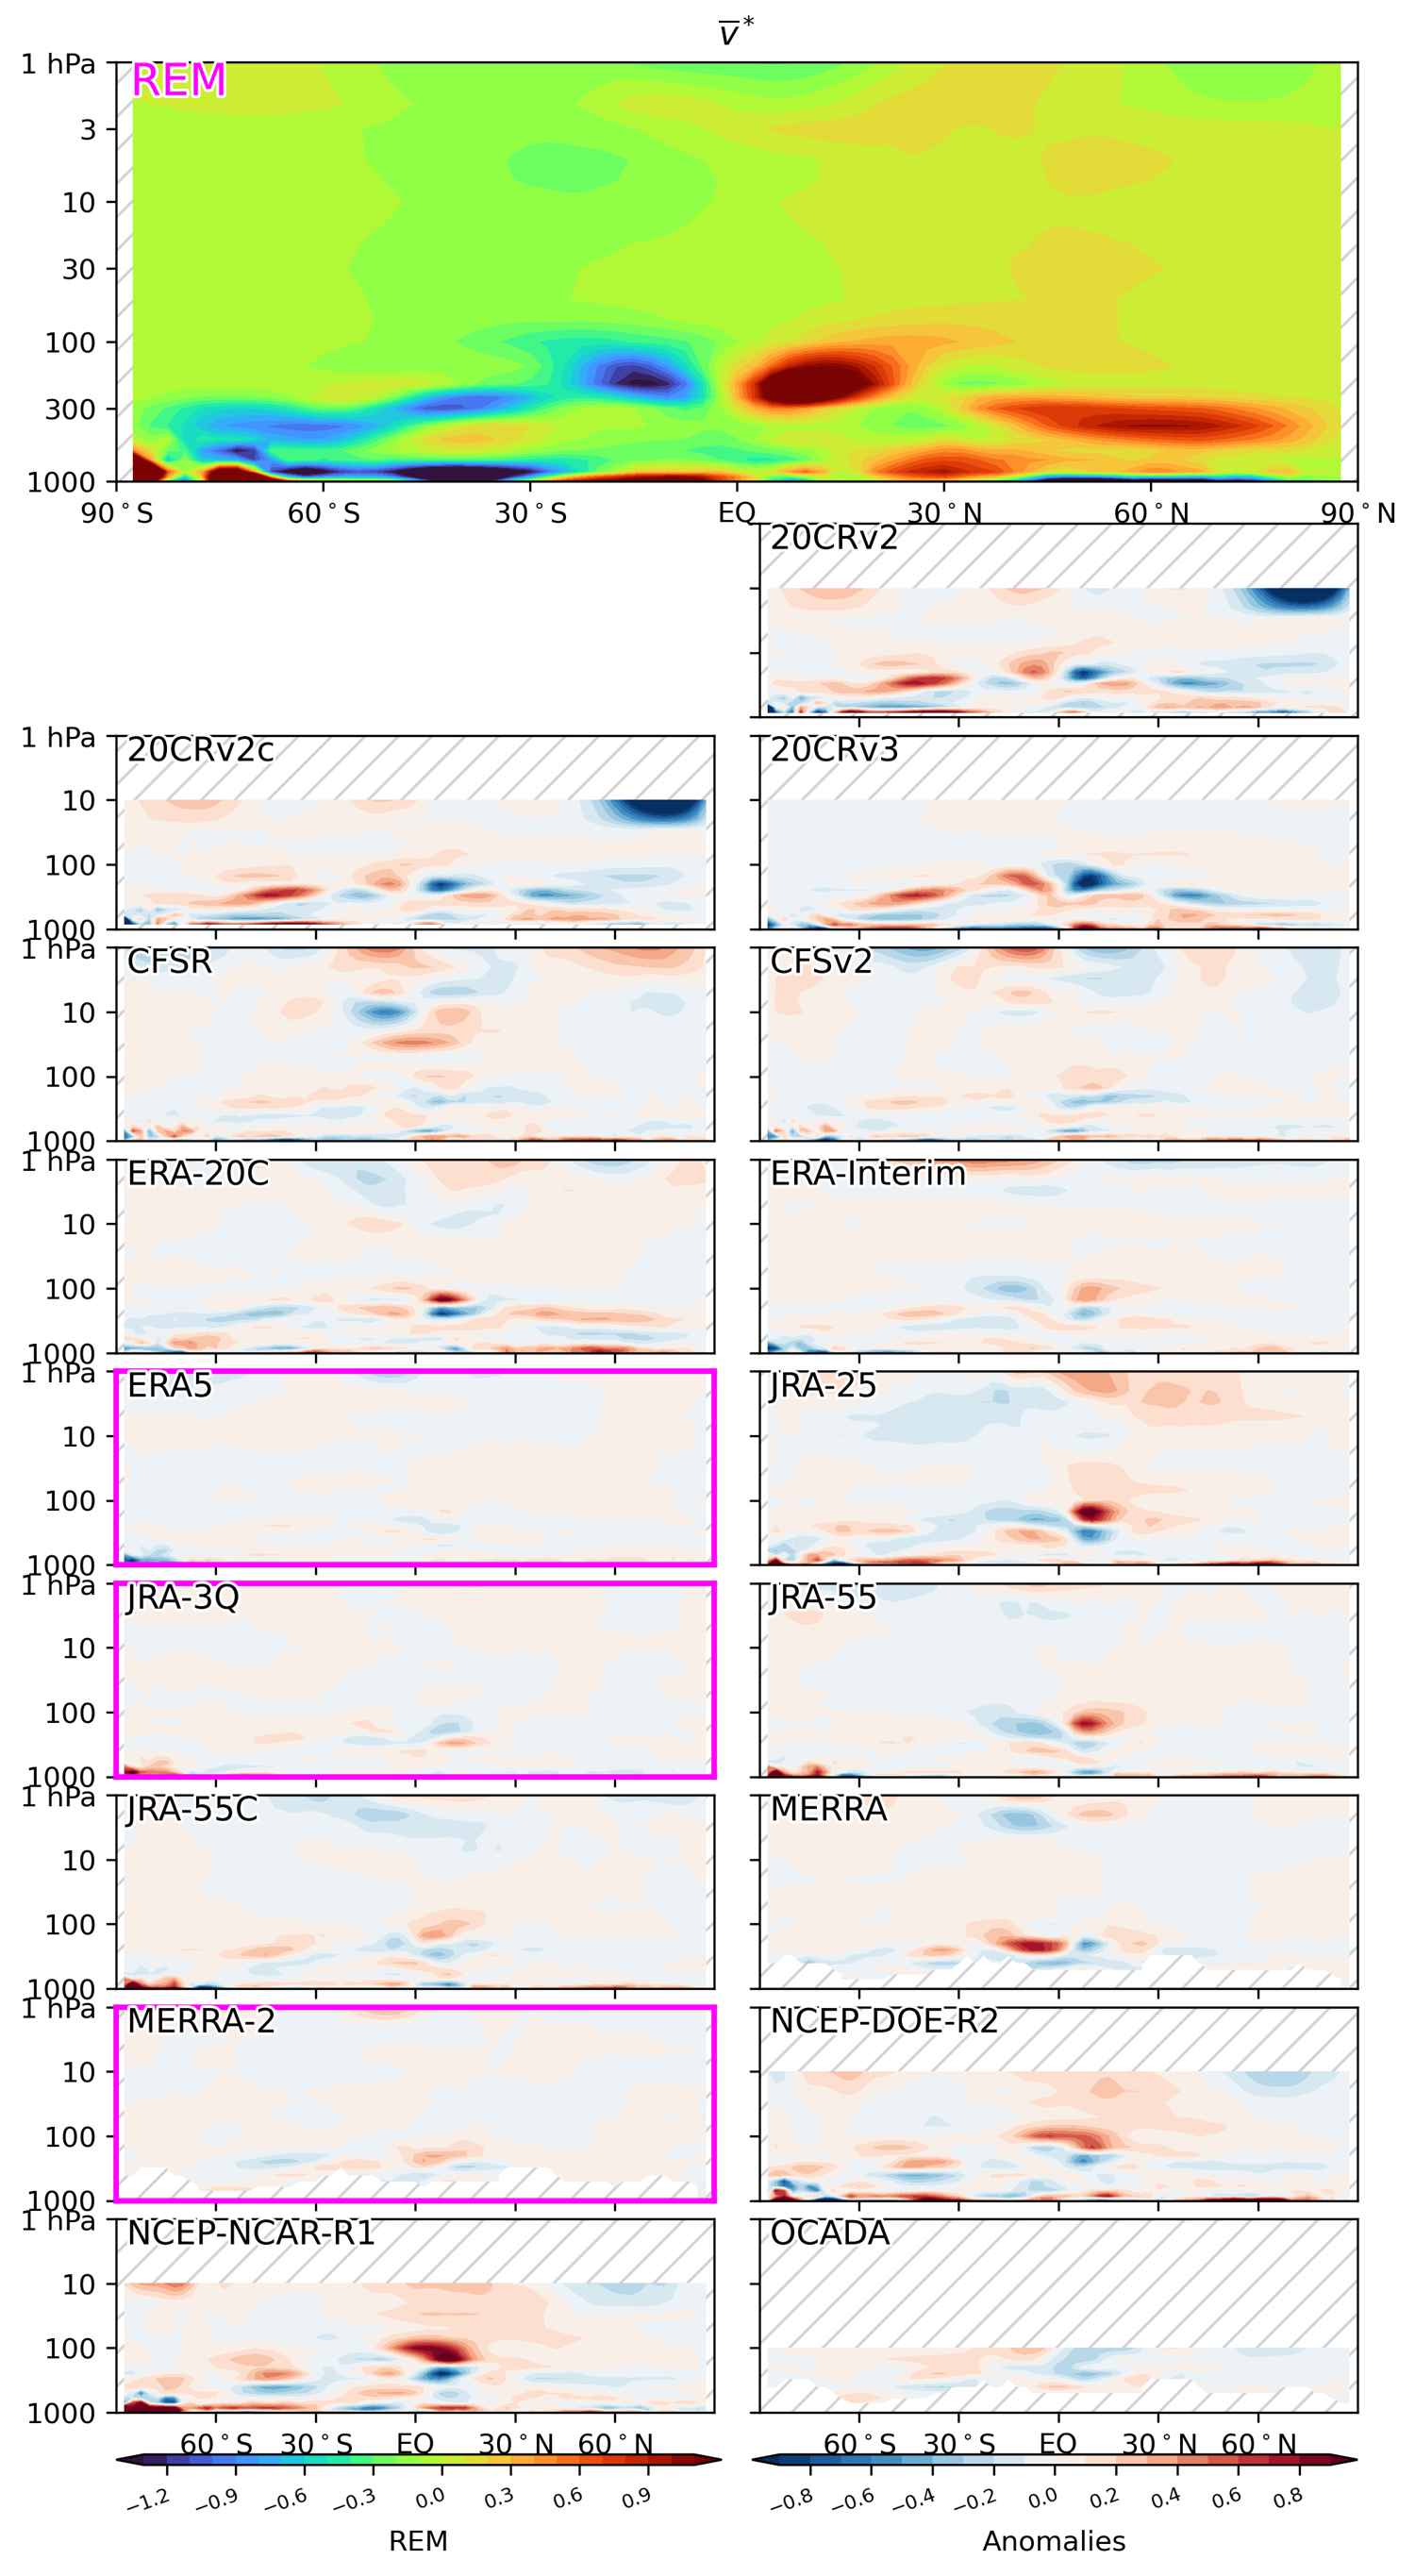
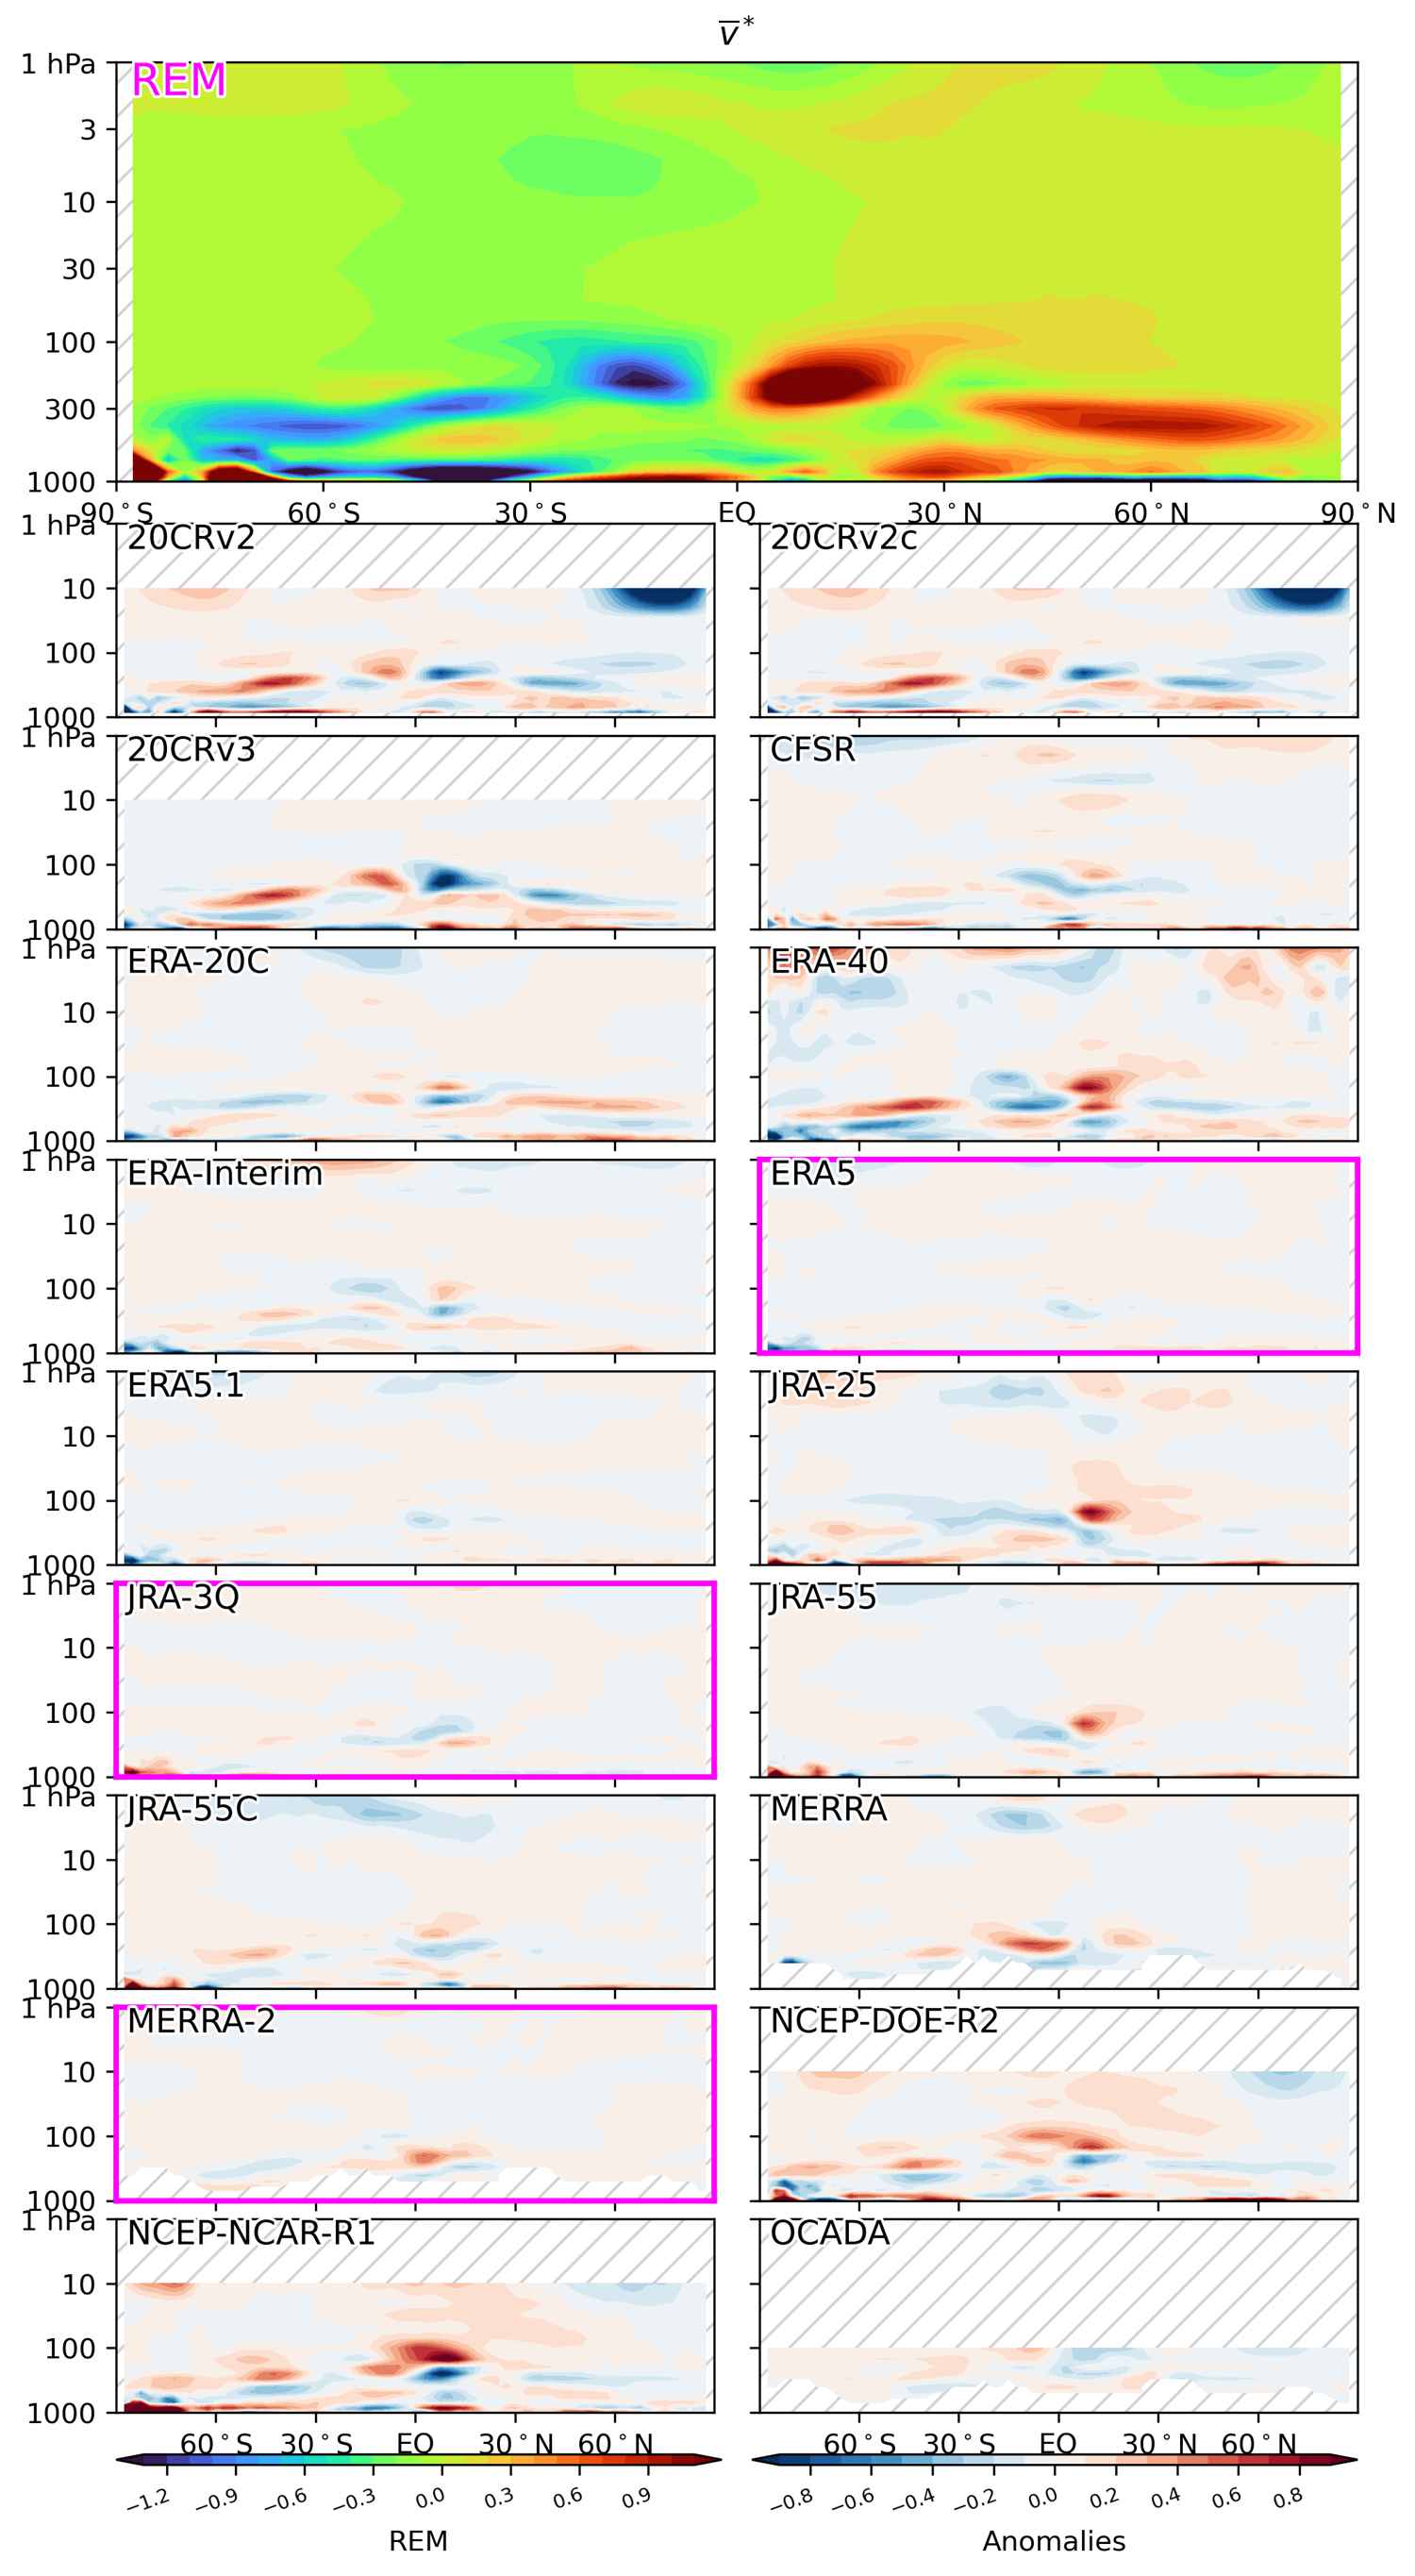
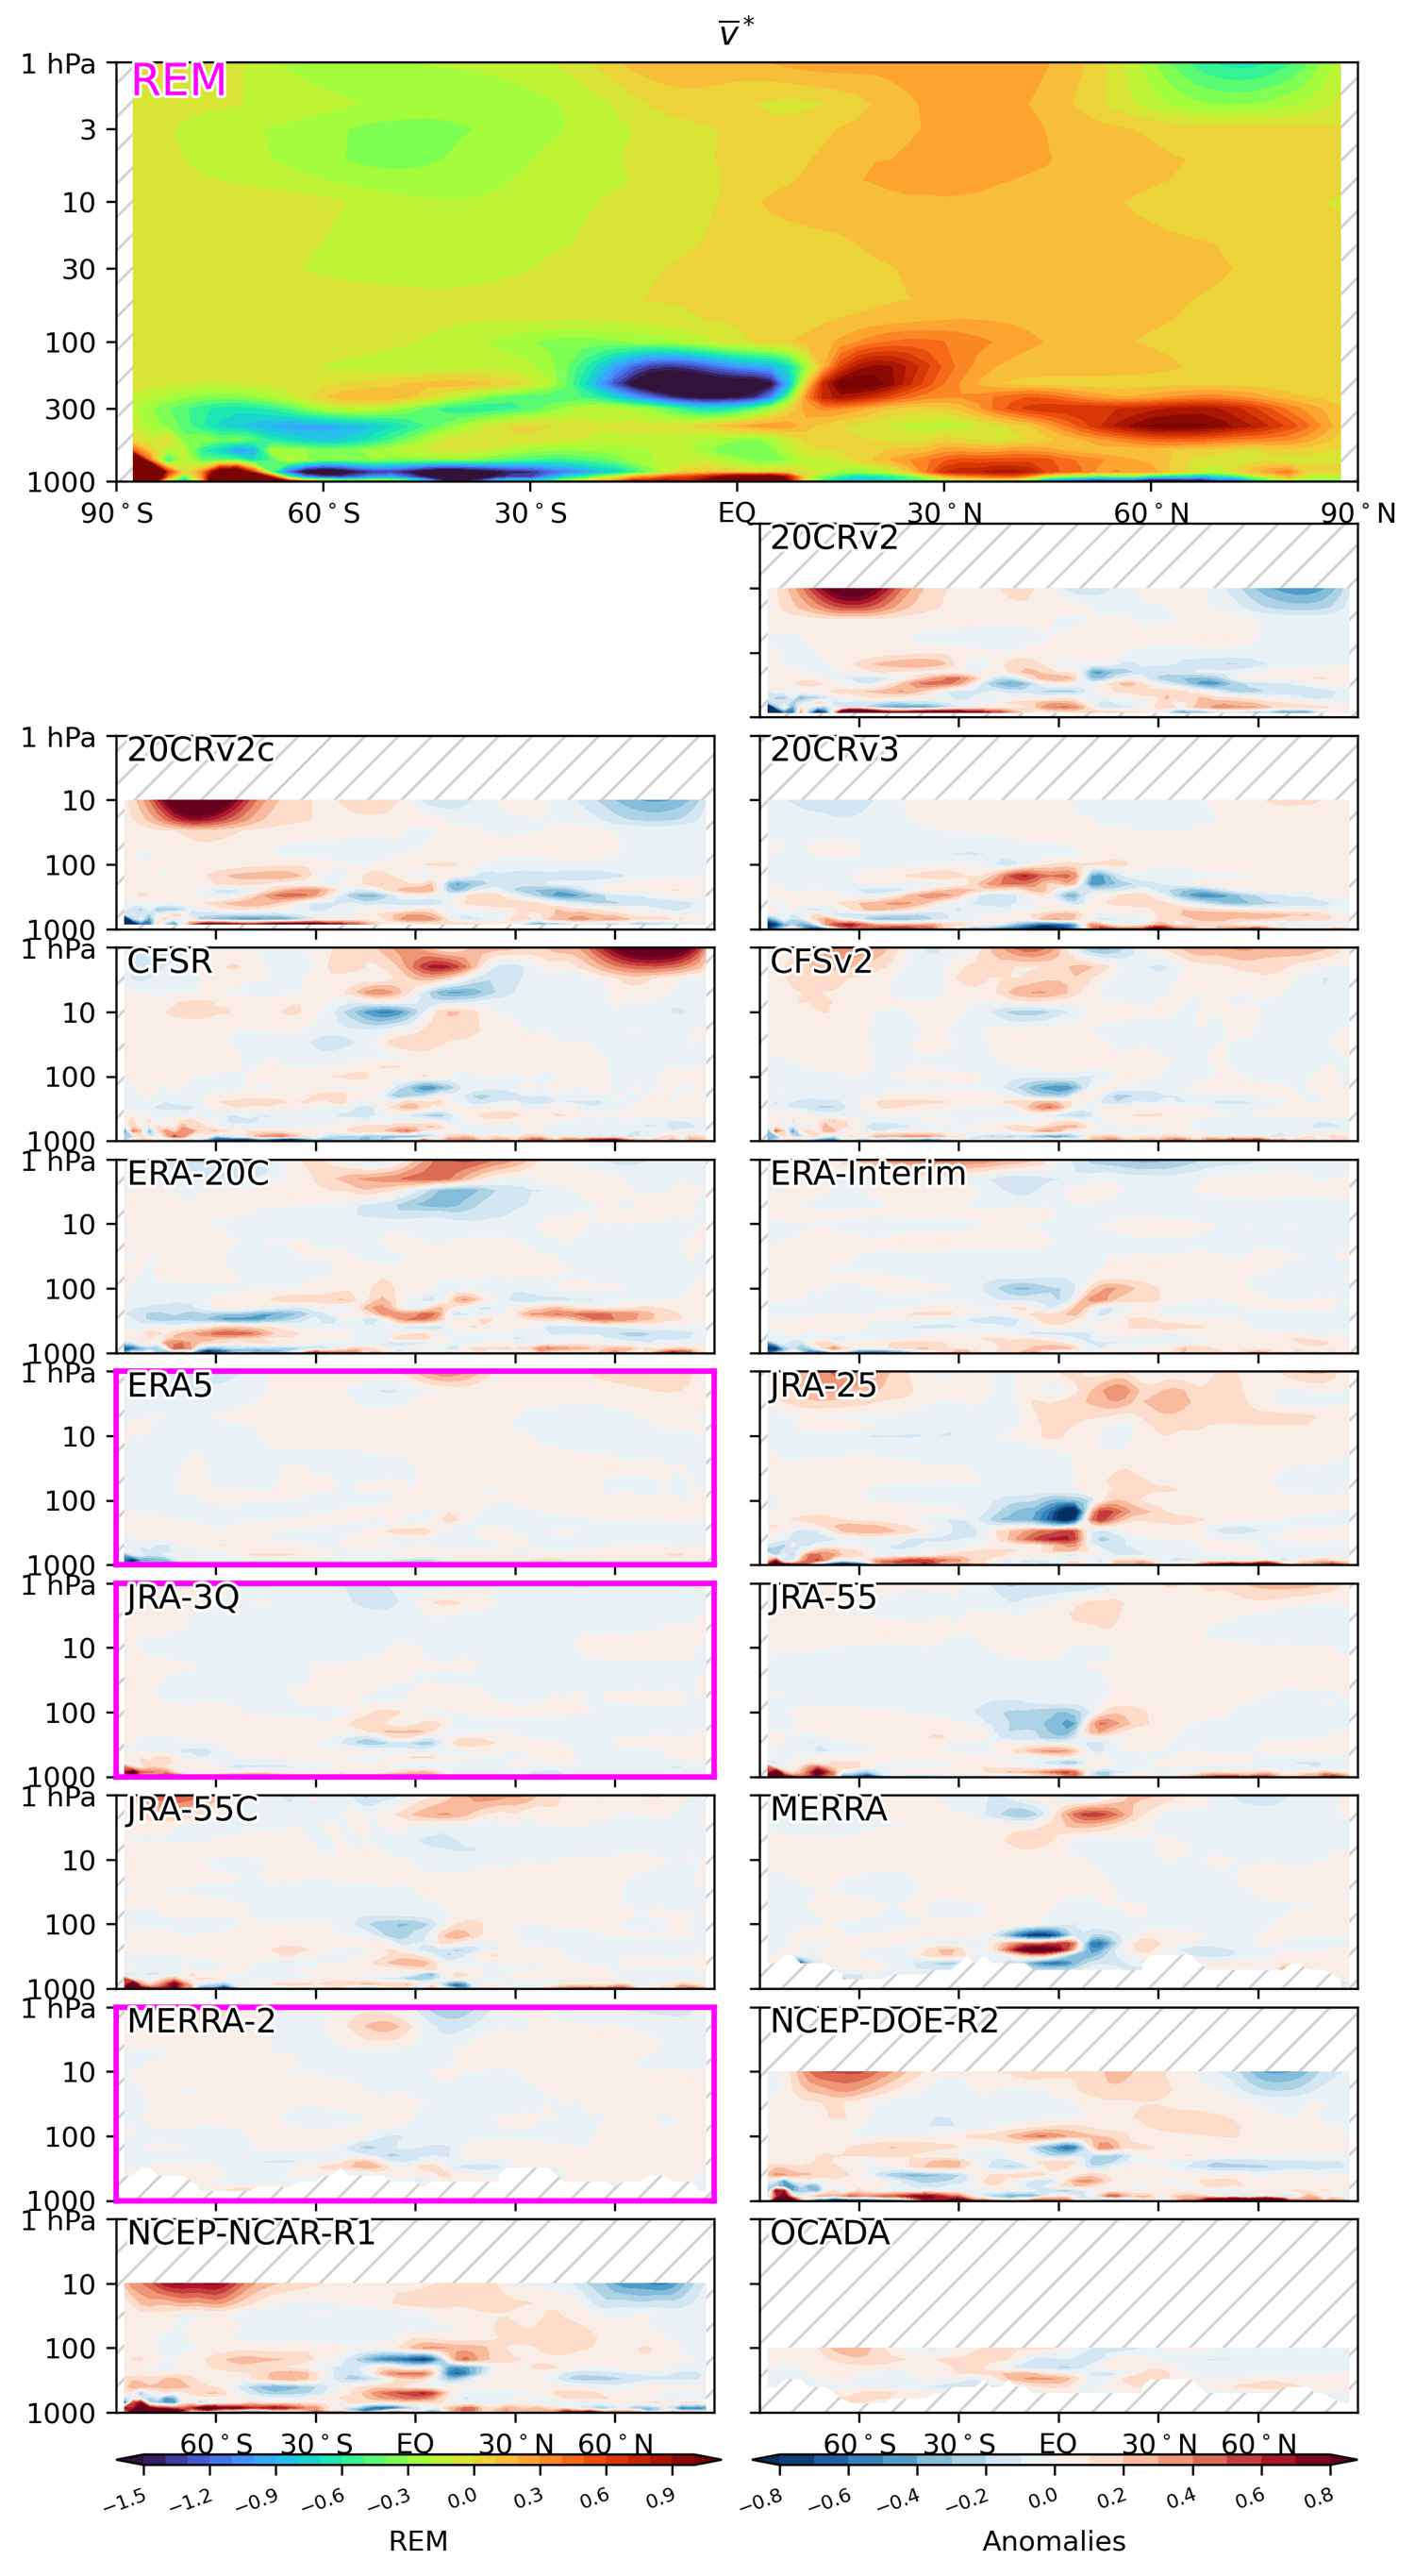
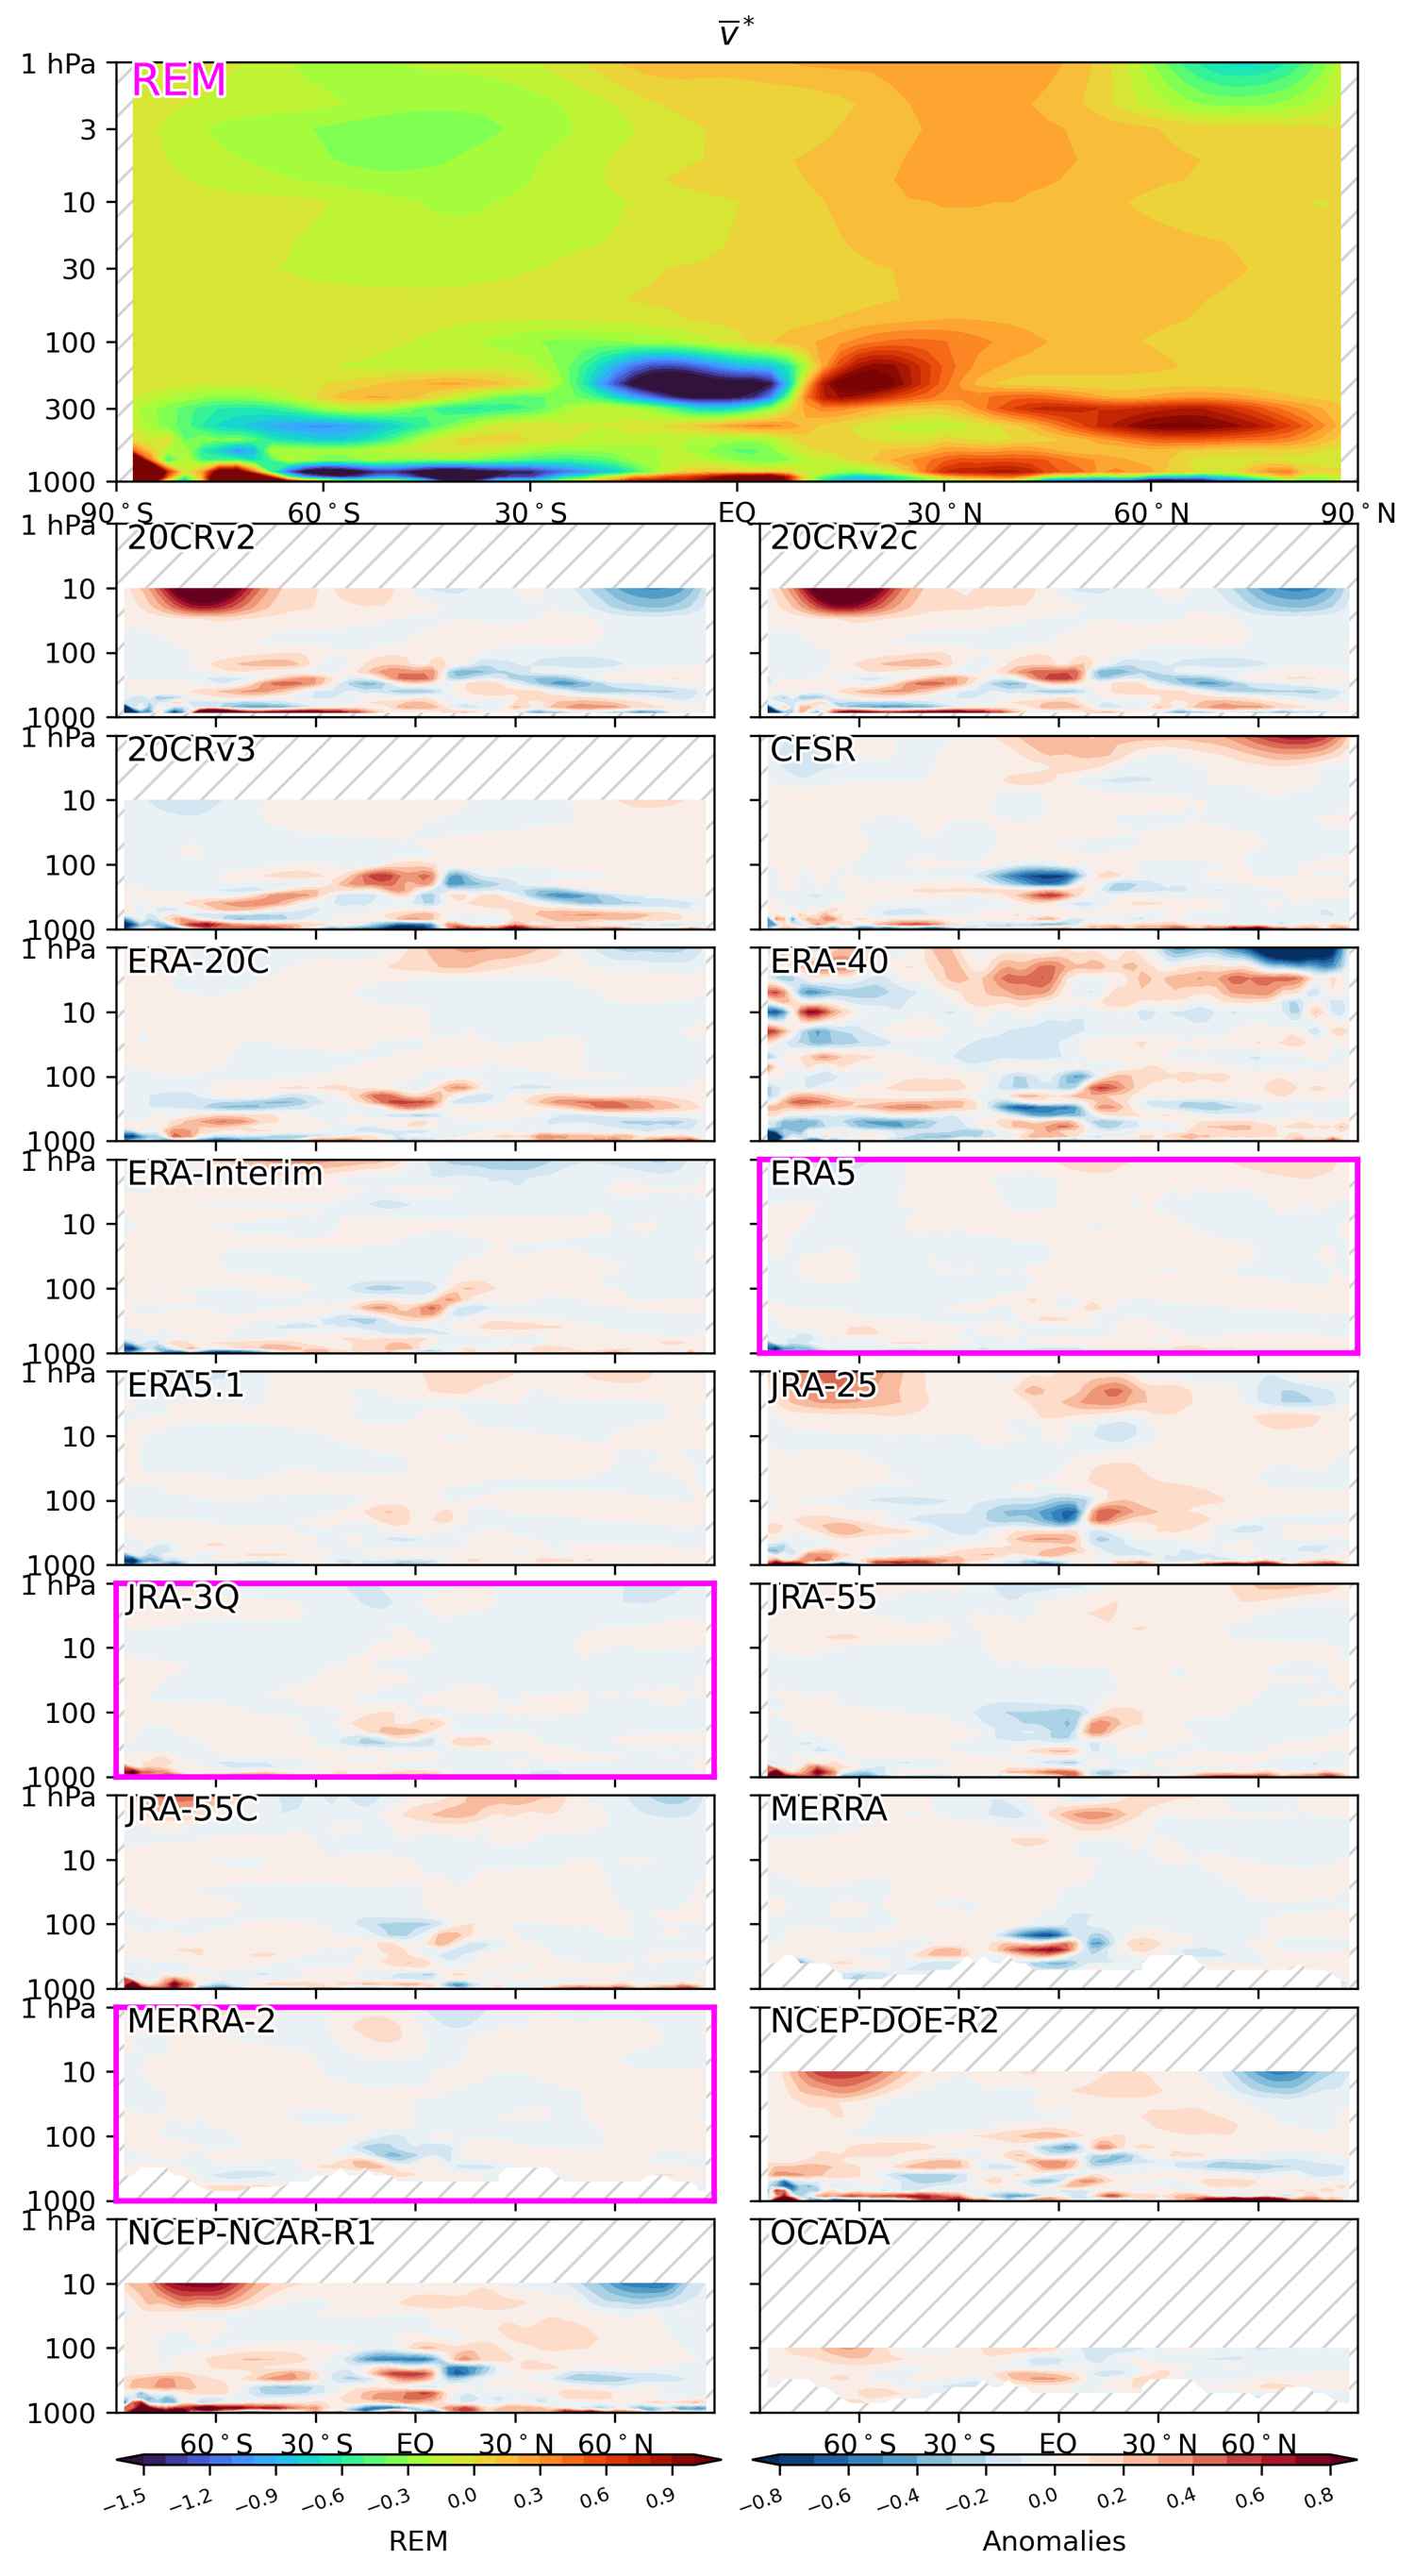
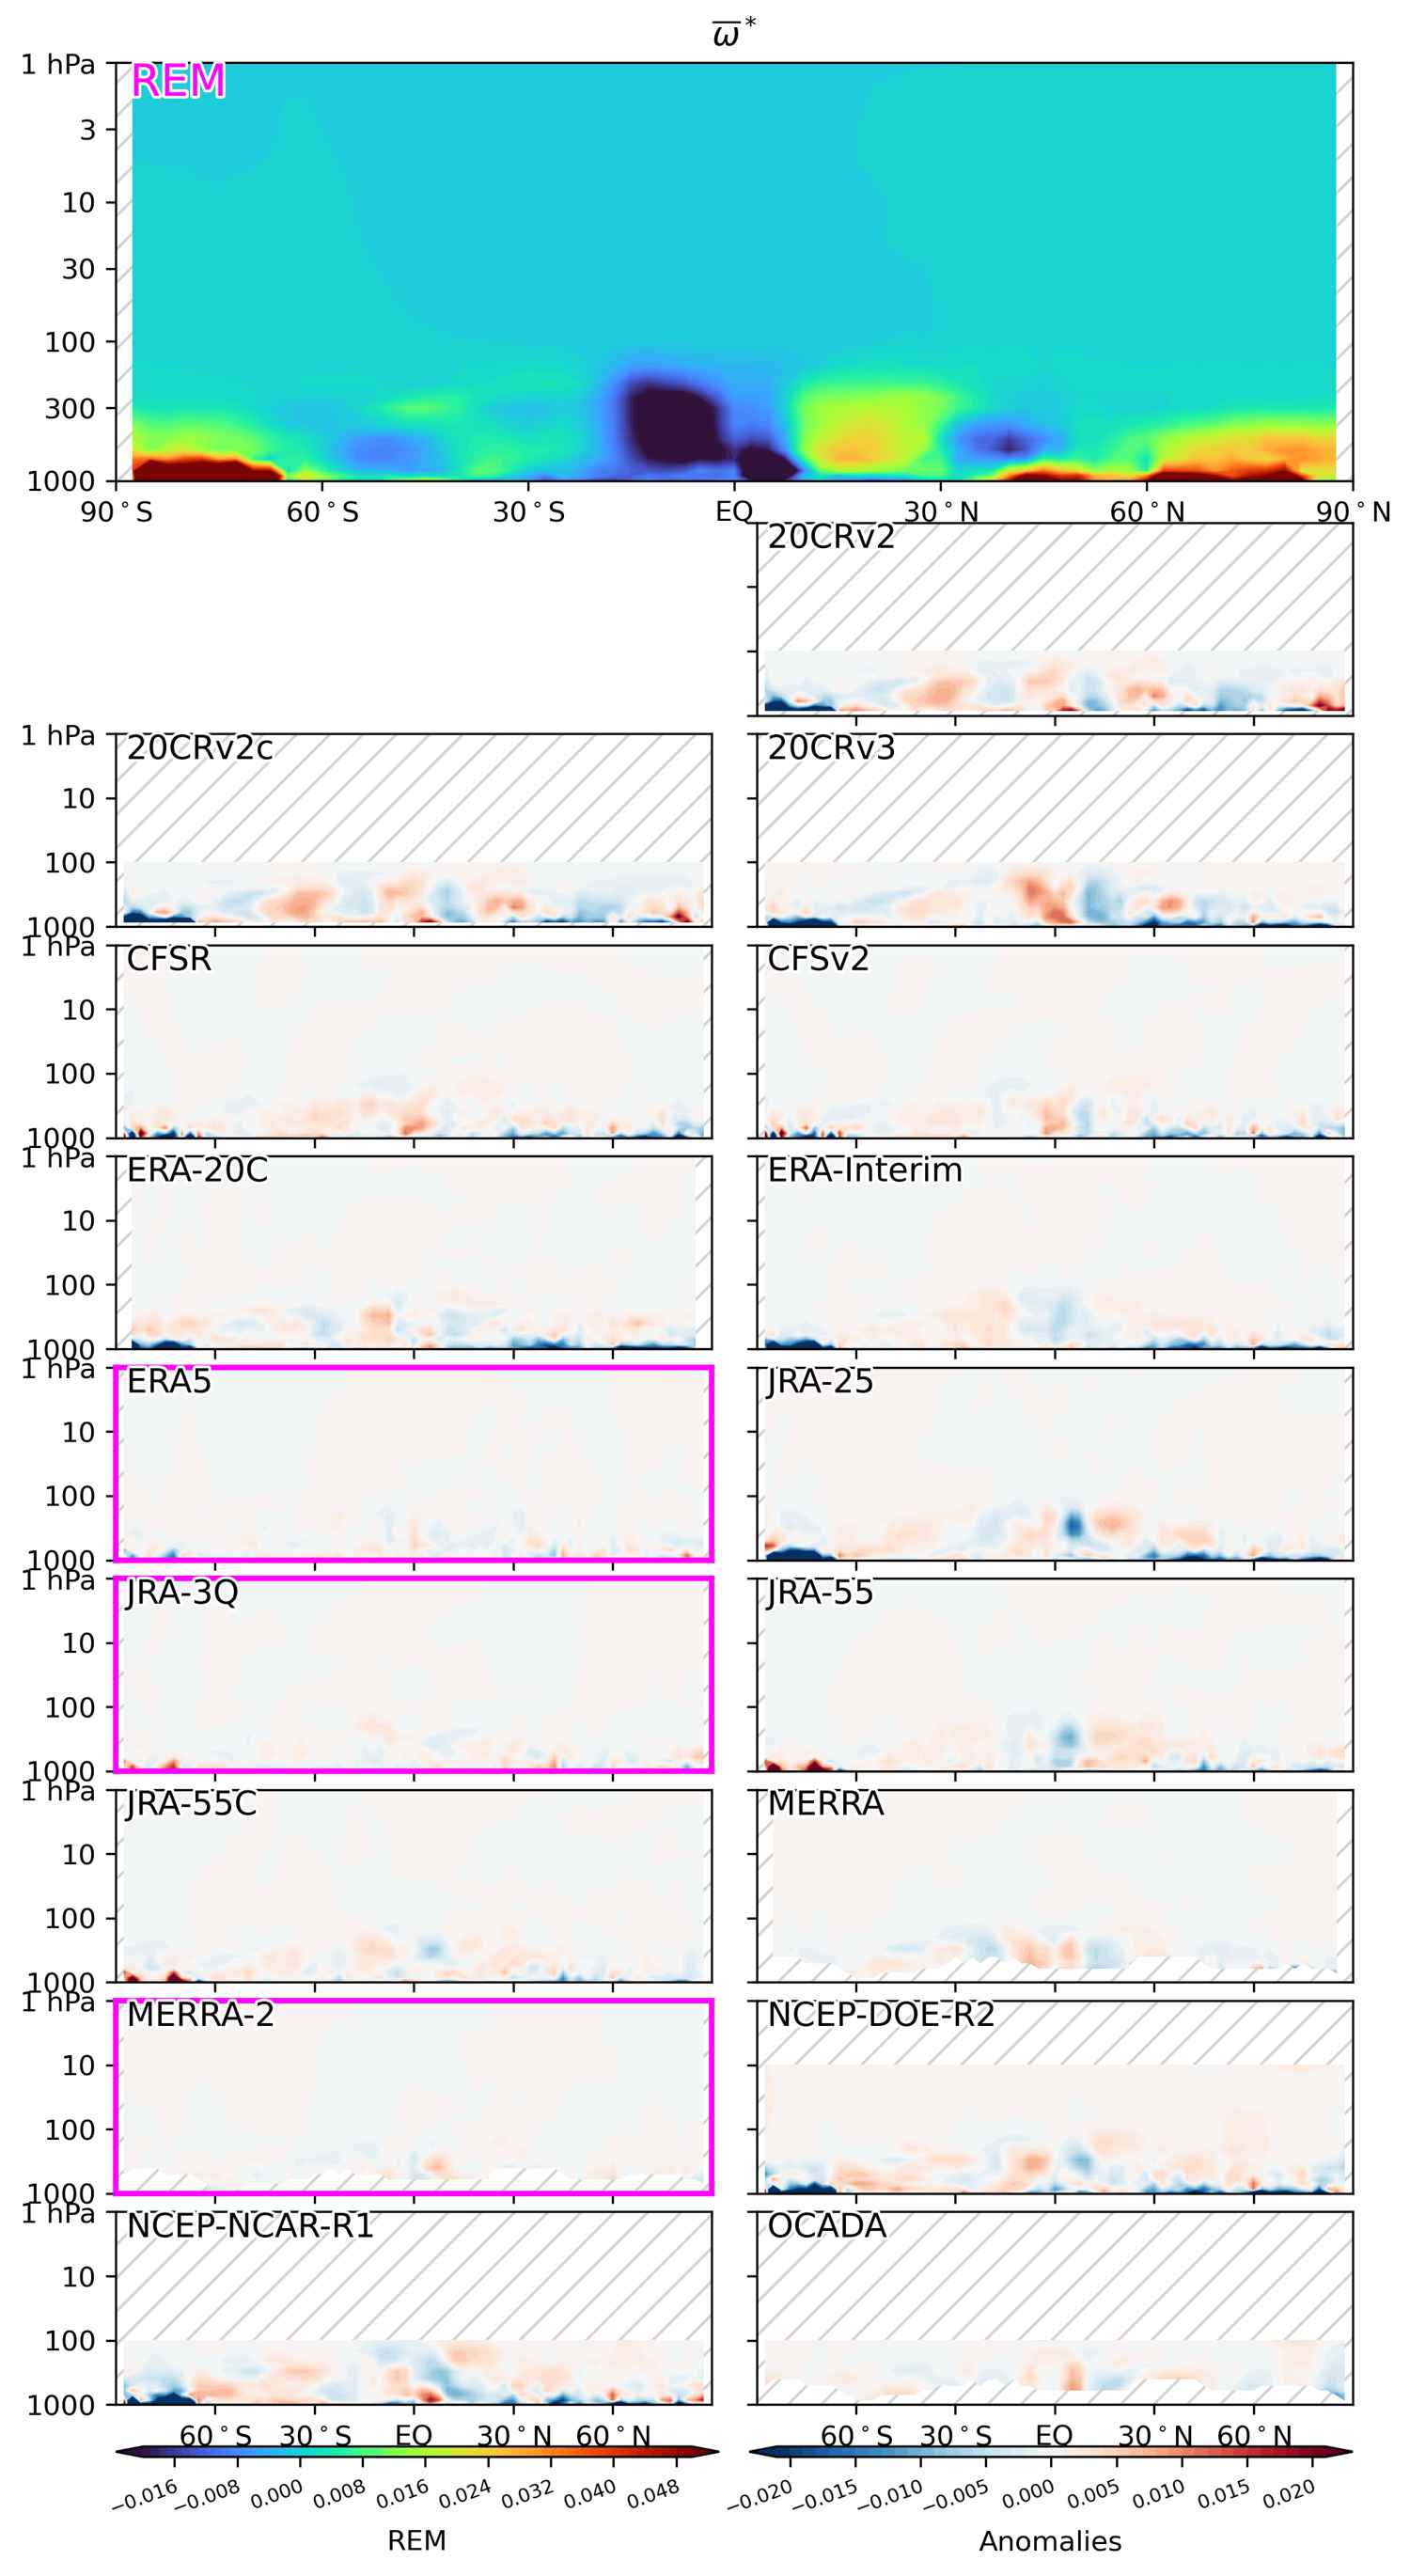
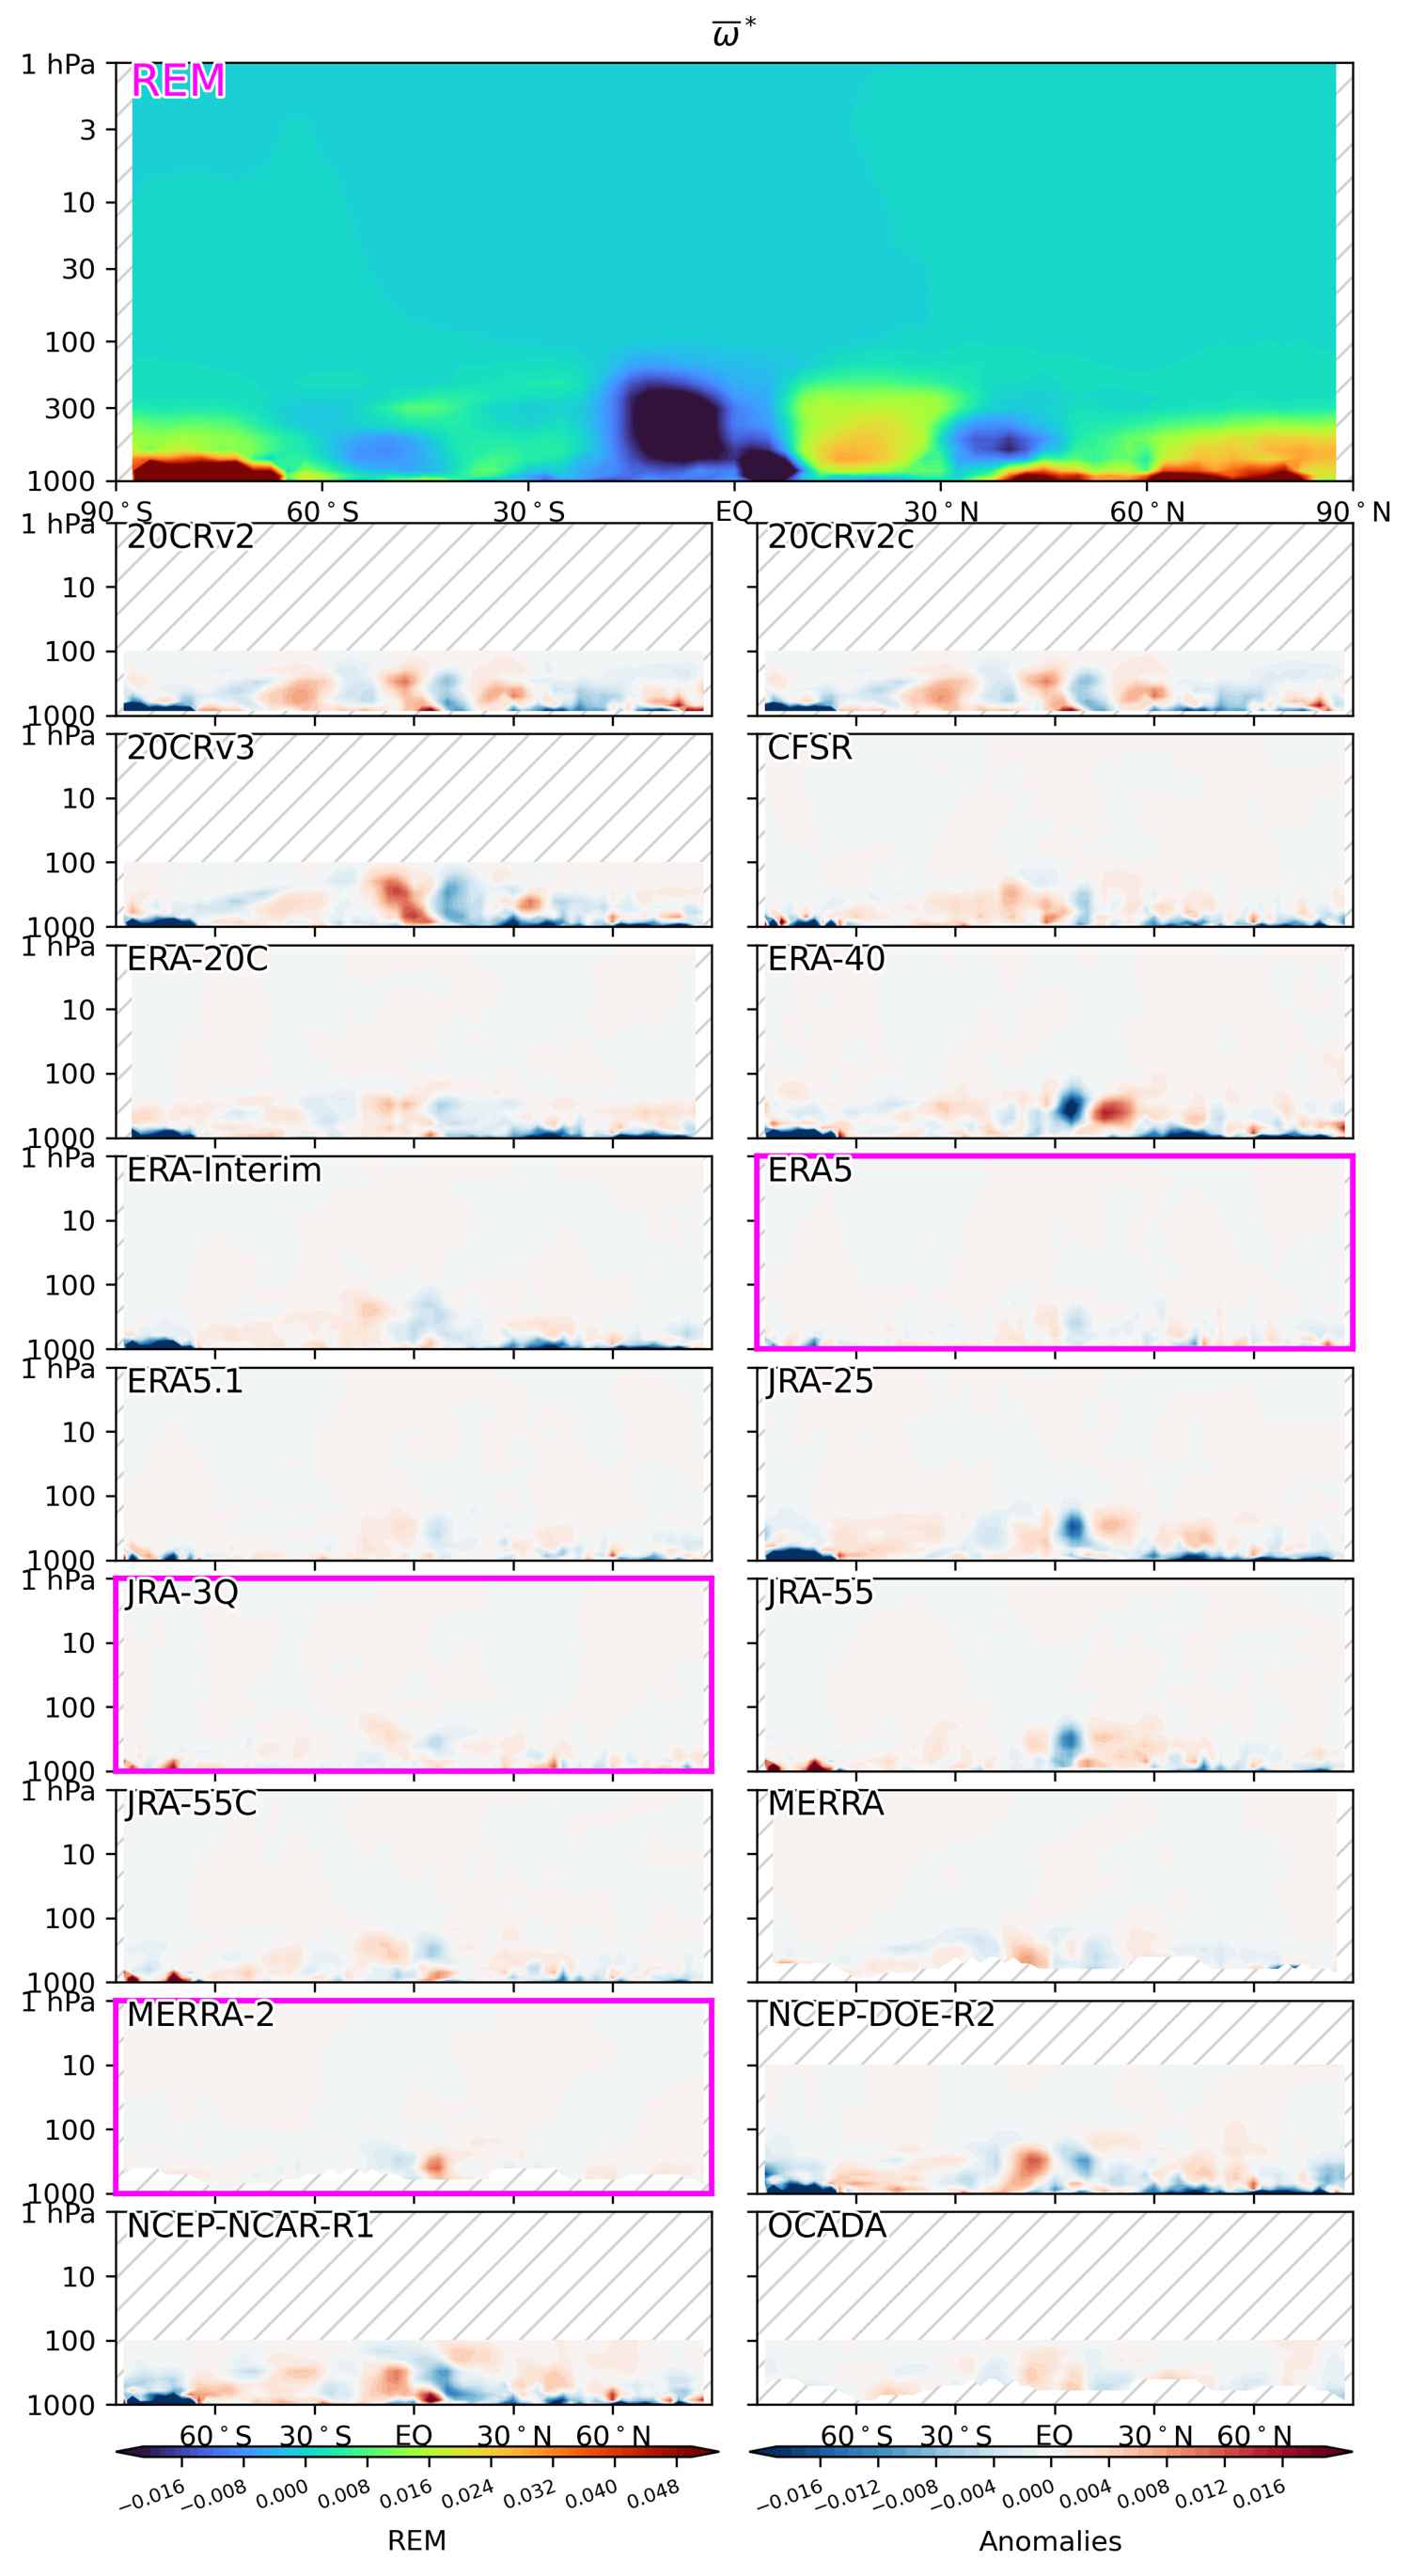
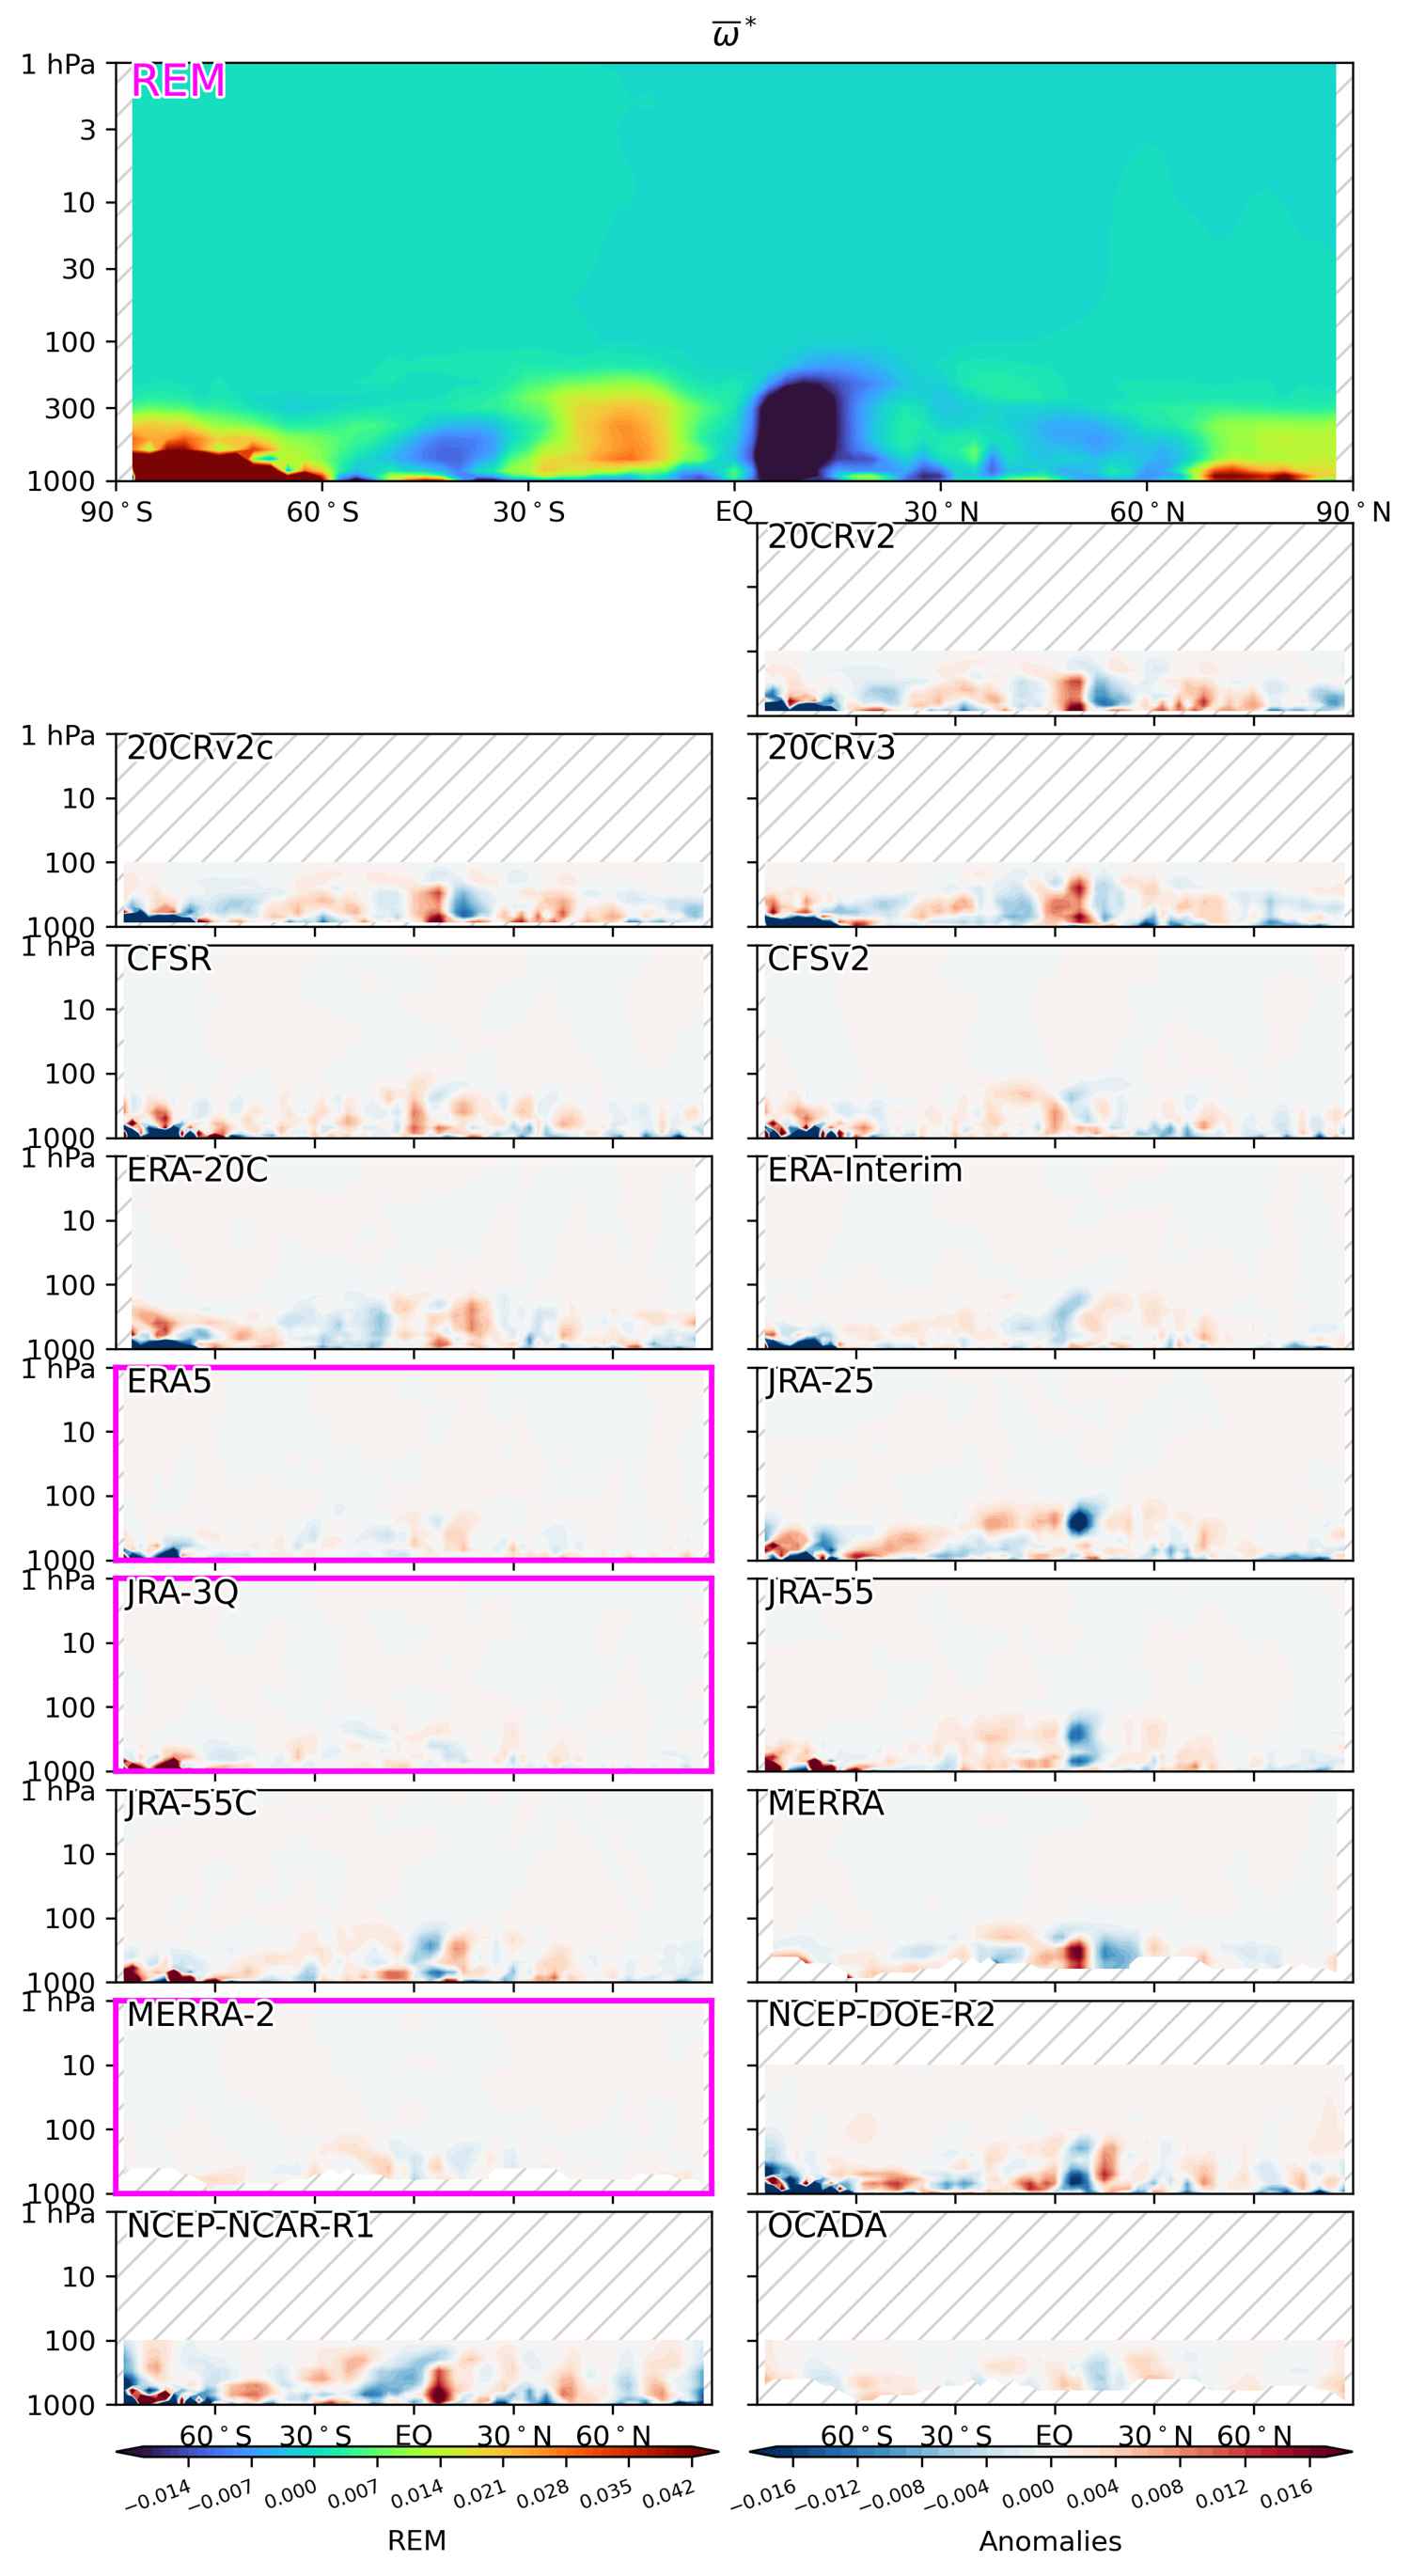
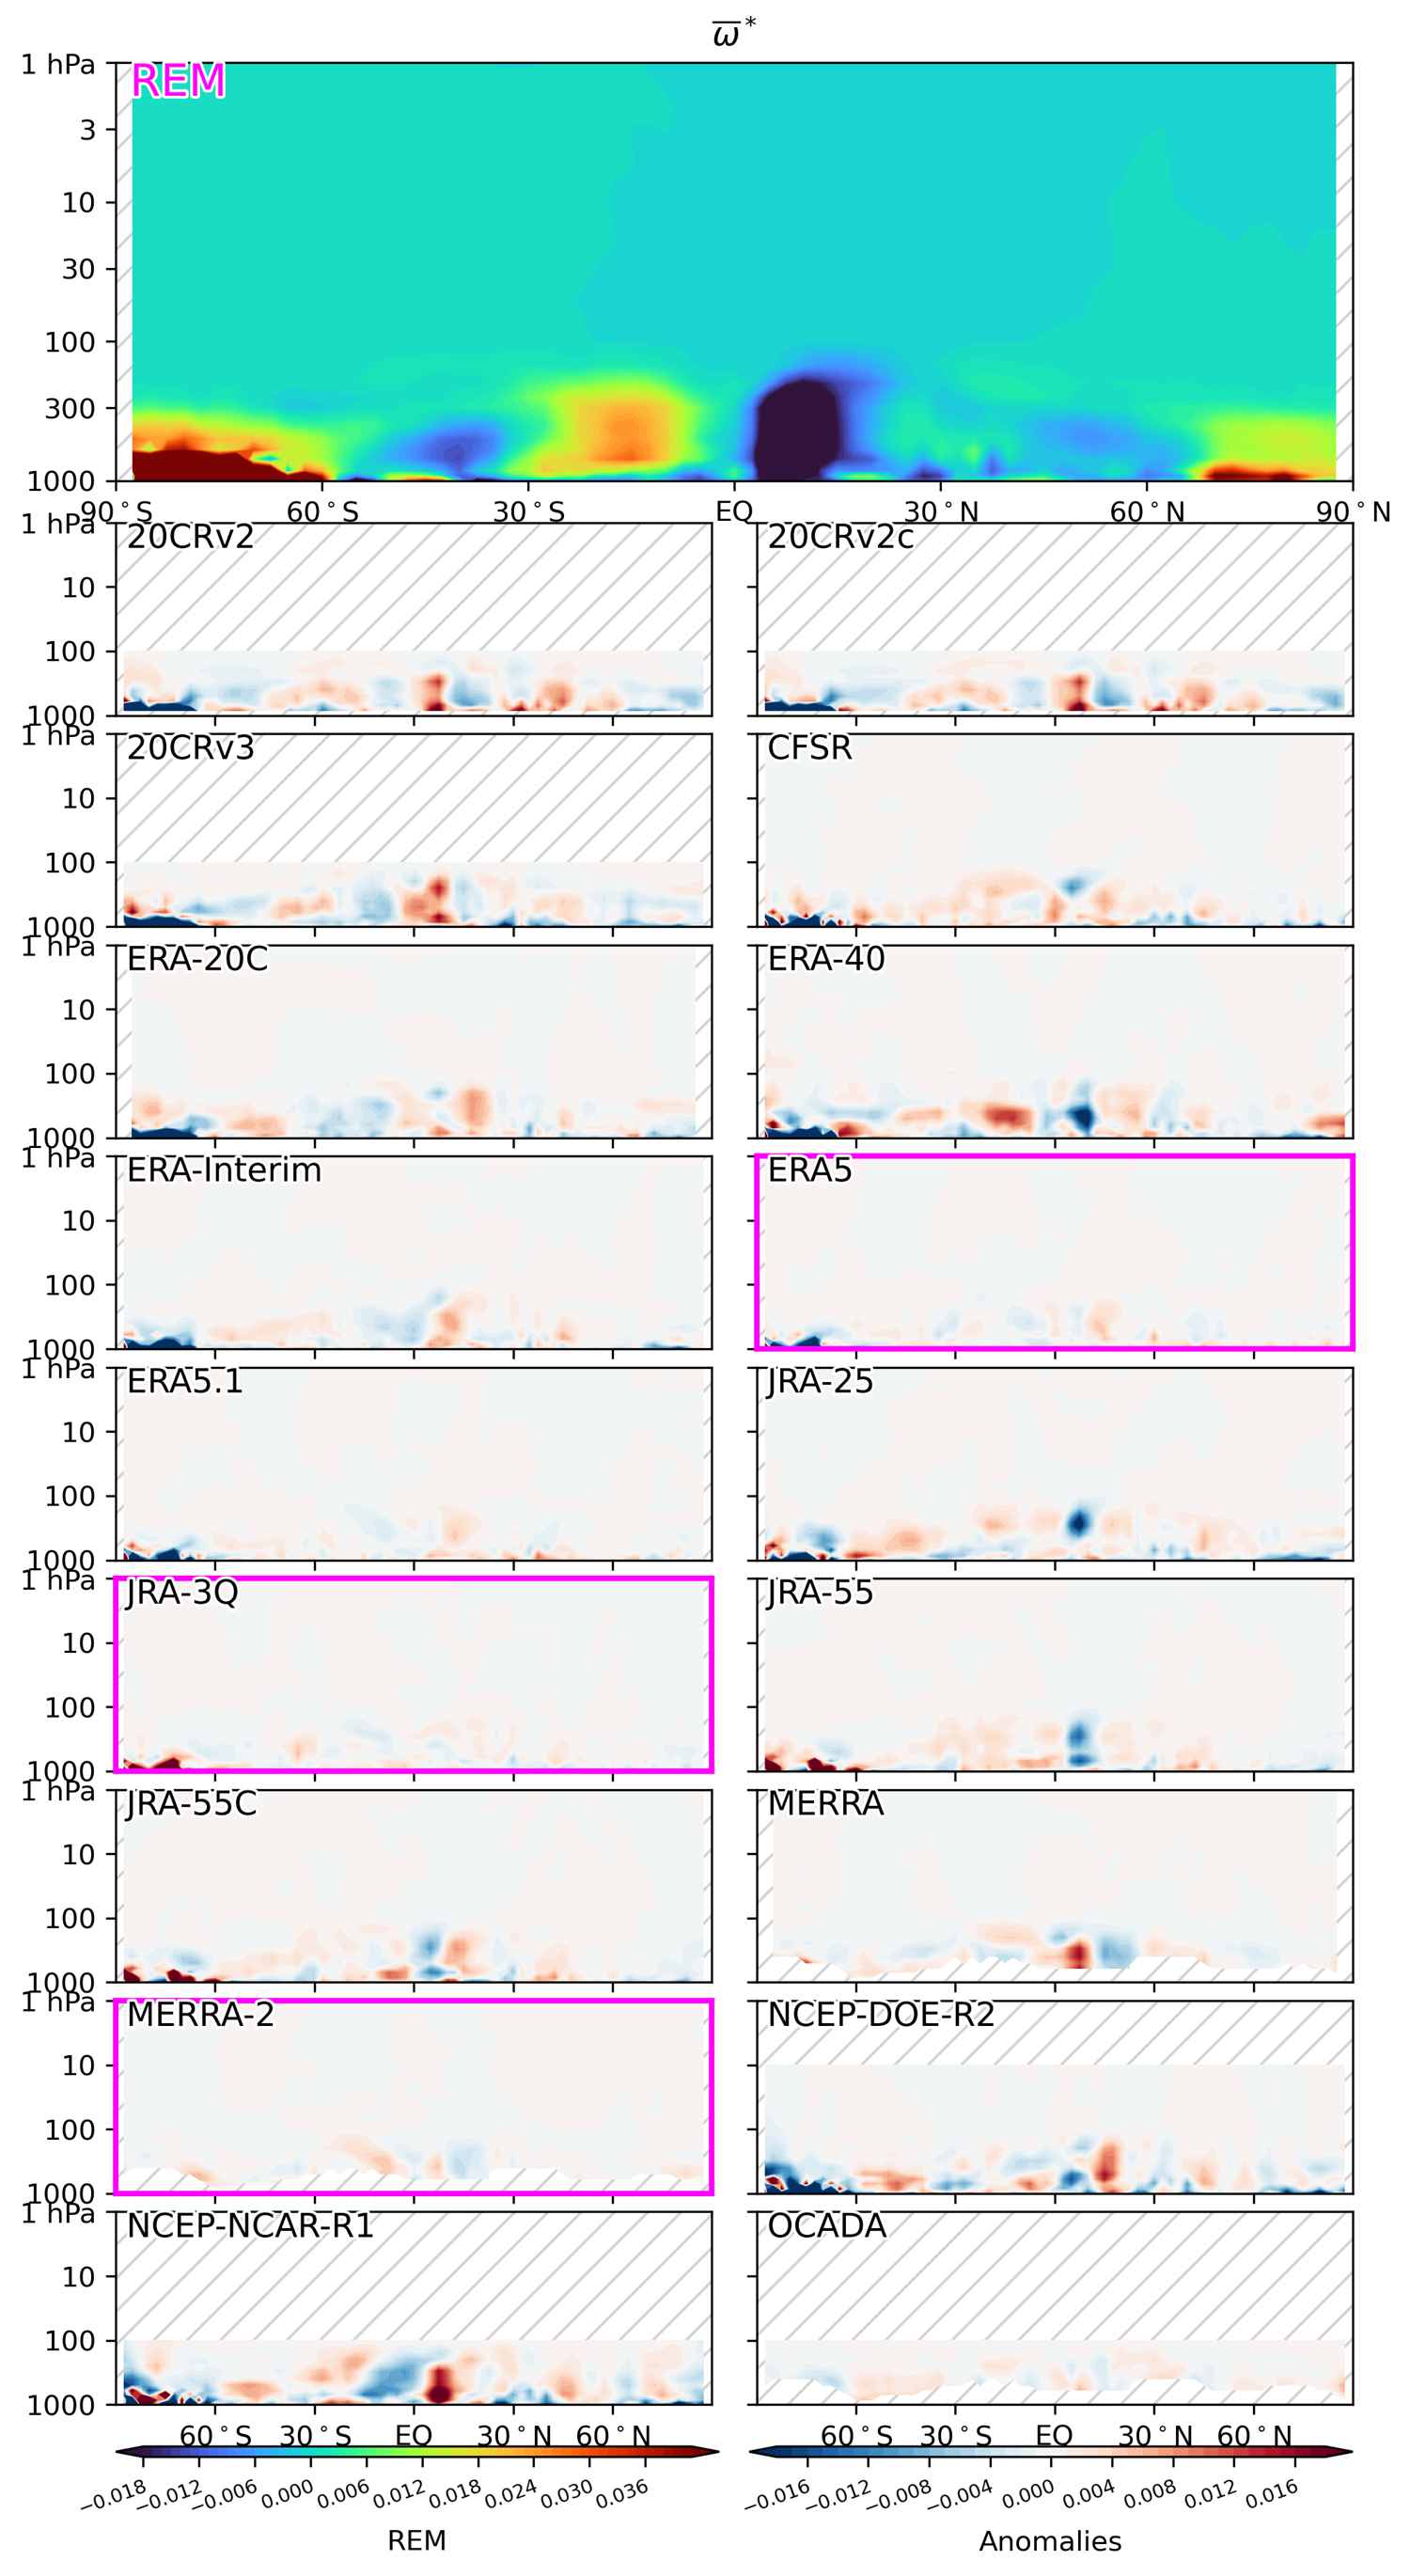
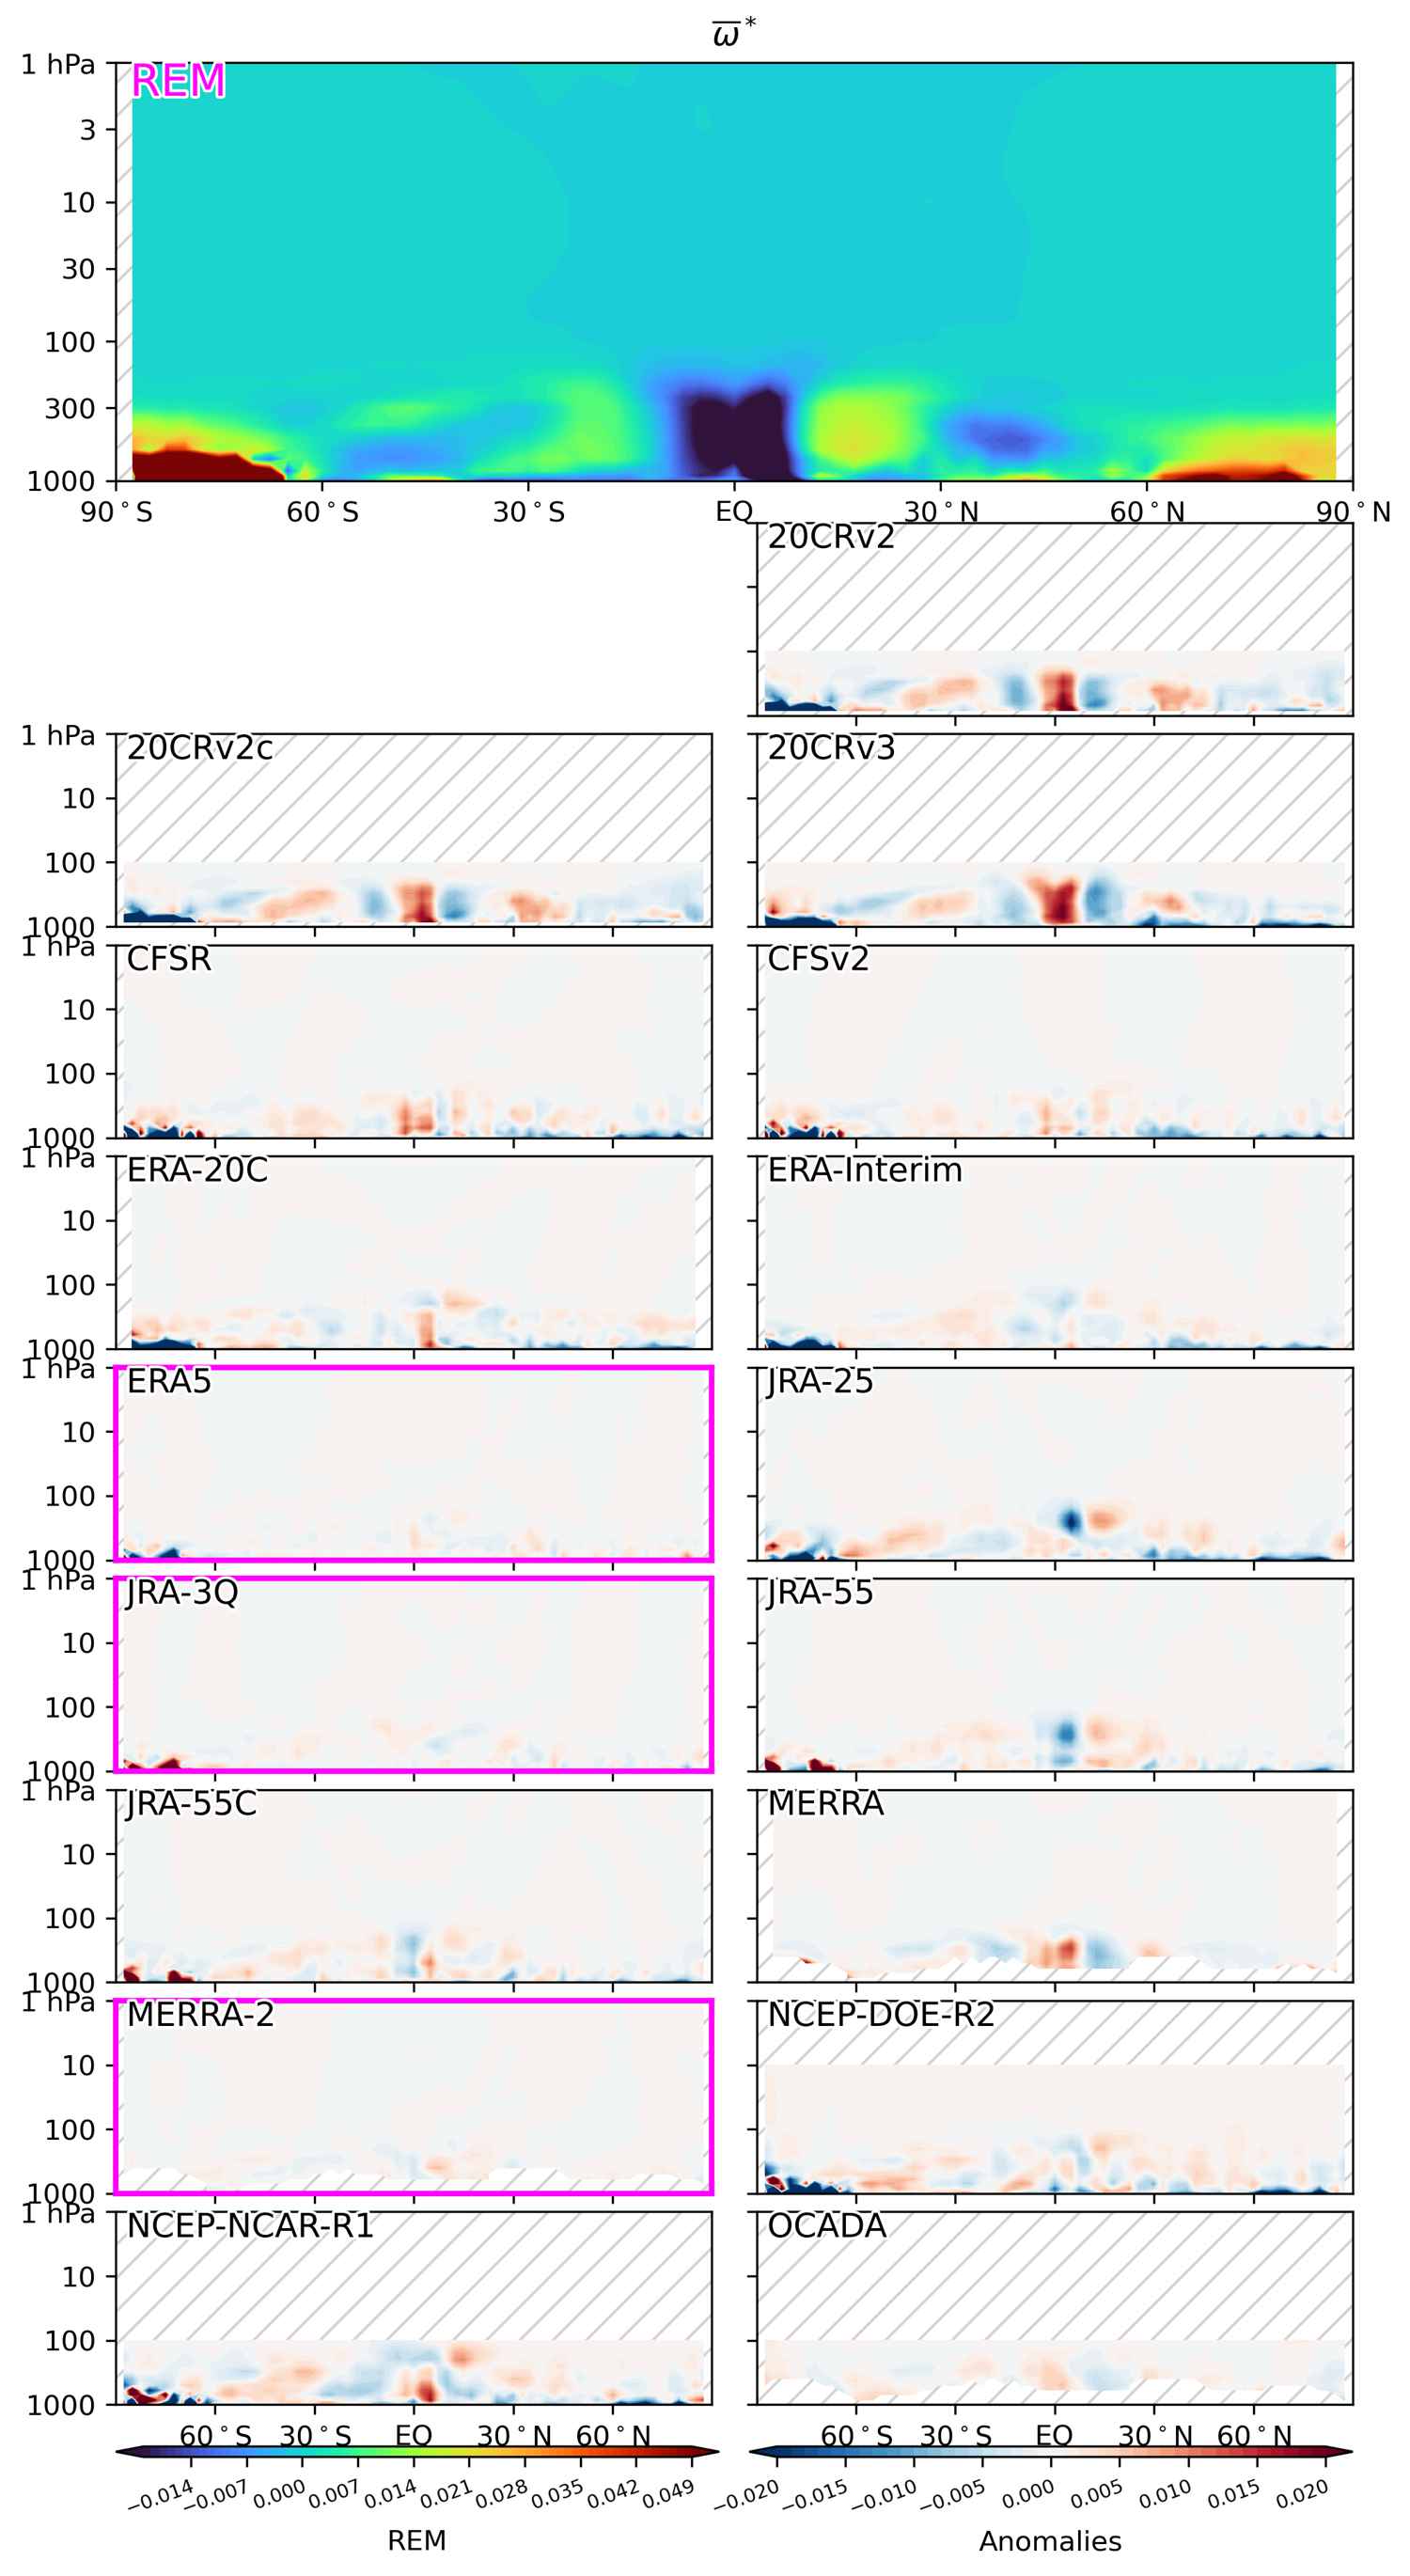
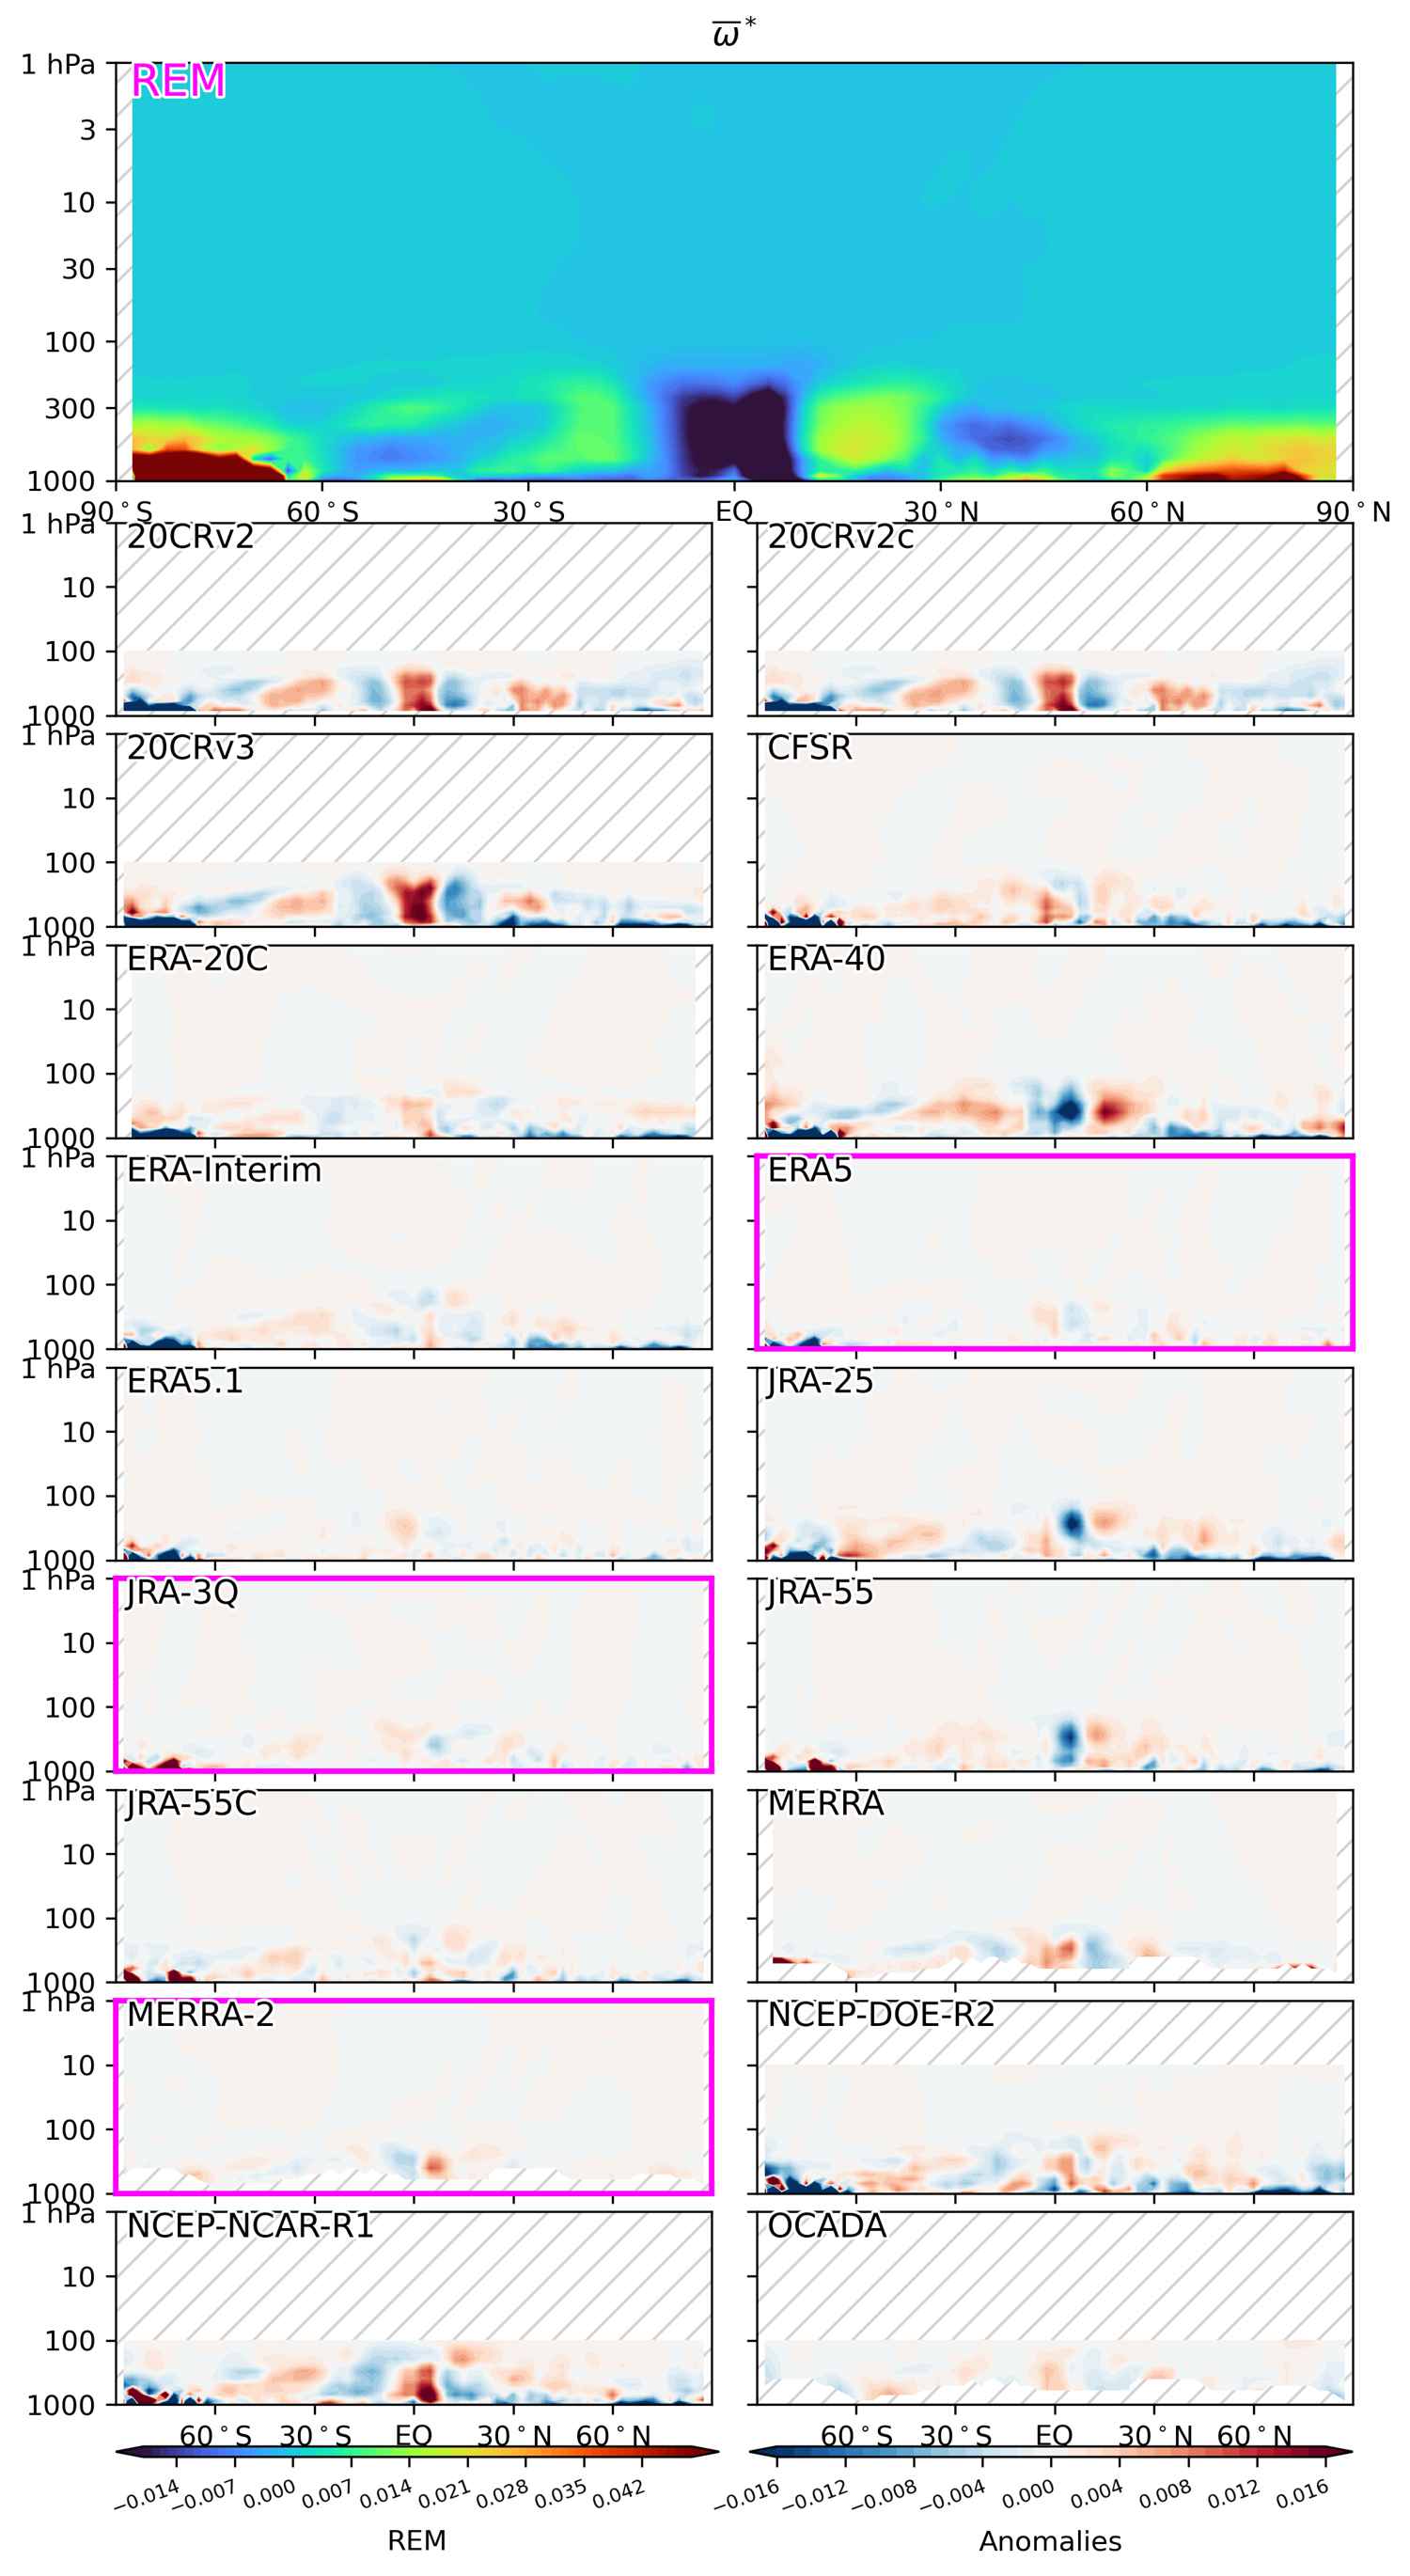
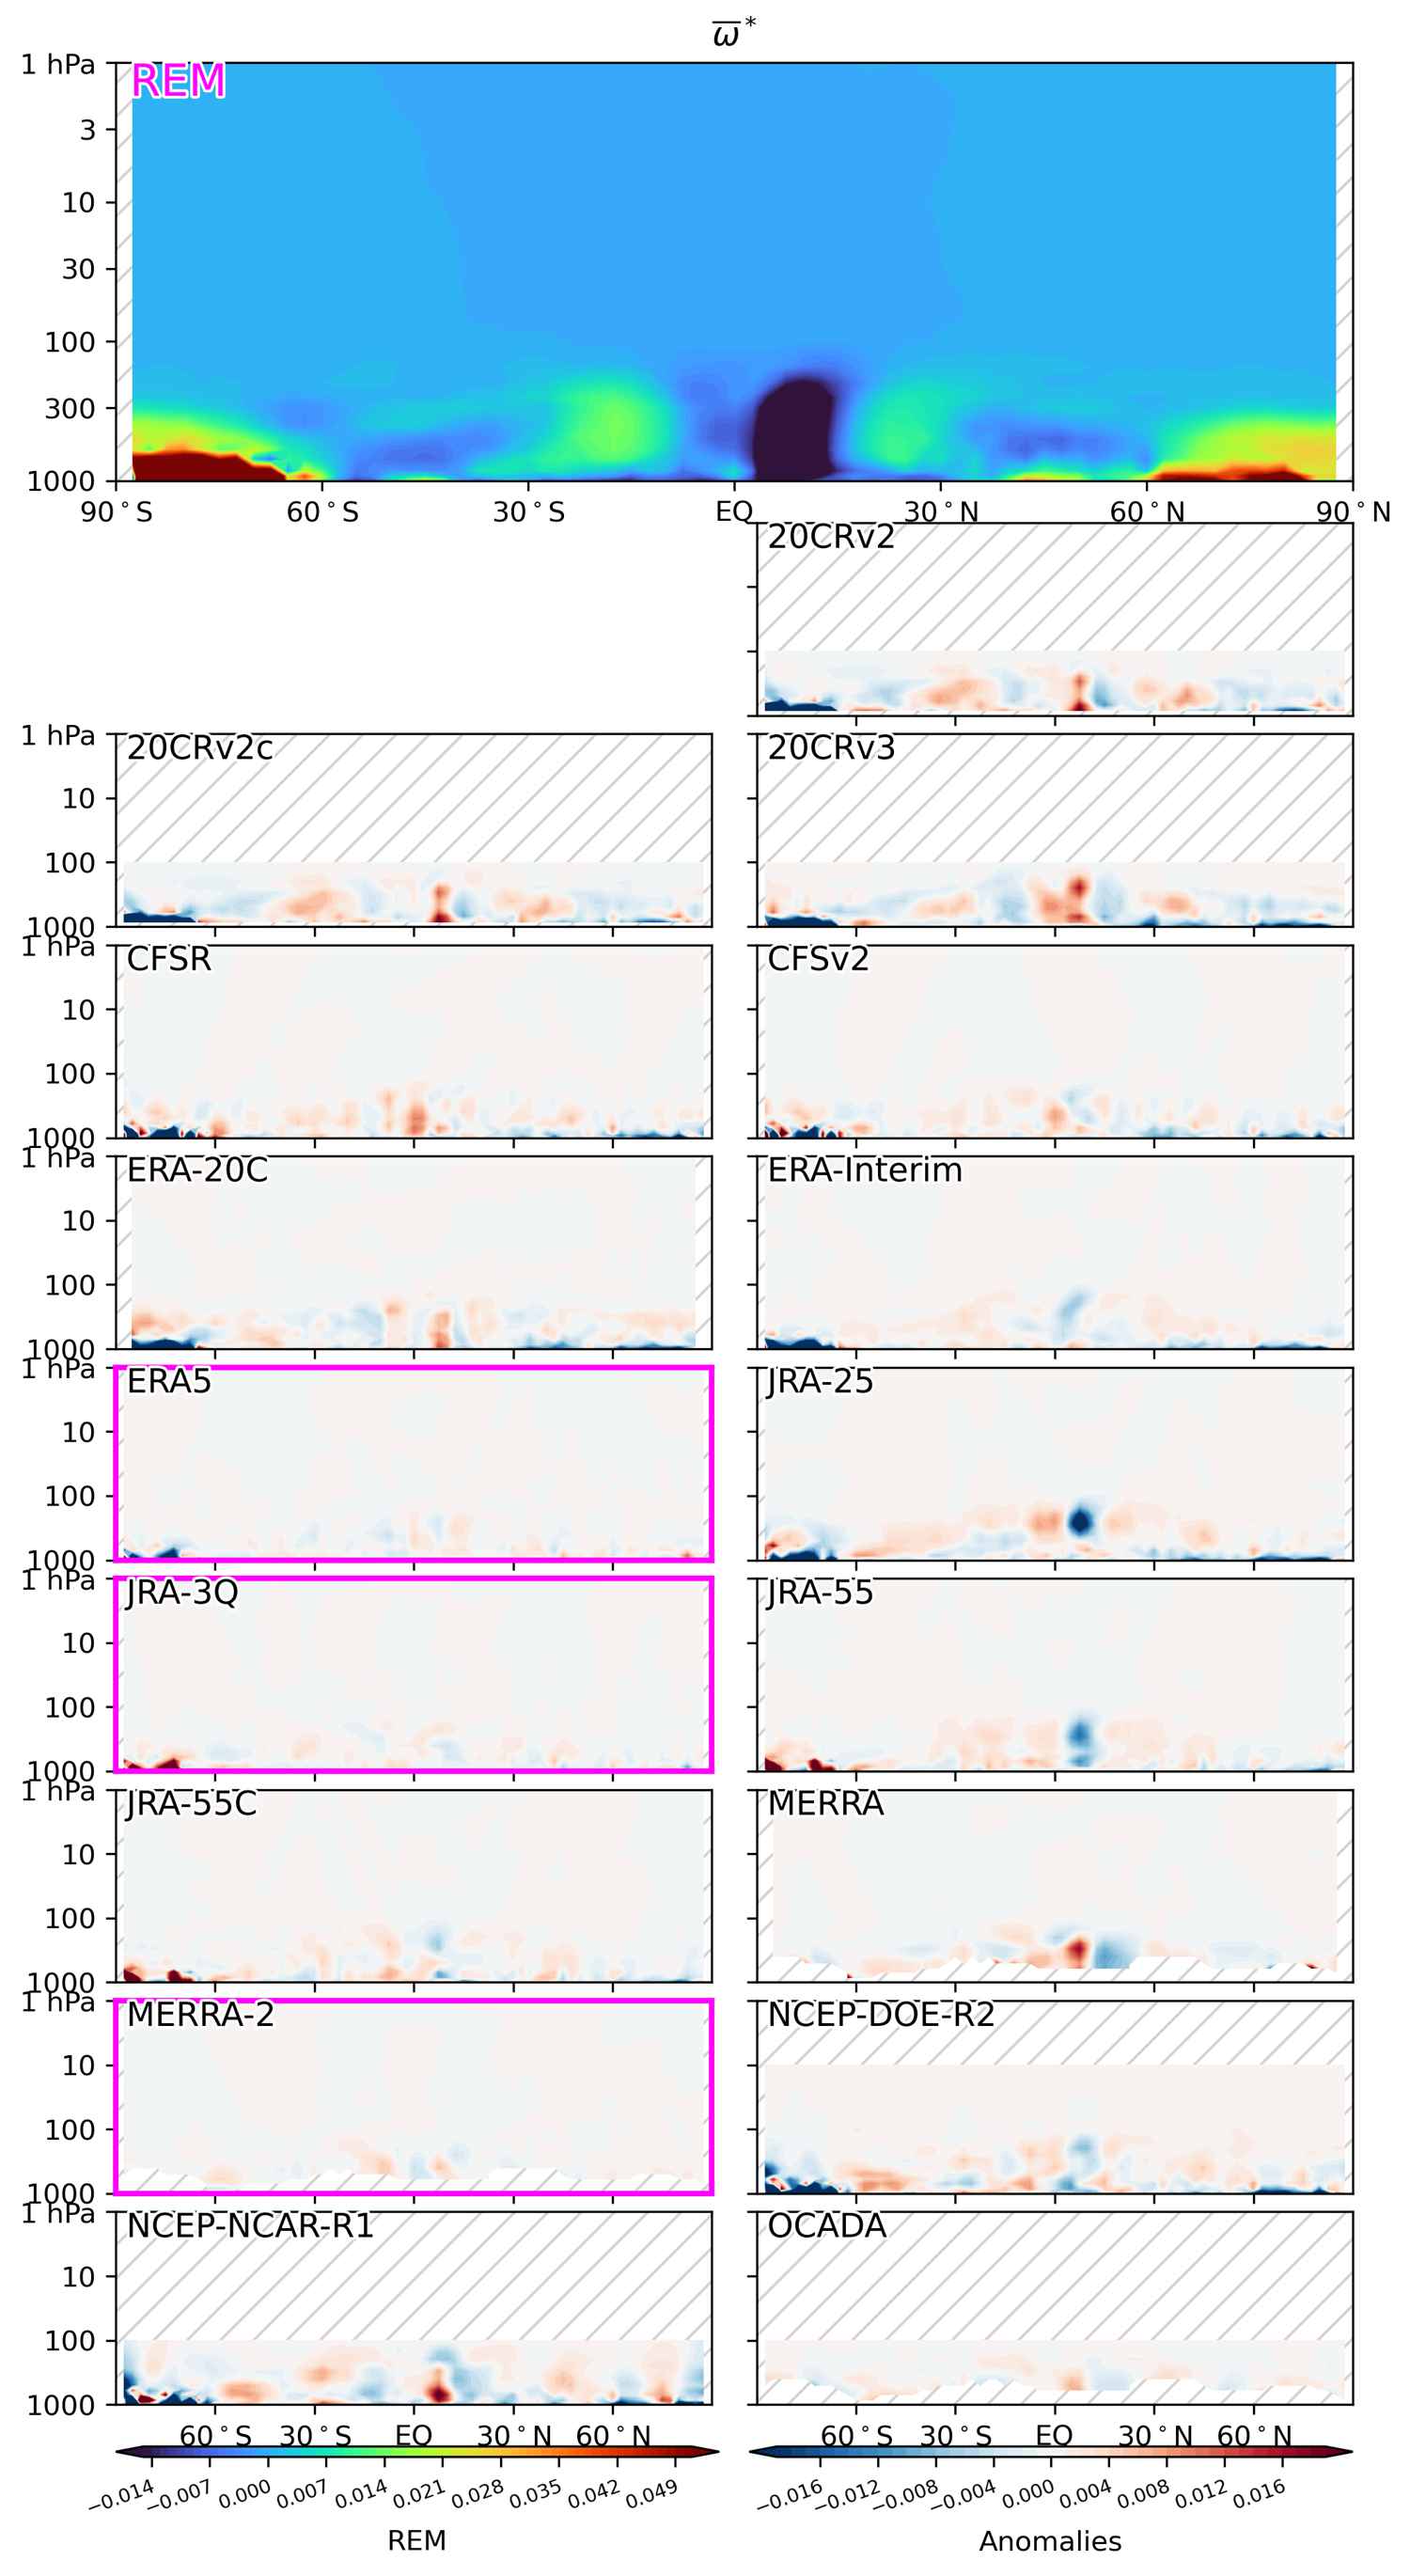
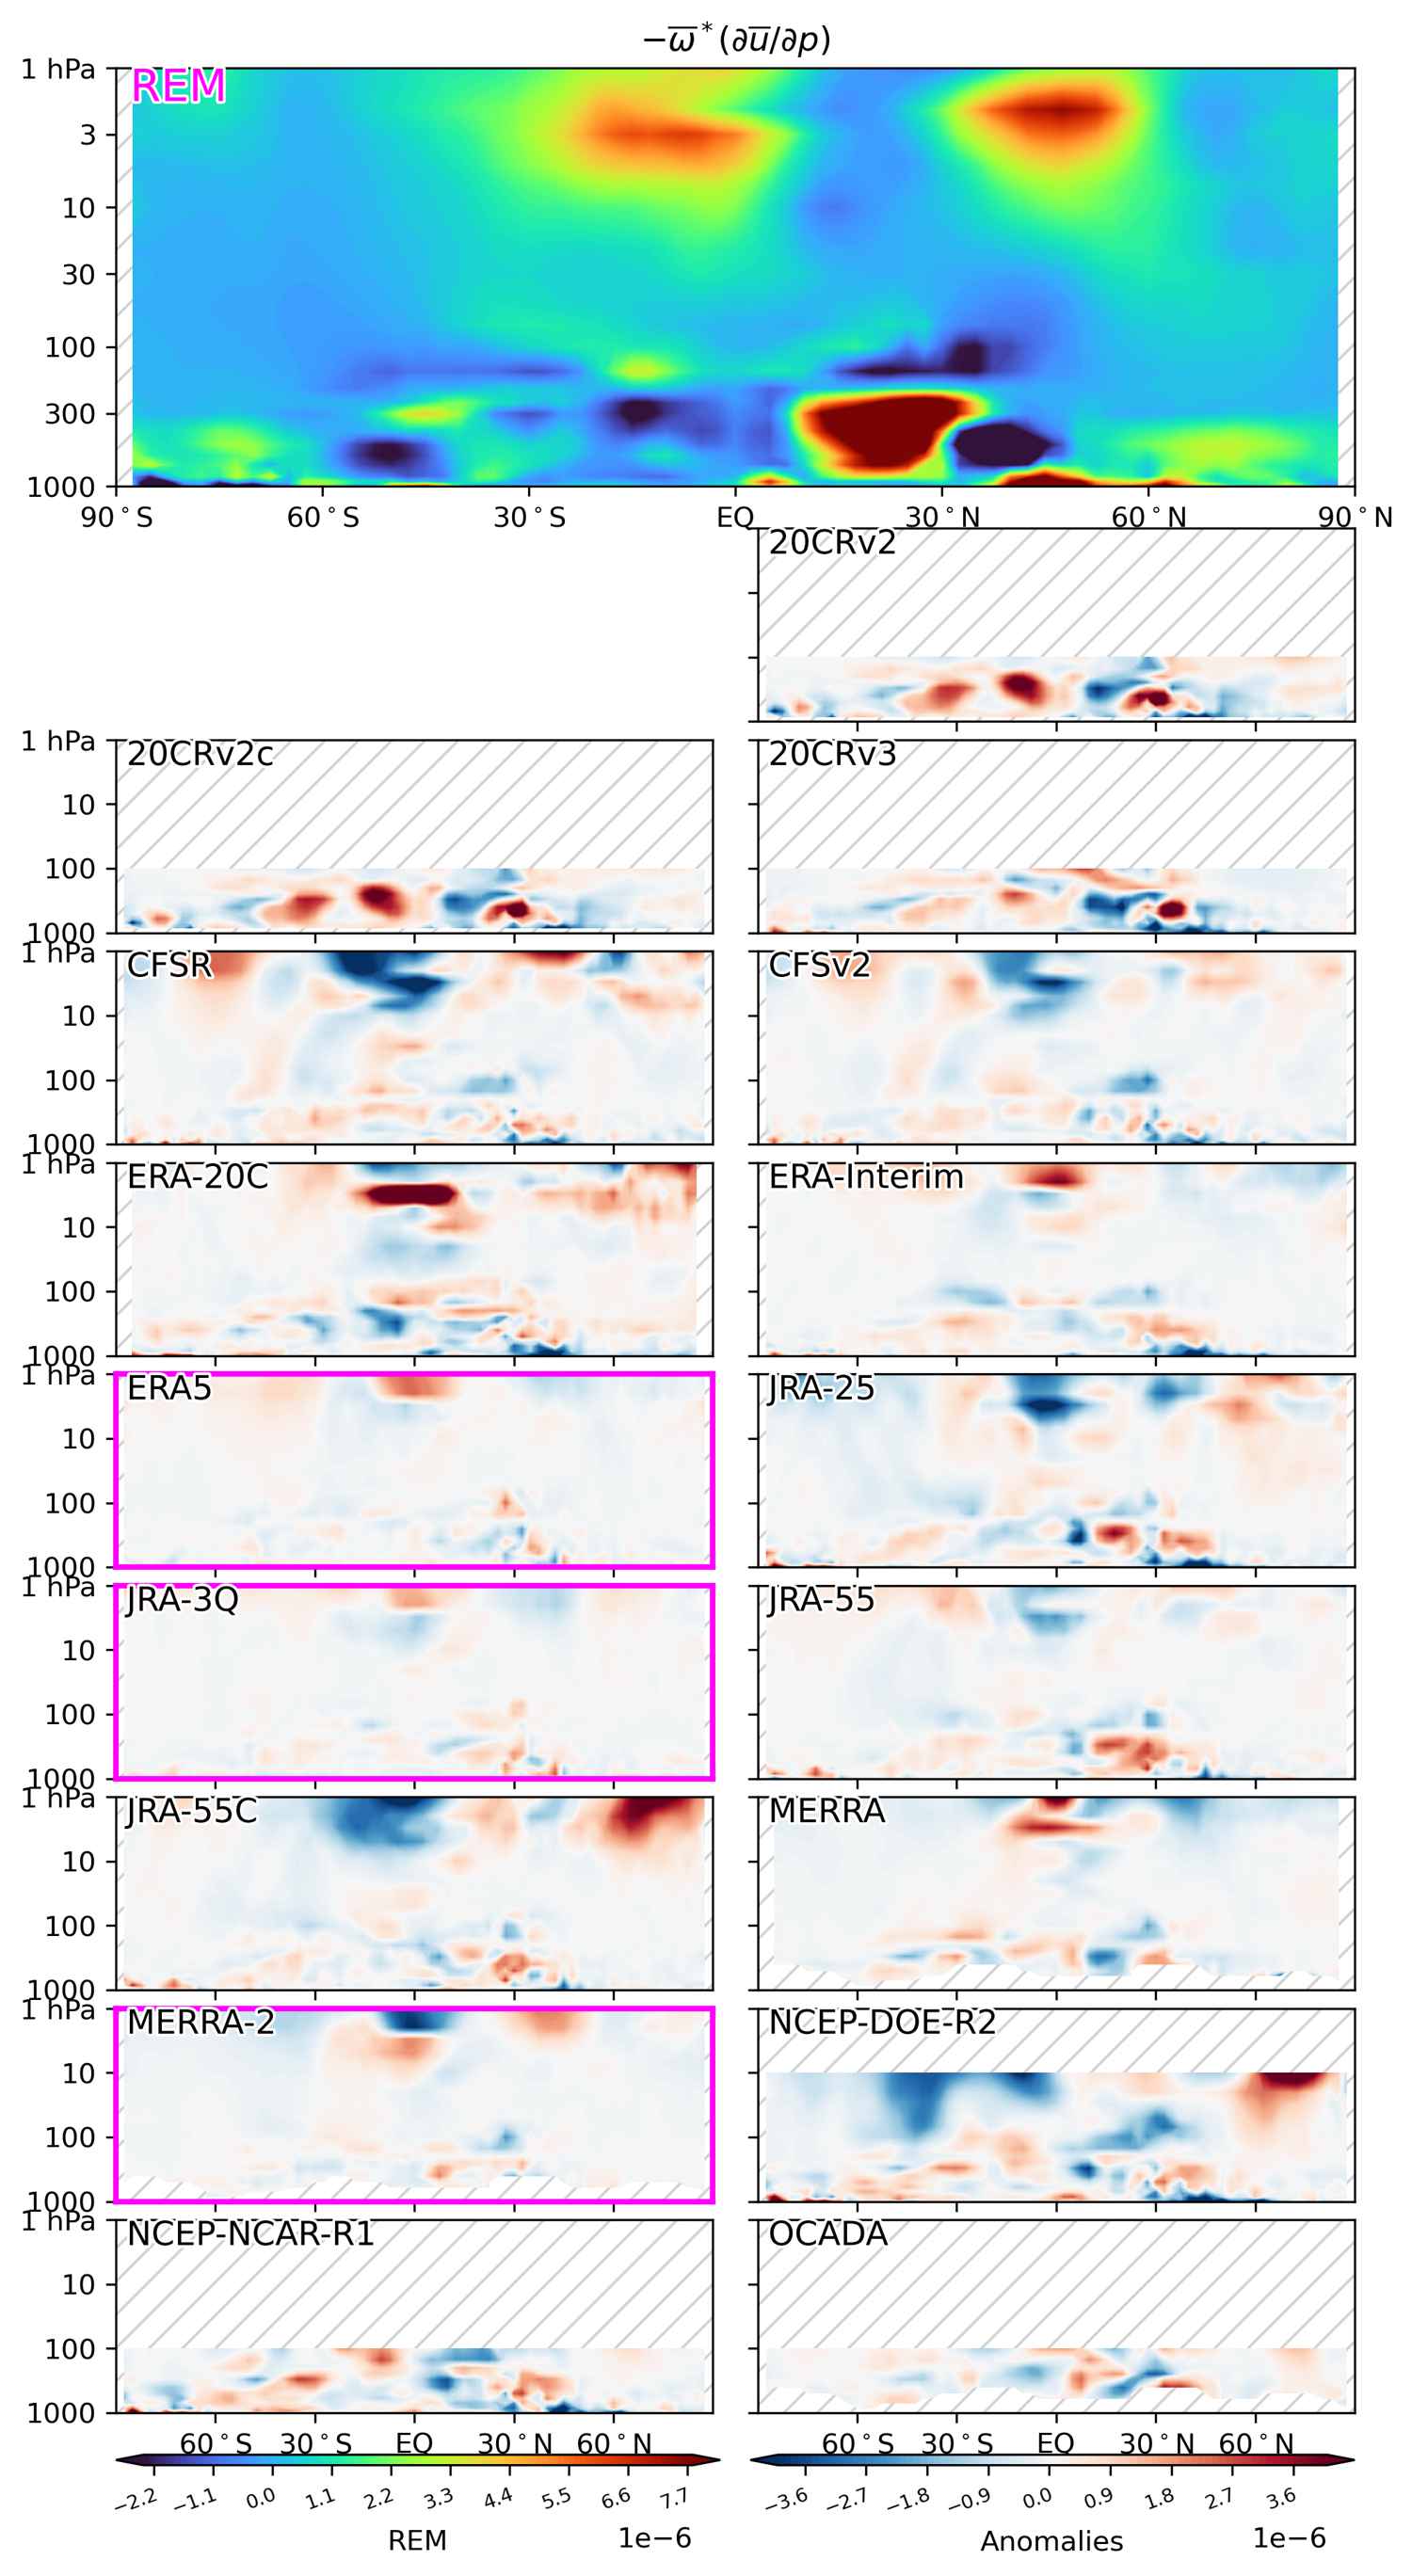
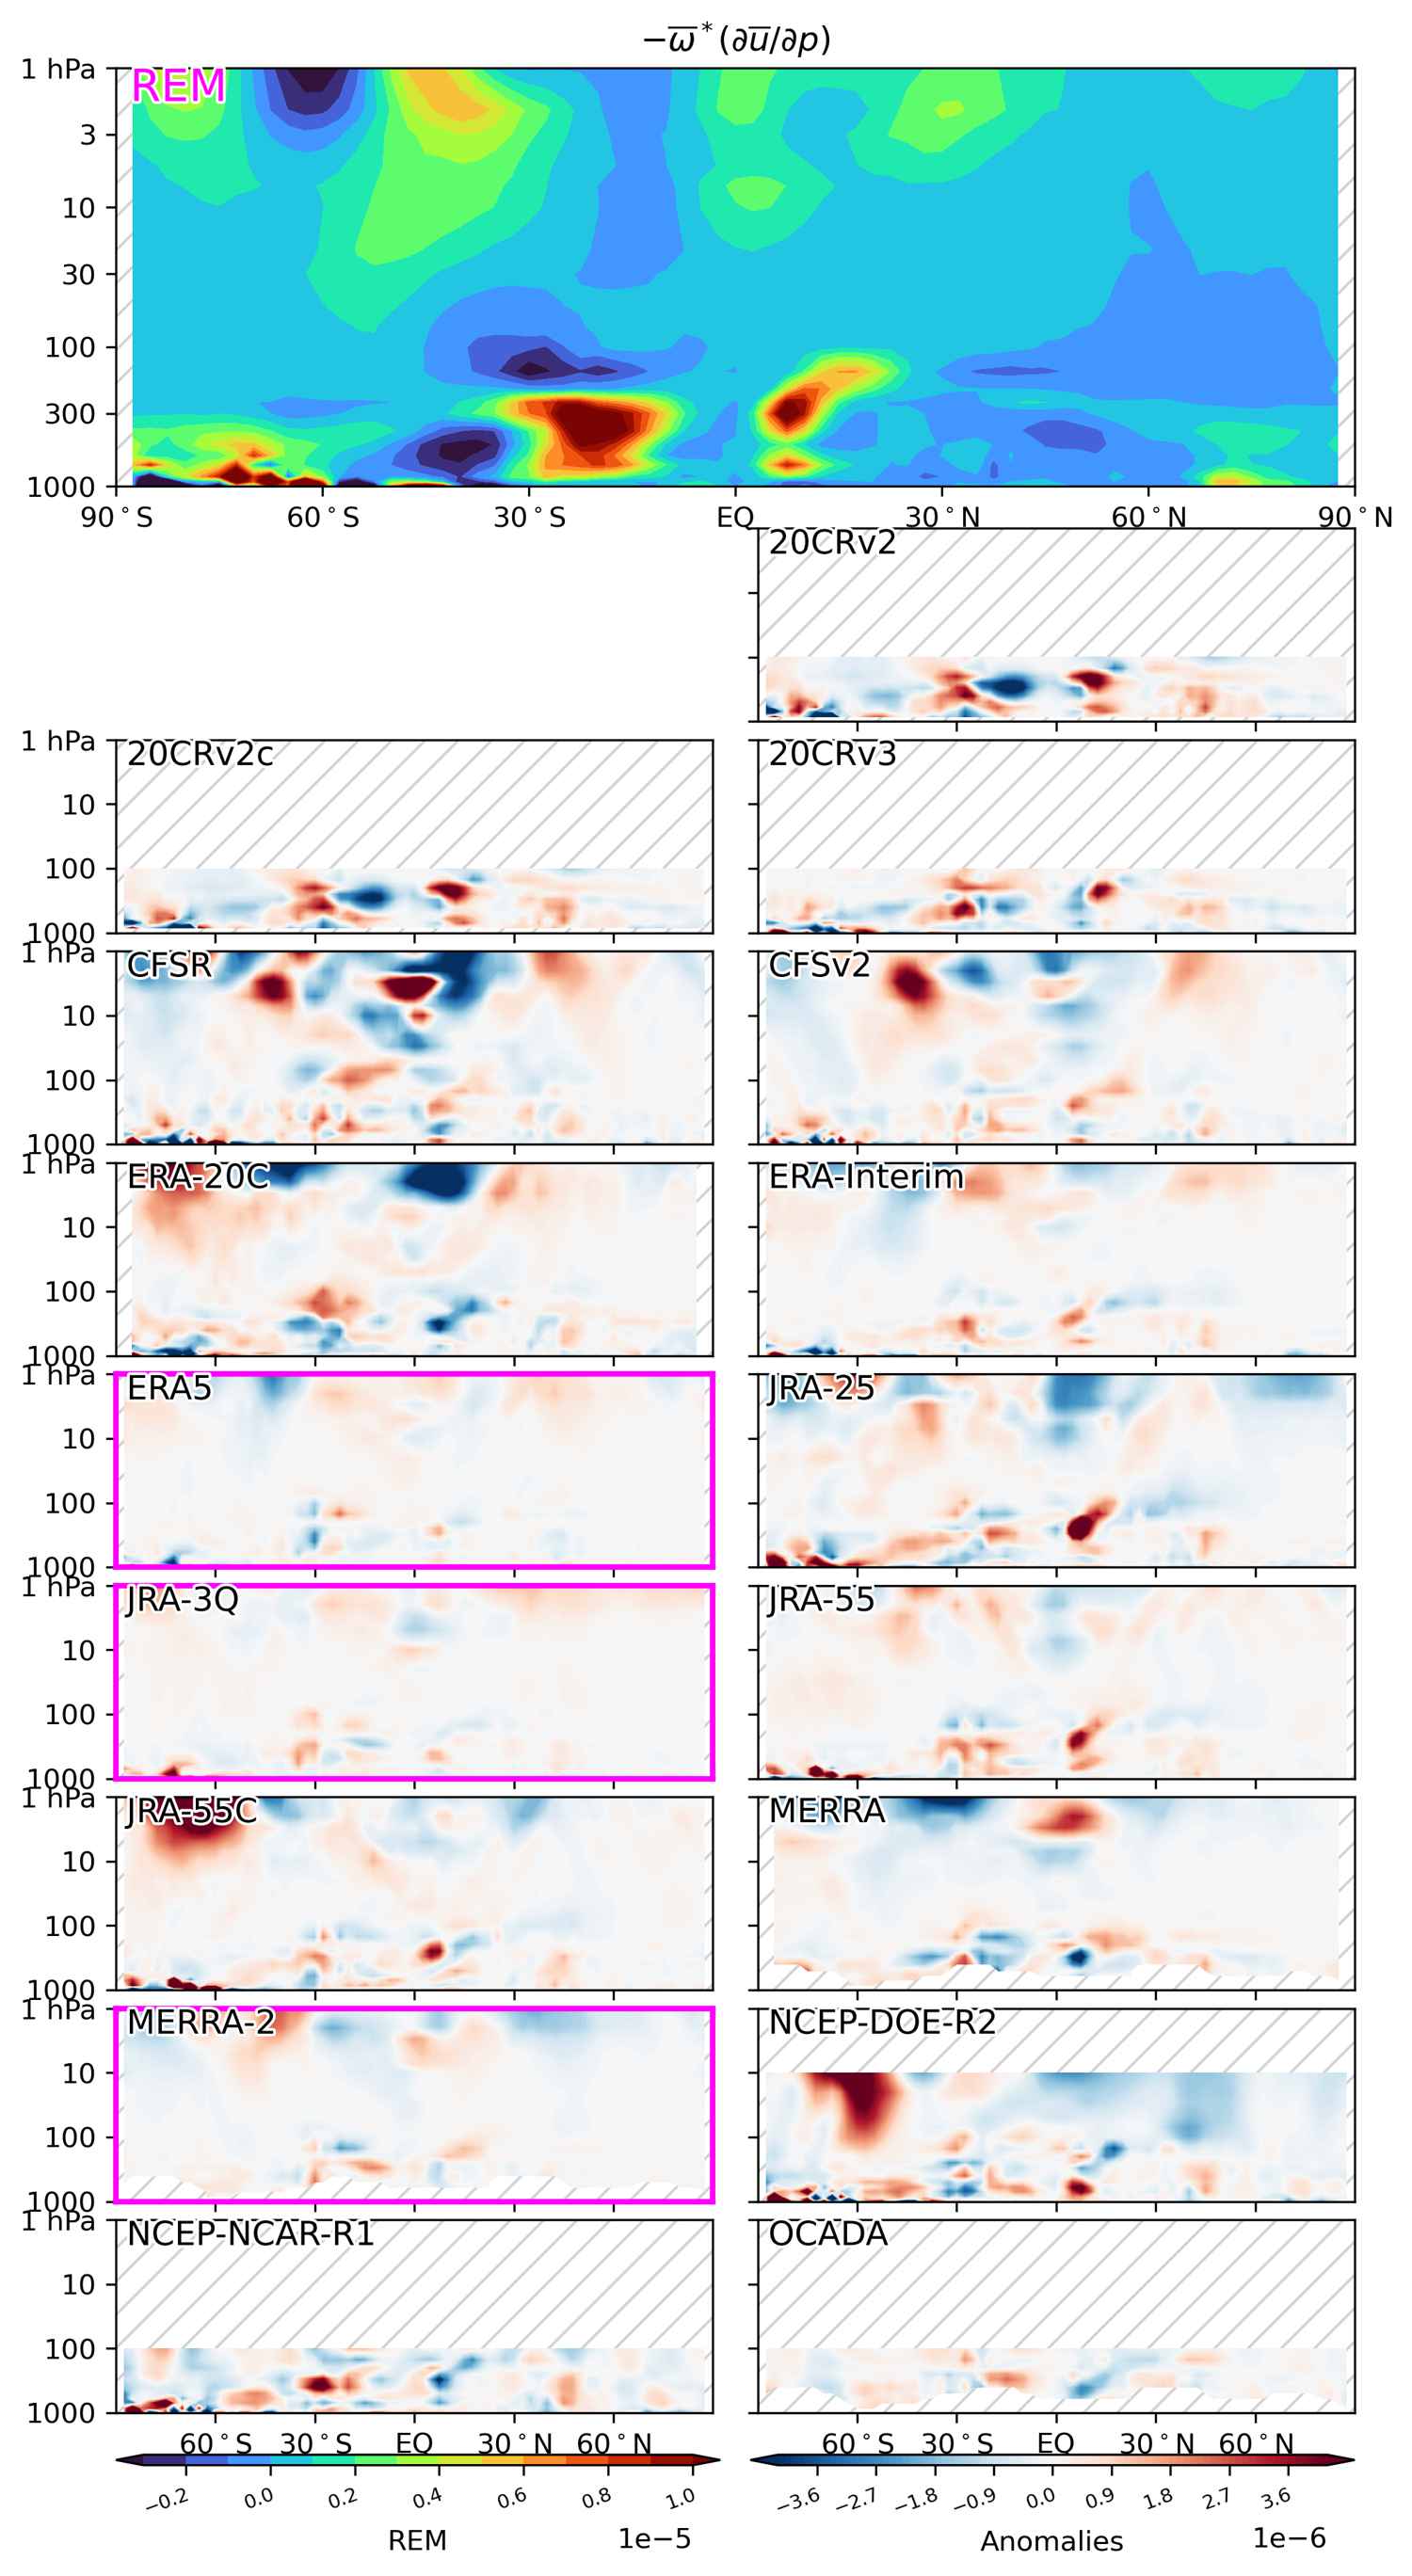
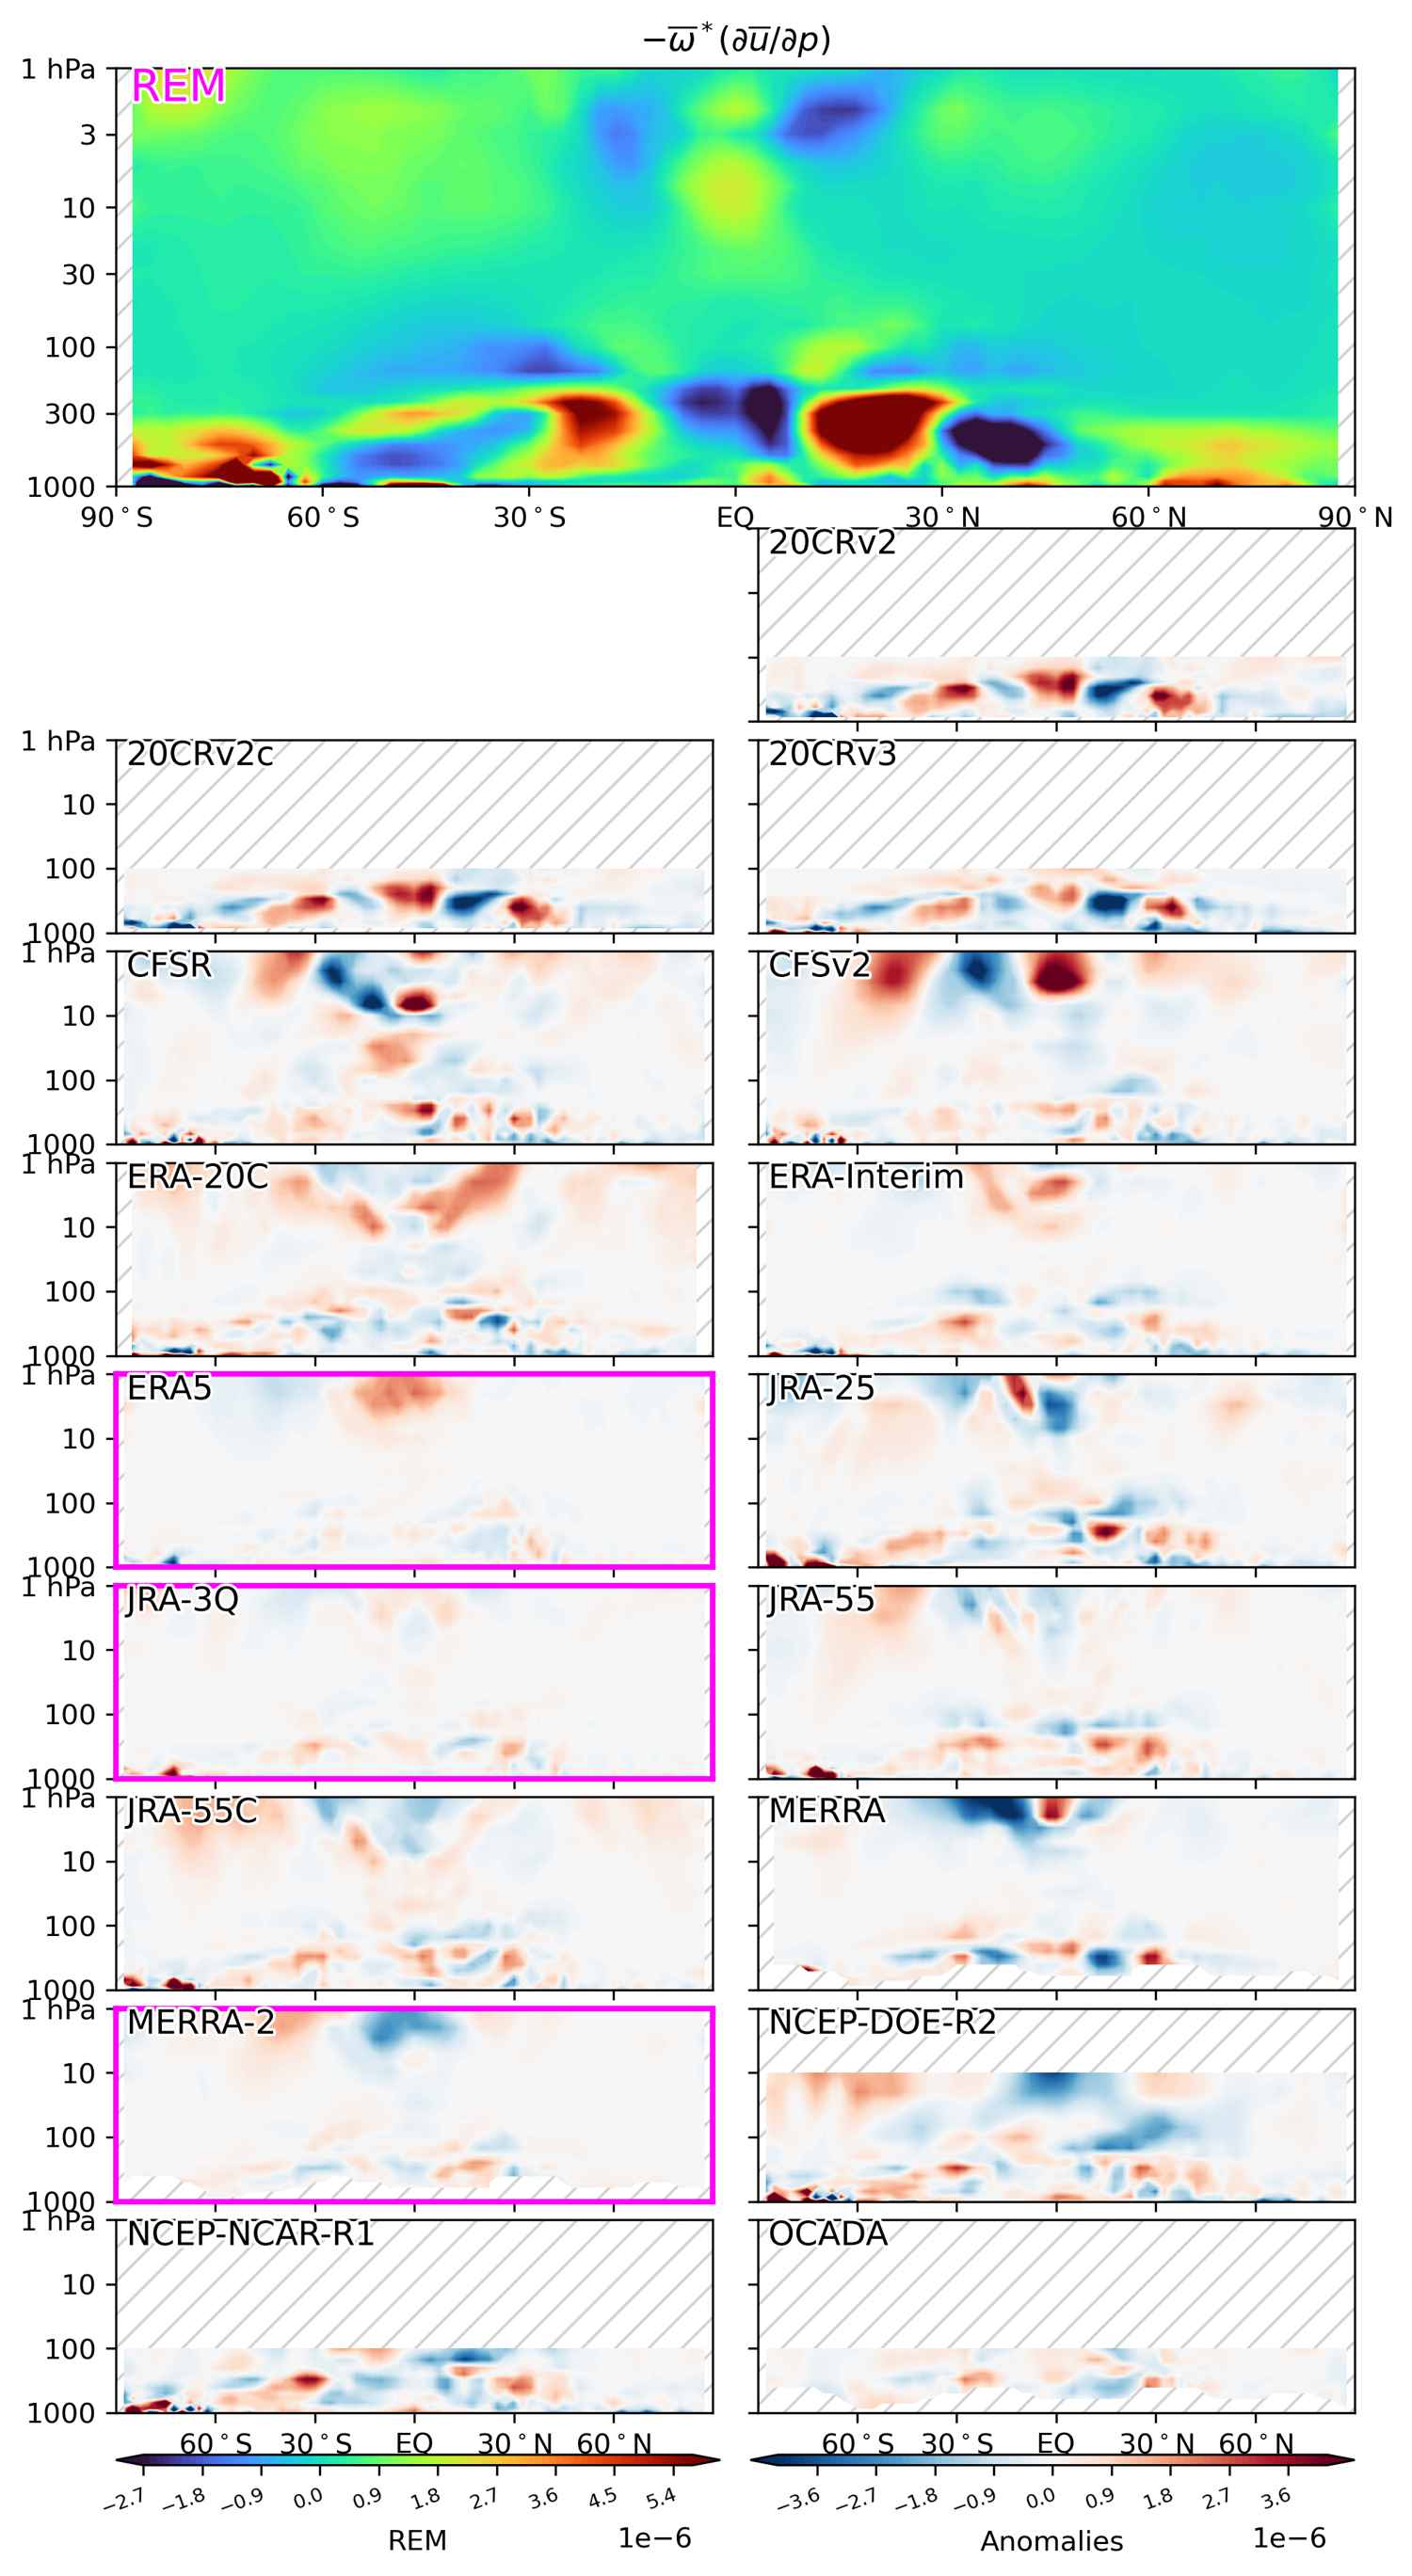
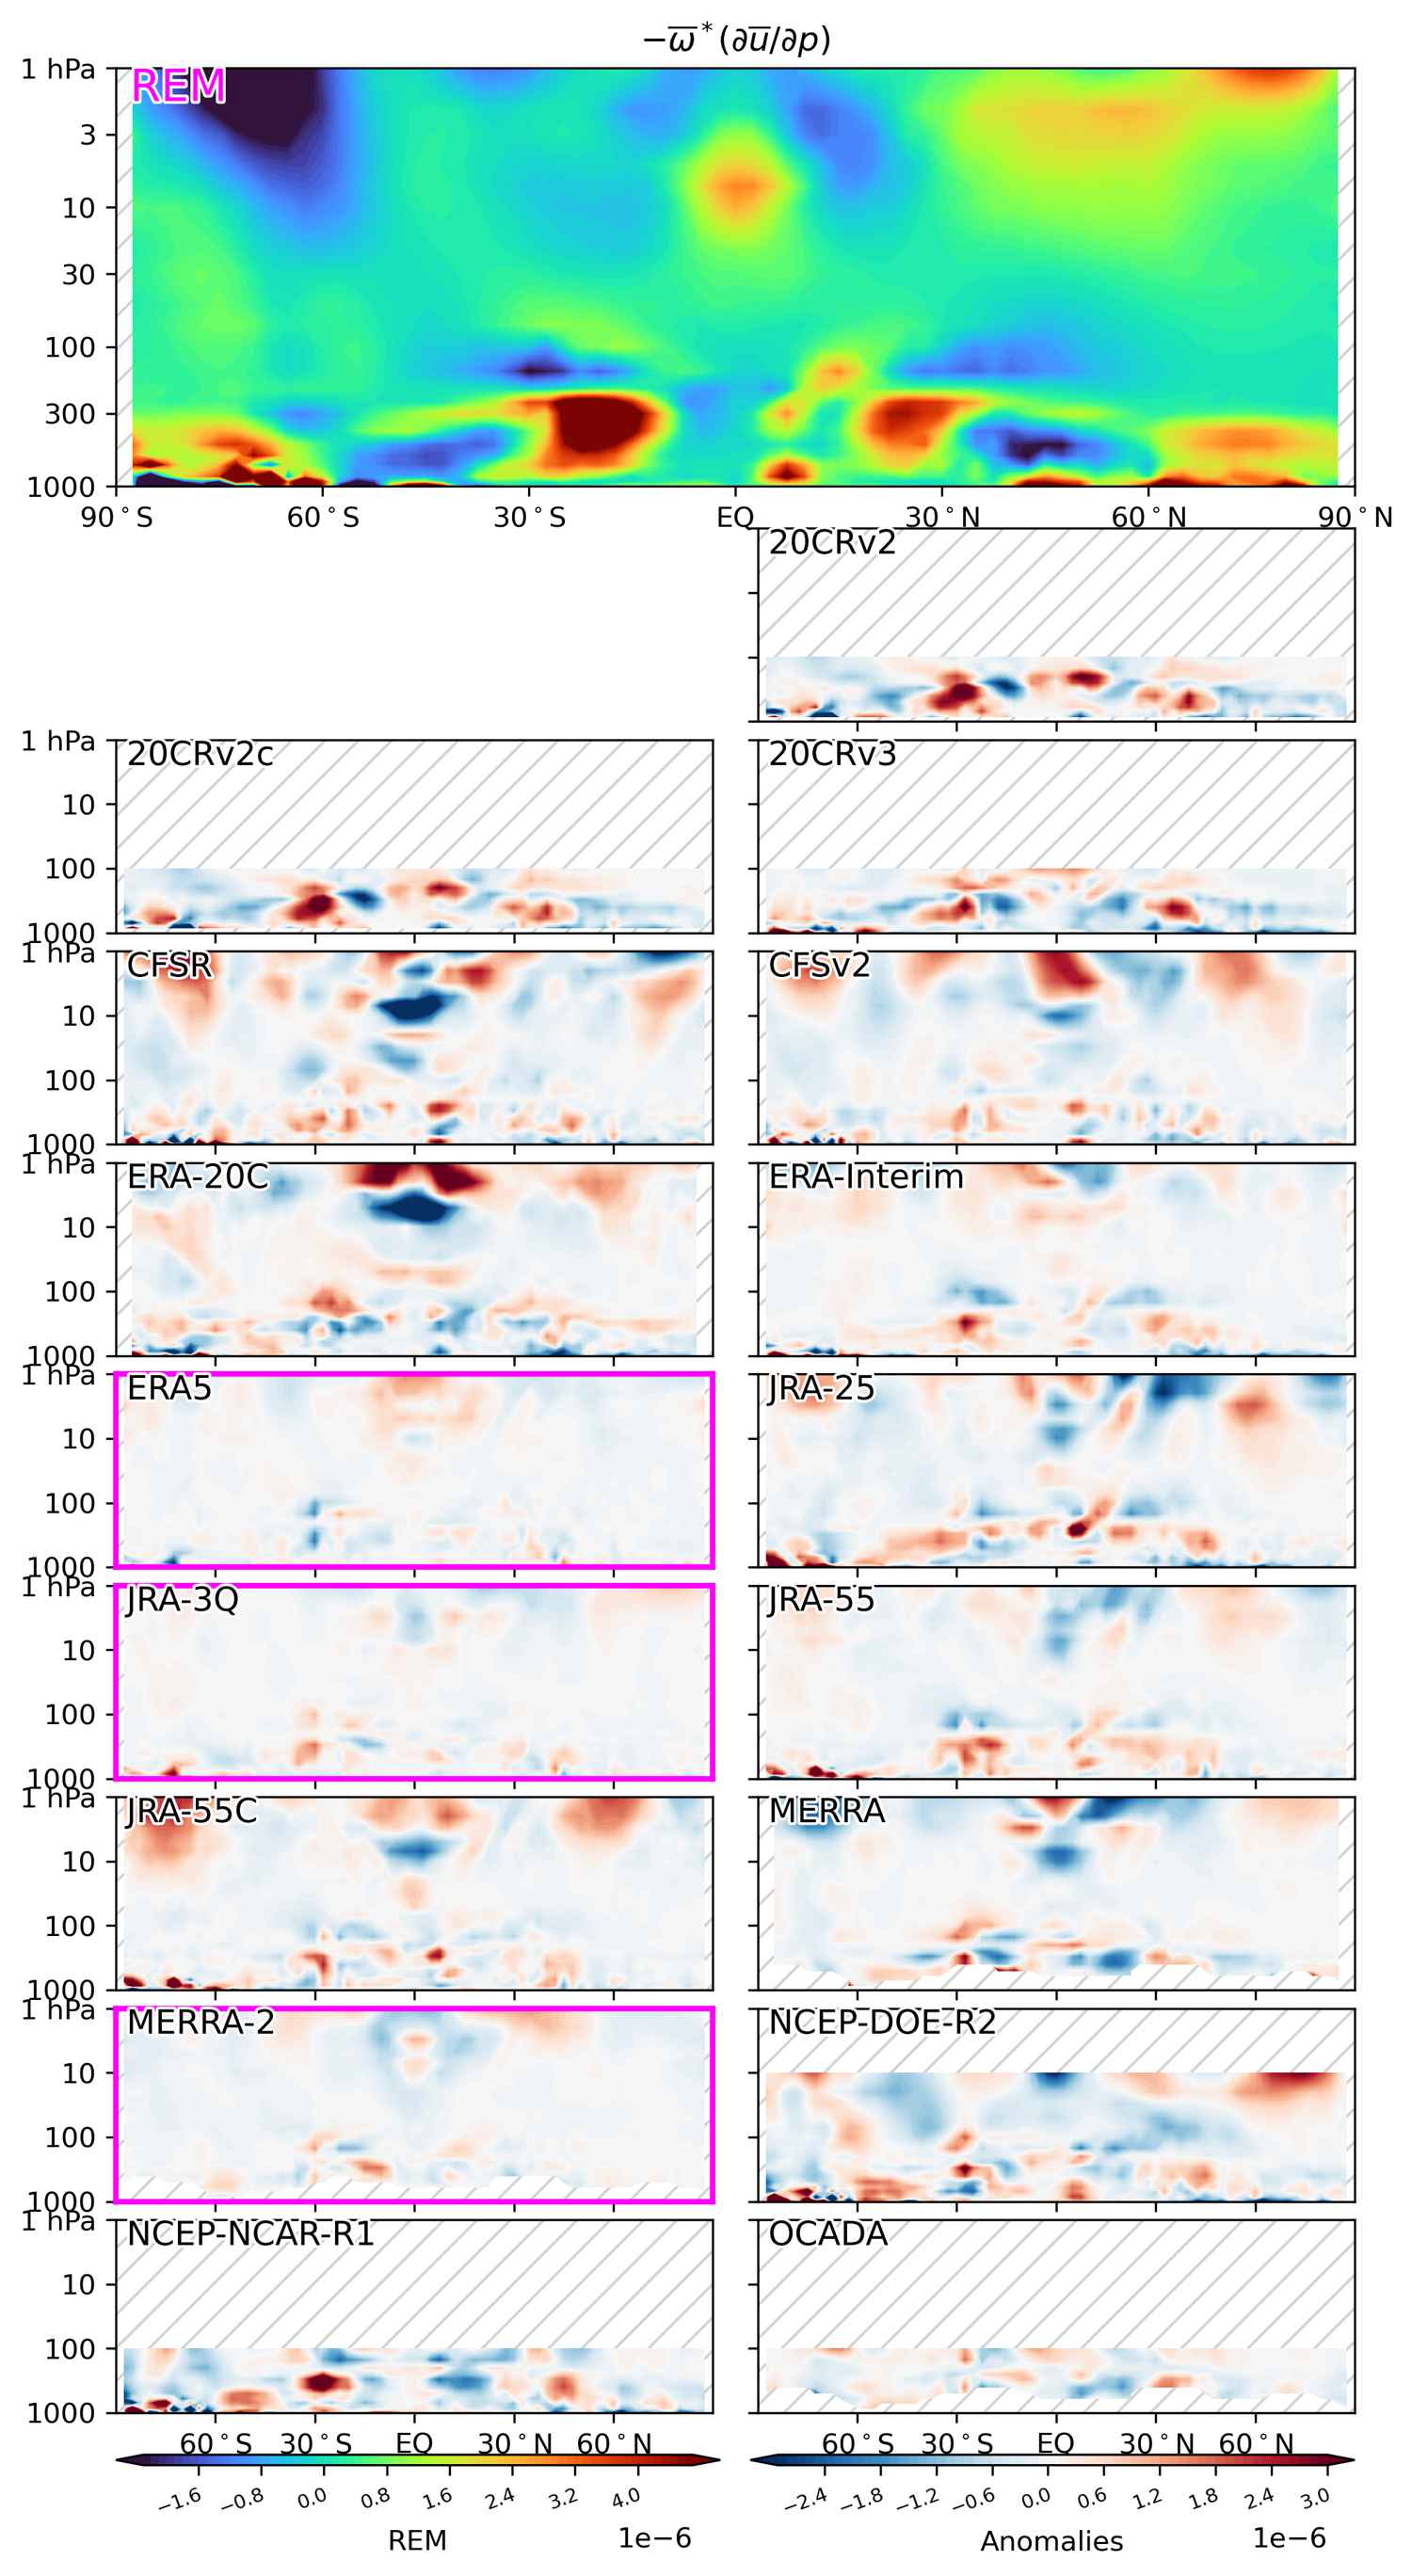
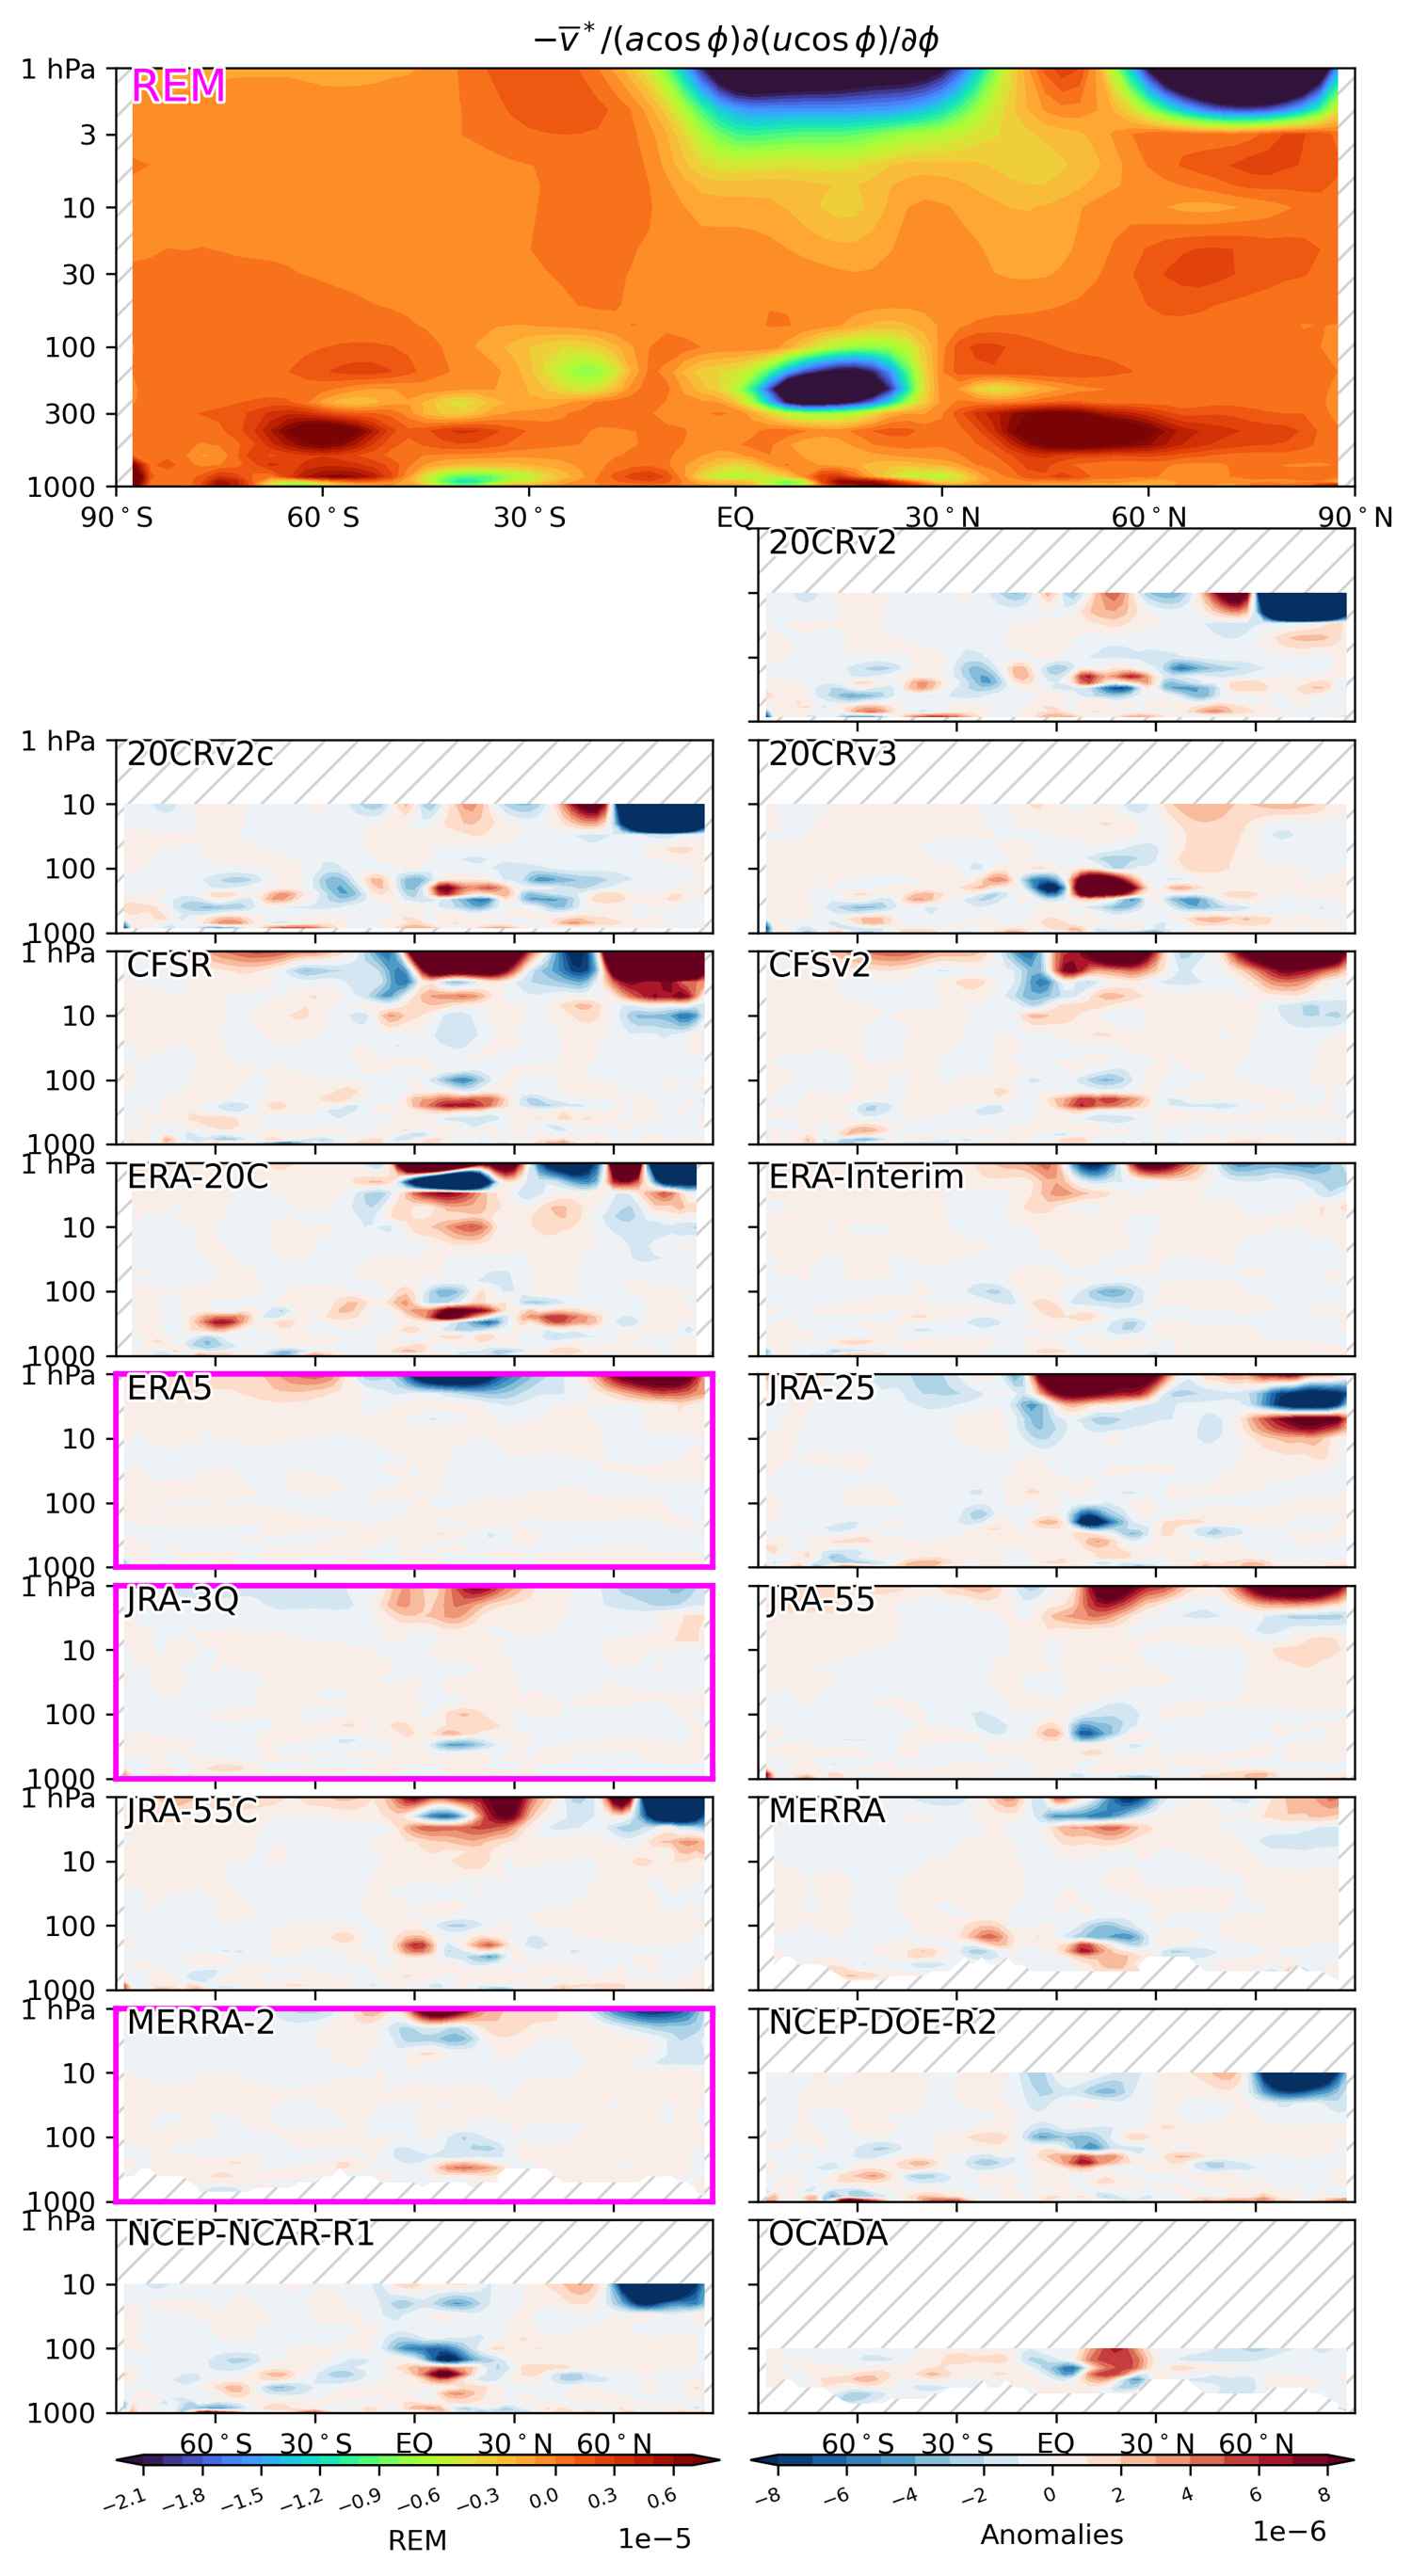
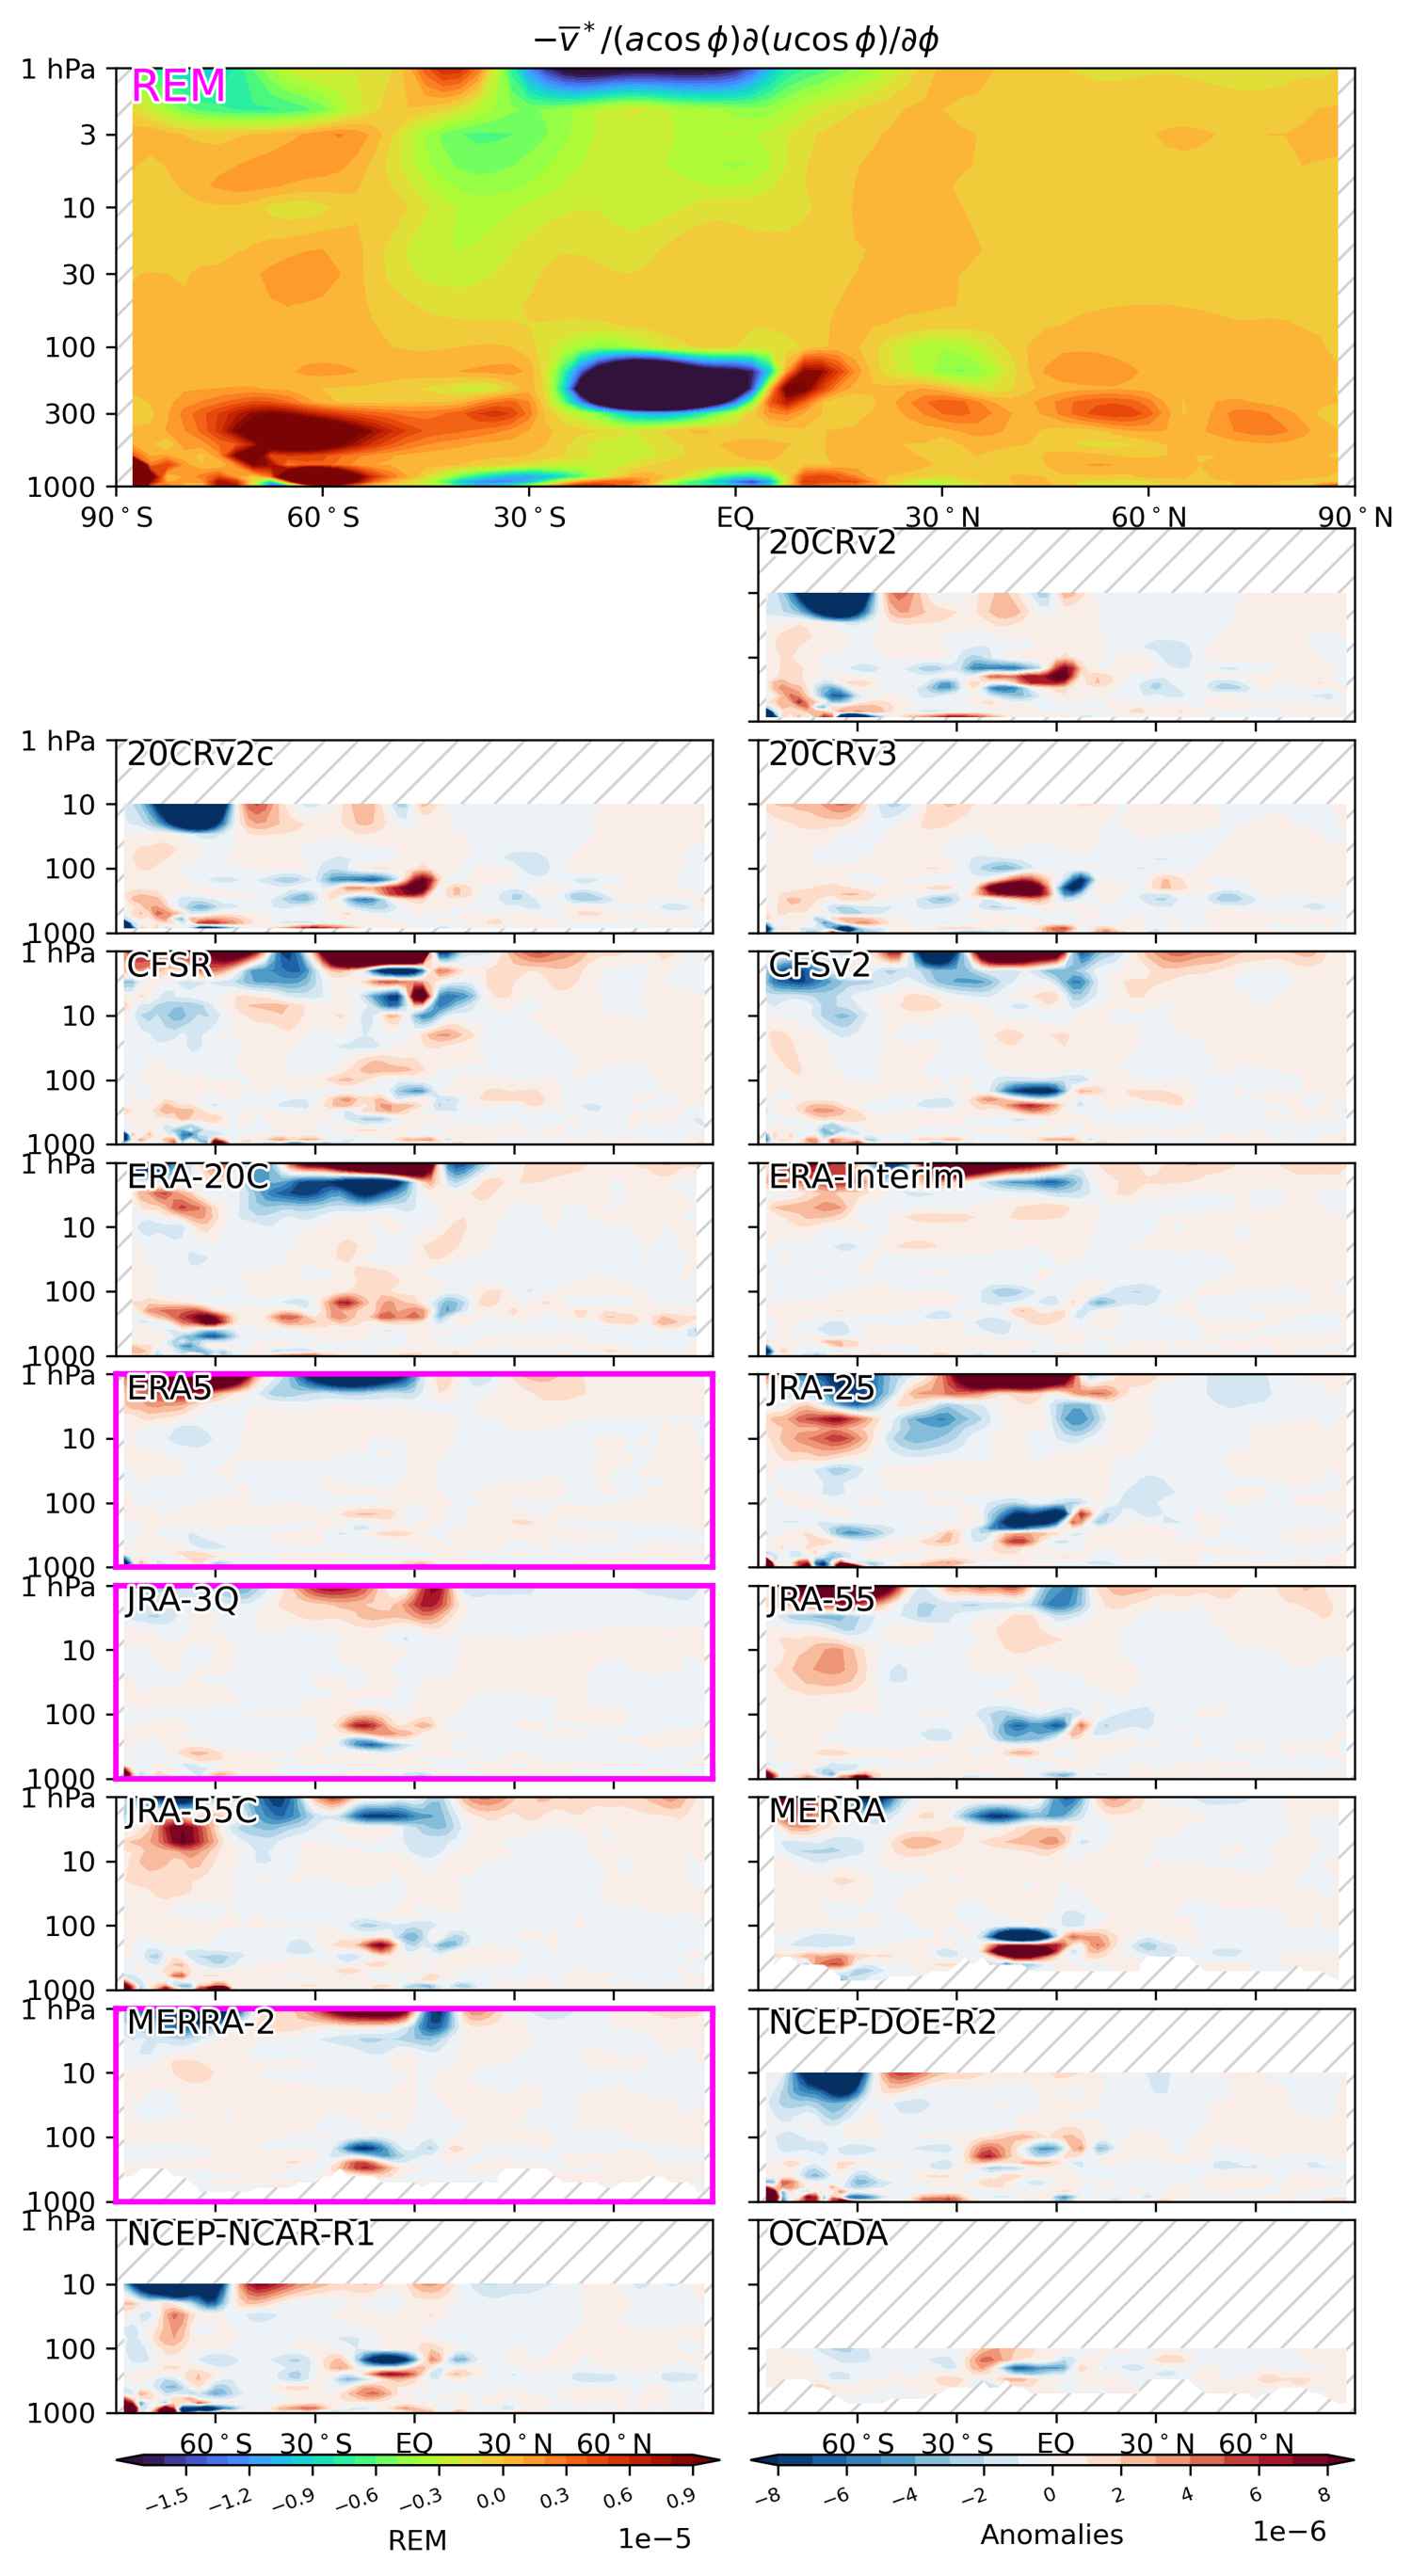
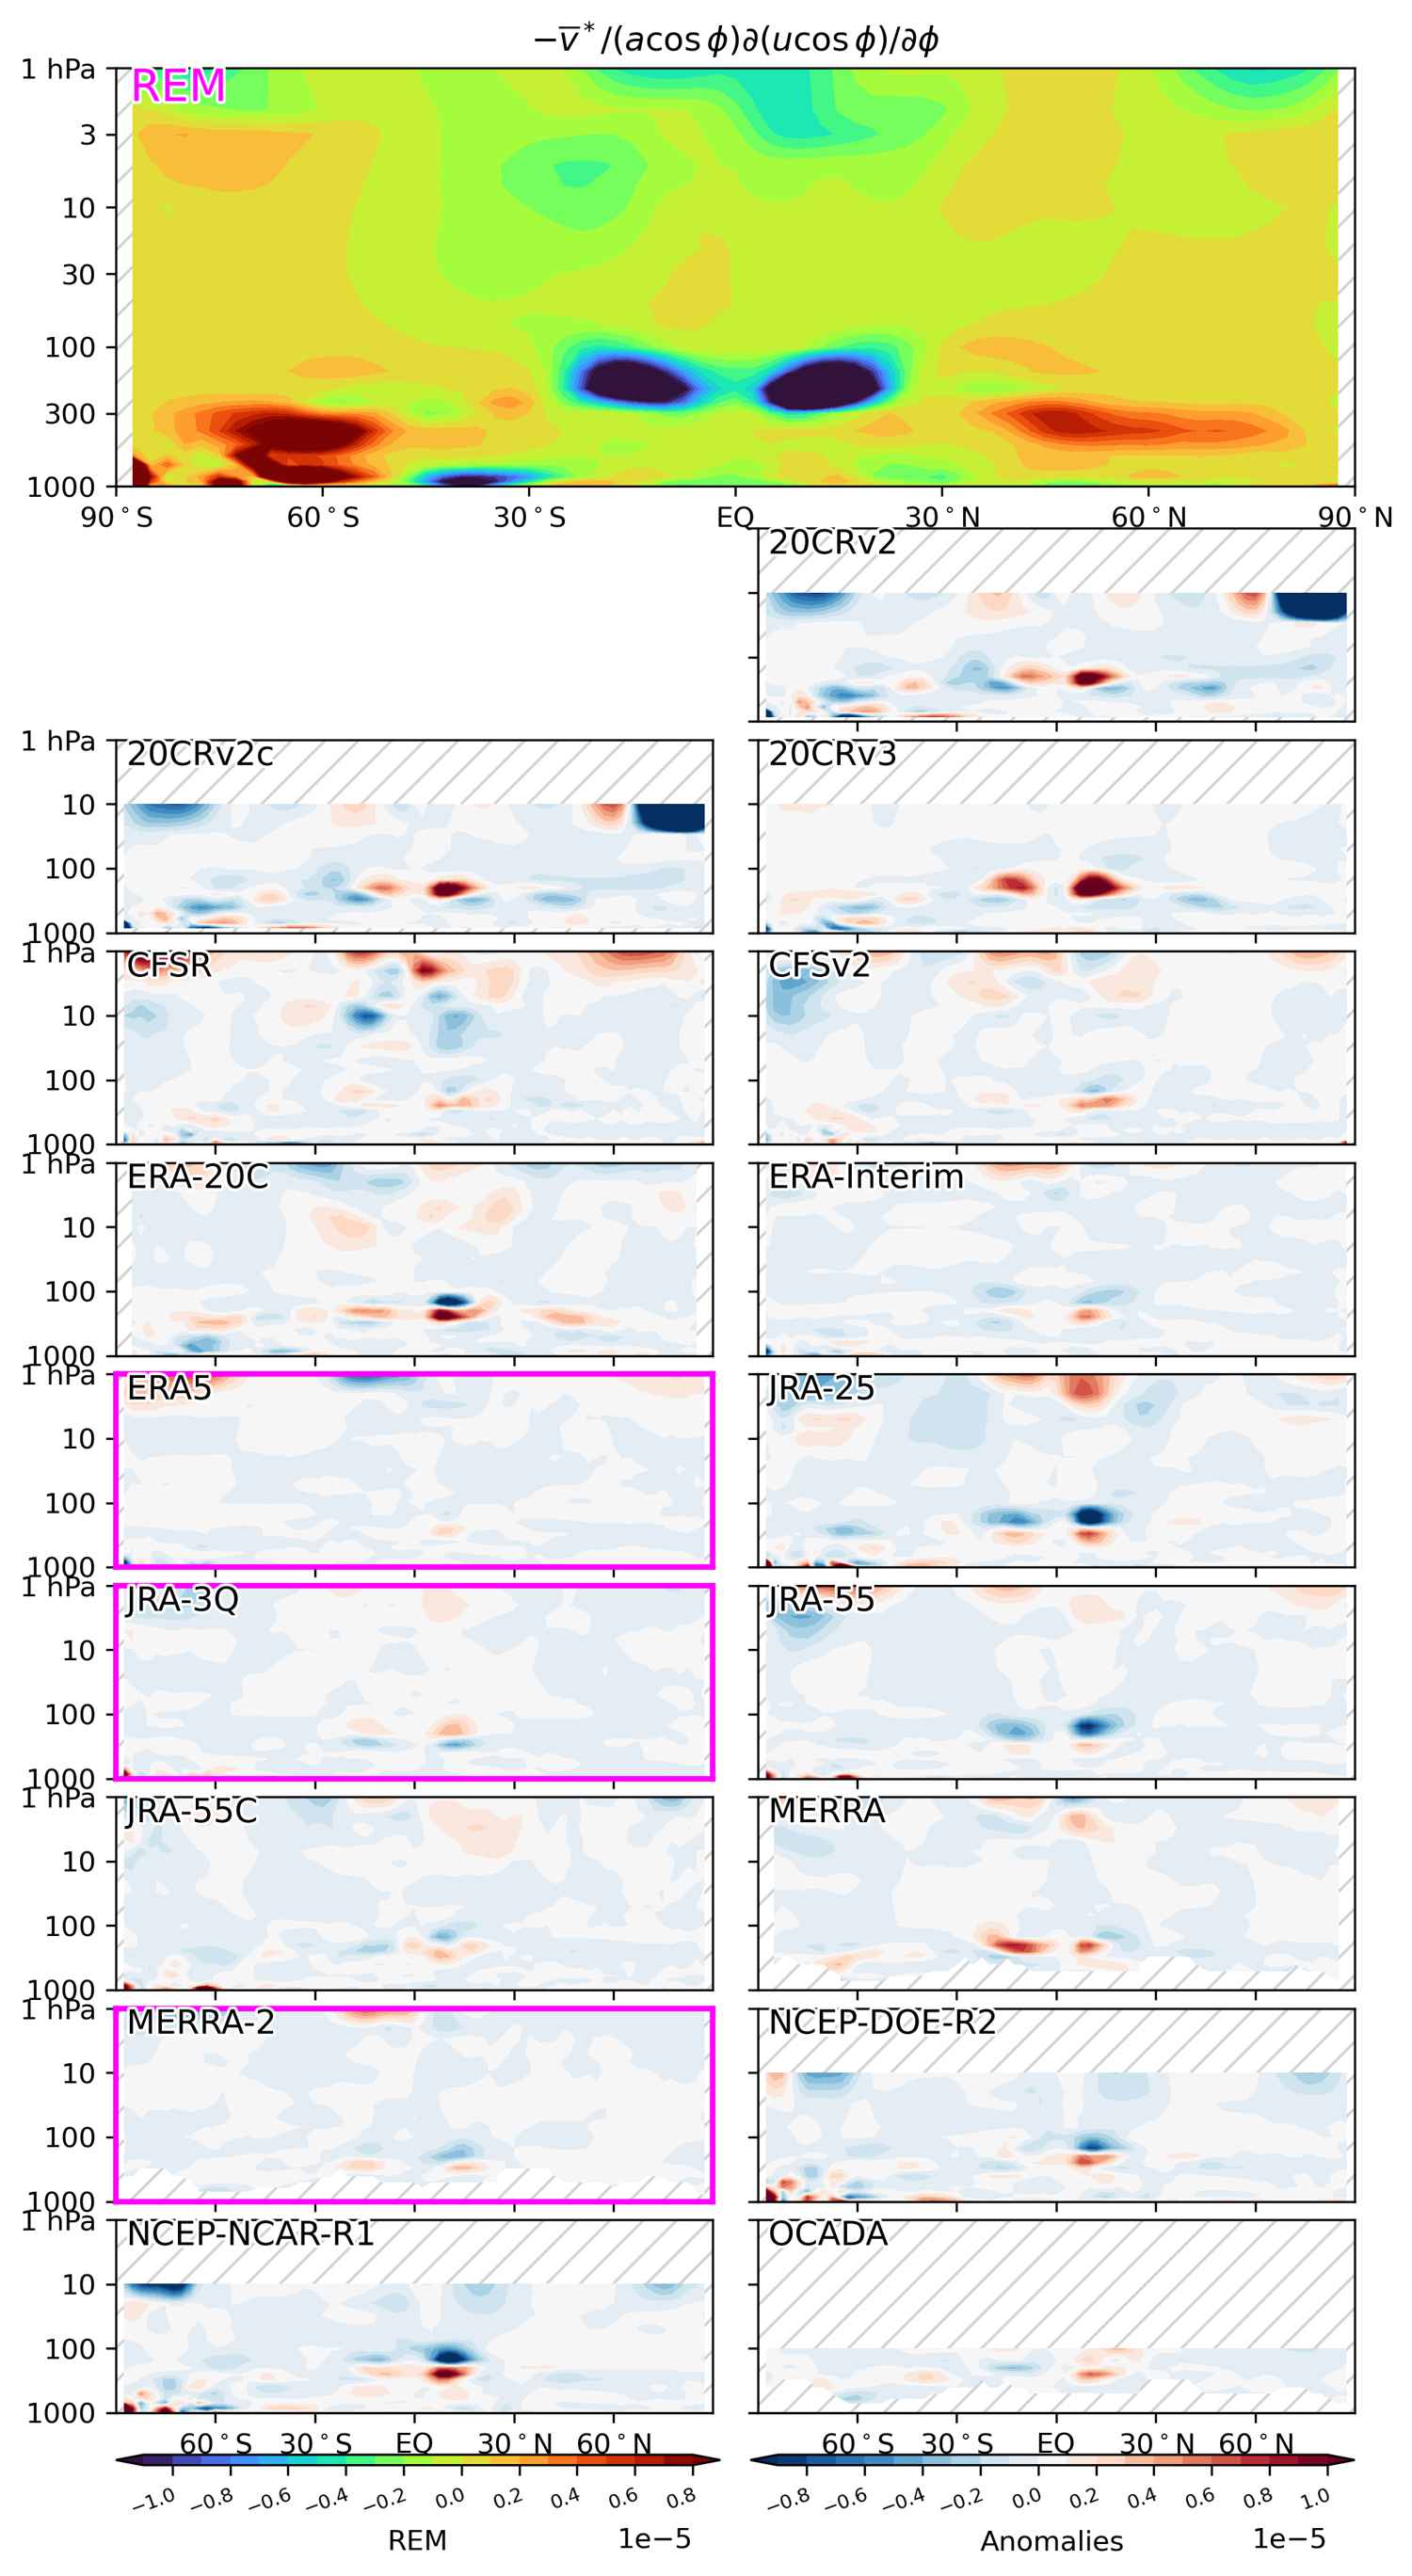
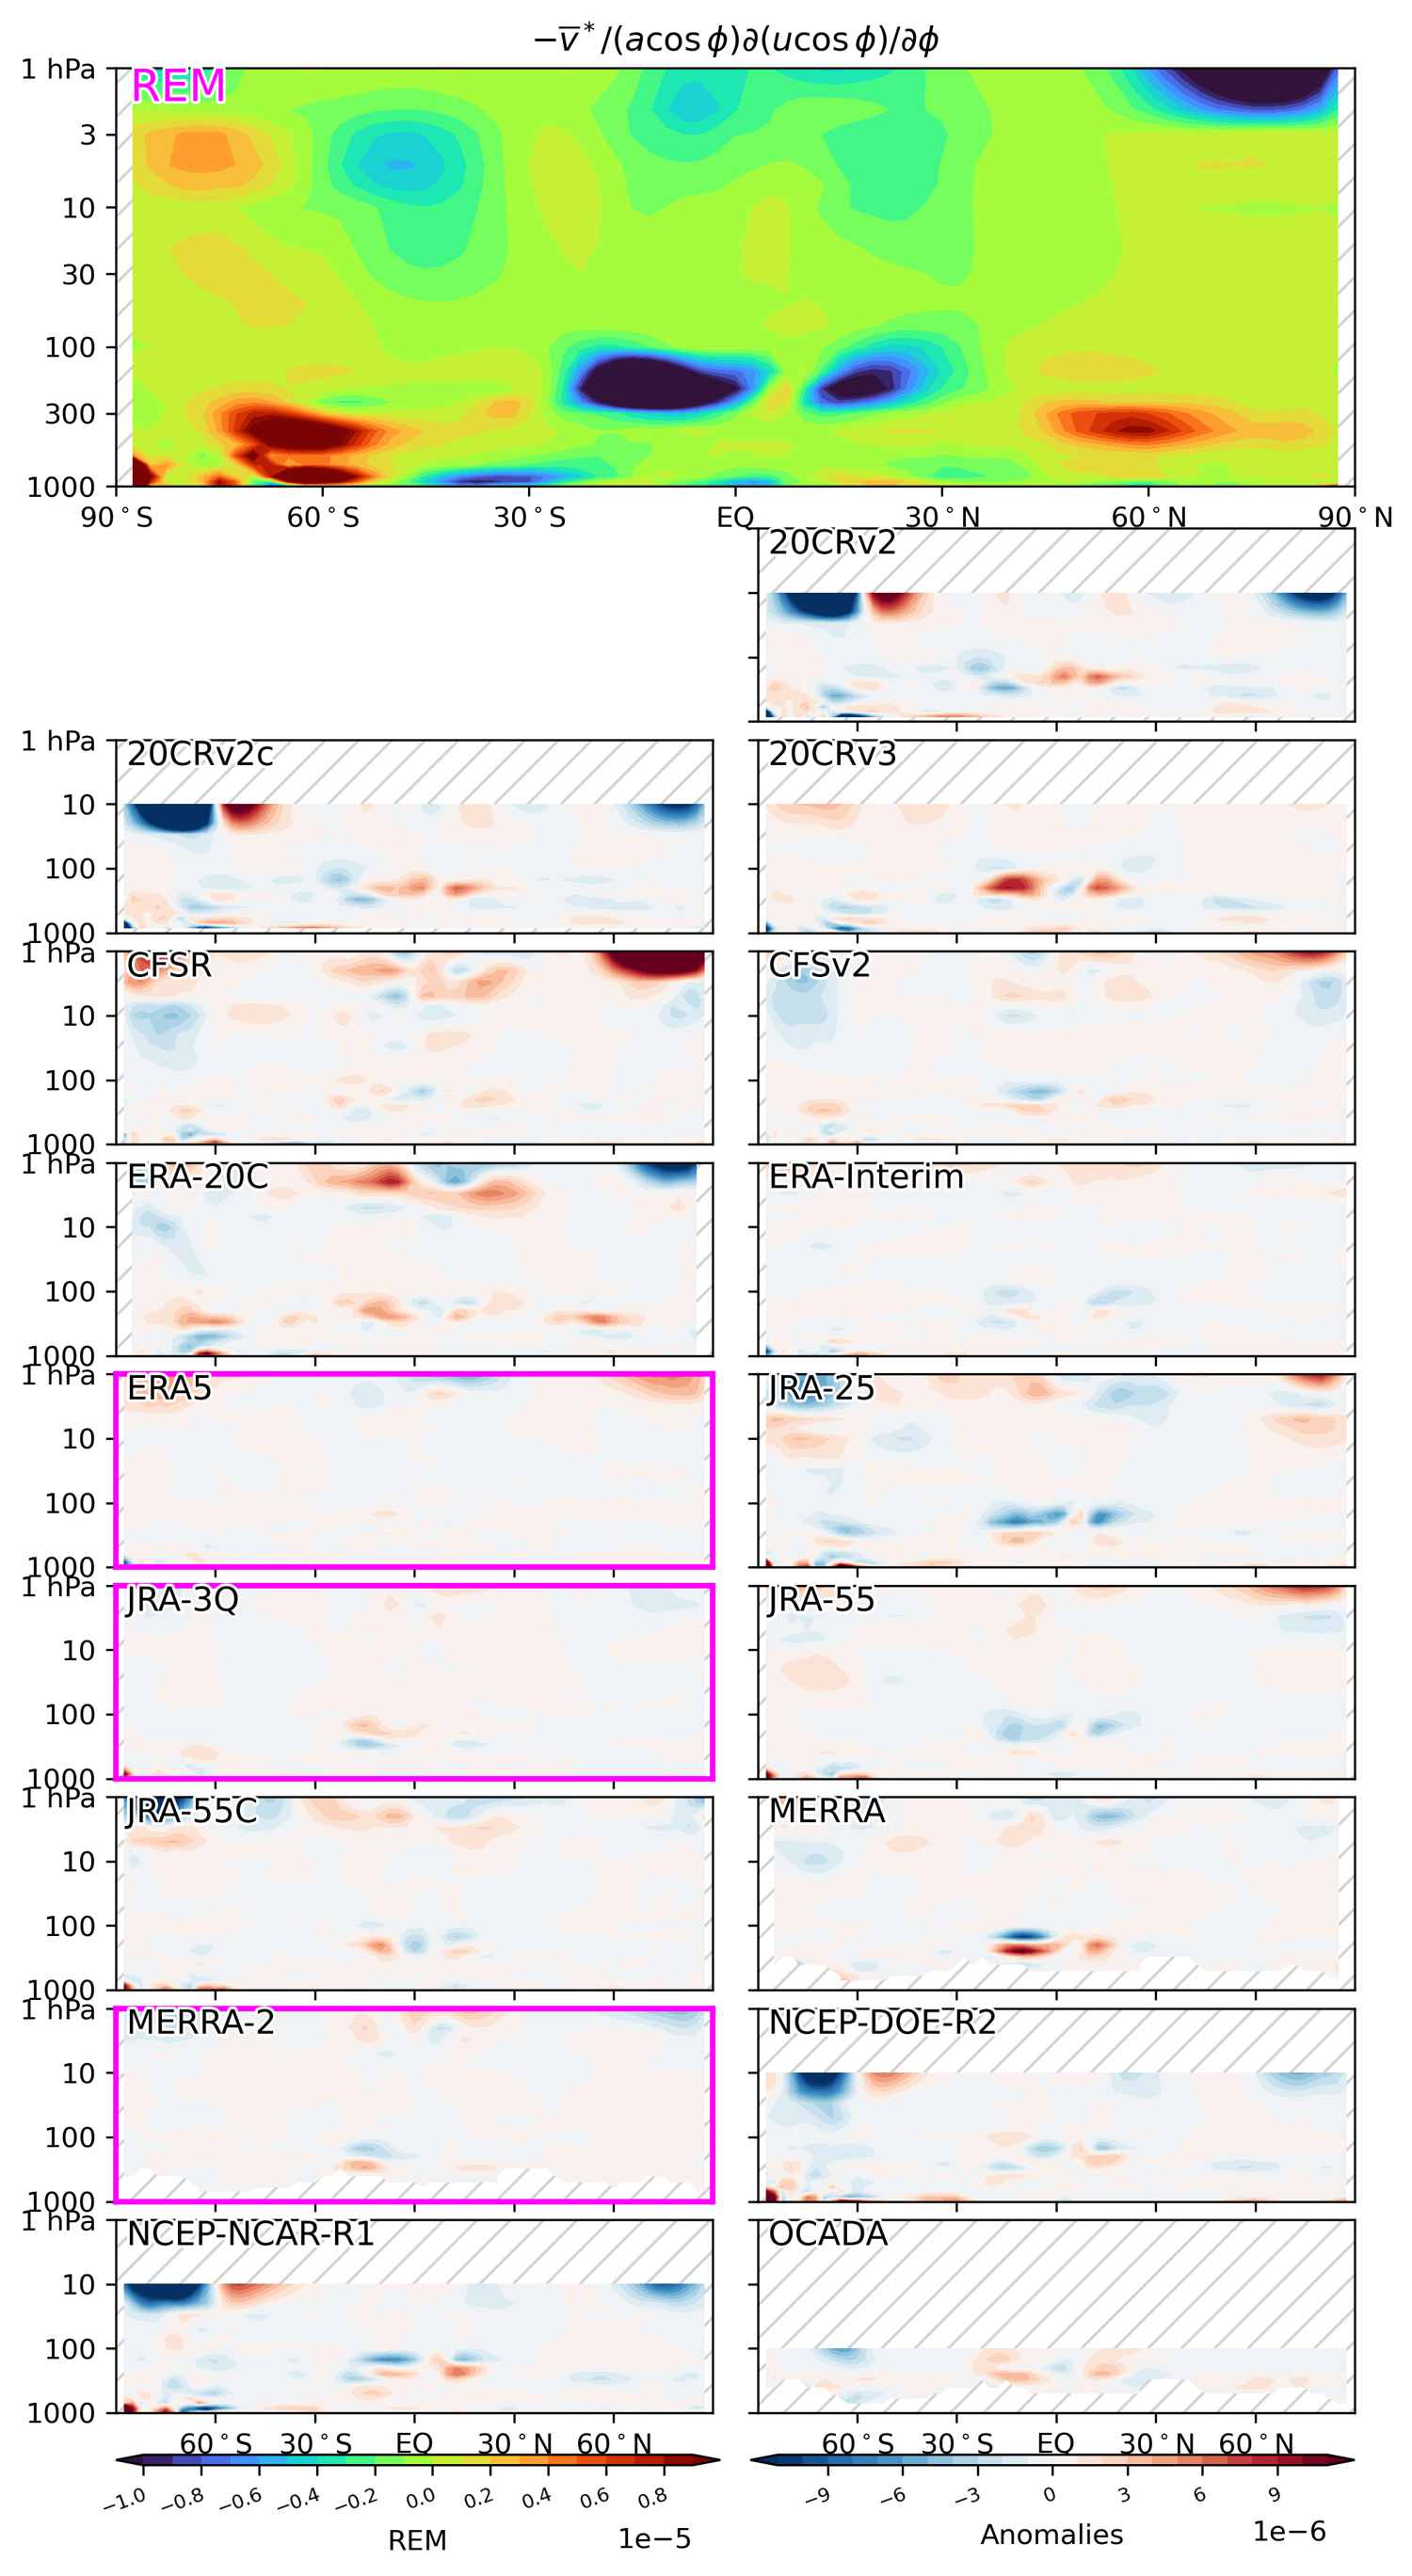
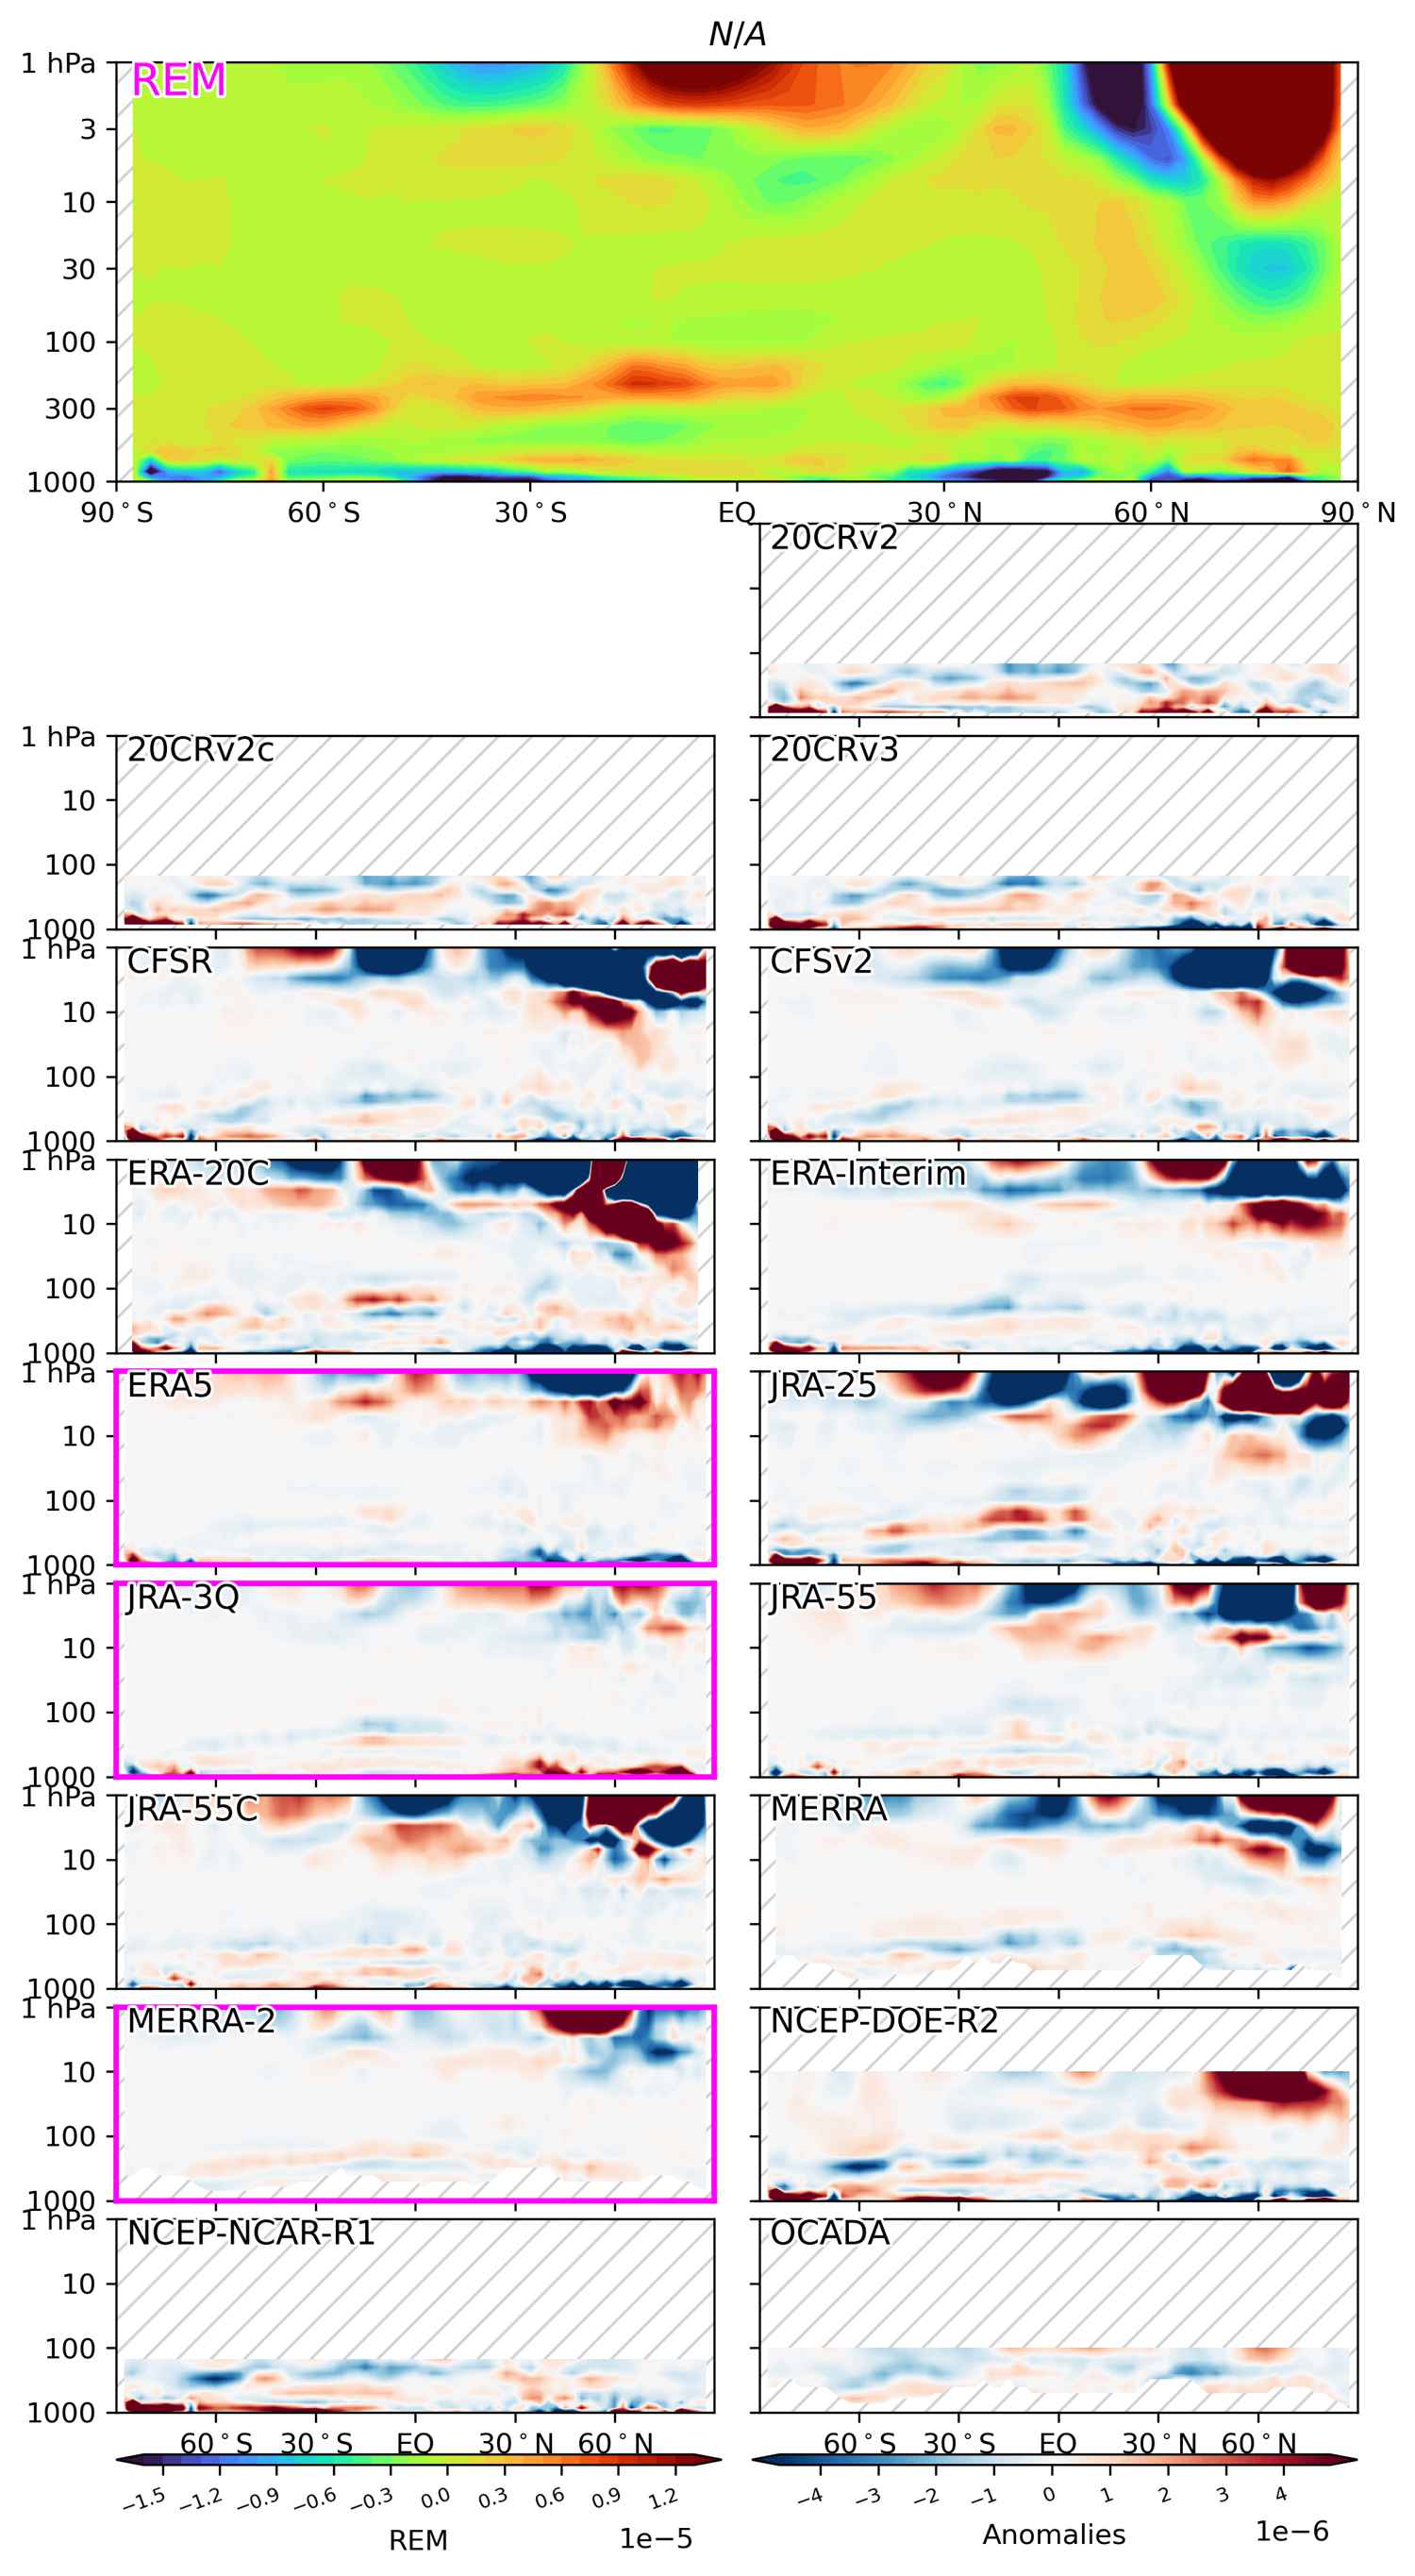 Pressure-latitude cross section of “Flux term (see Middle Atmosphere Dynamics by Andrews, Holton, Leovy [1987]))” in DJF for (top) the reanalysis ensemble mean (REM) averaged over 2010-2020. (below) The same for individual reanalyses. Reanalysis datasets included in the REM are indicated with a magenta border.
| Period | 2010-2020 |
|---|---|
| Season | |
| DJF | |
| JJA | 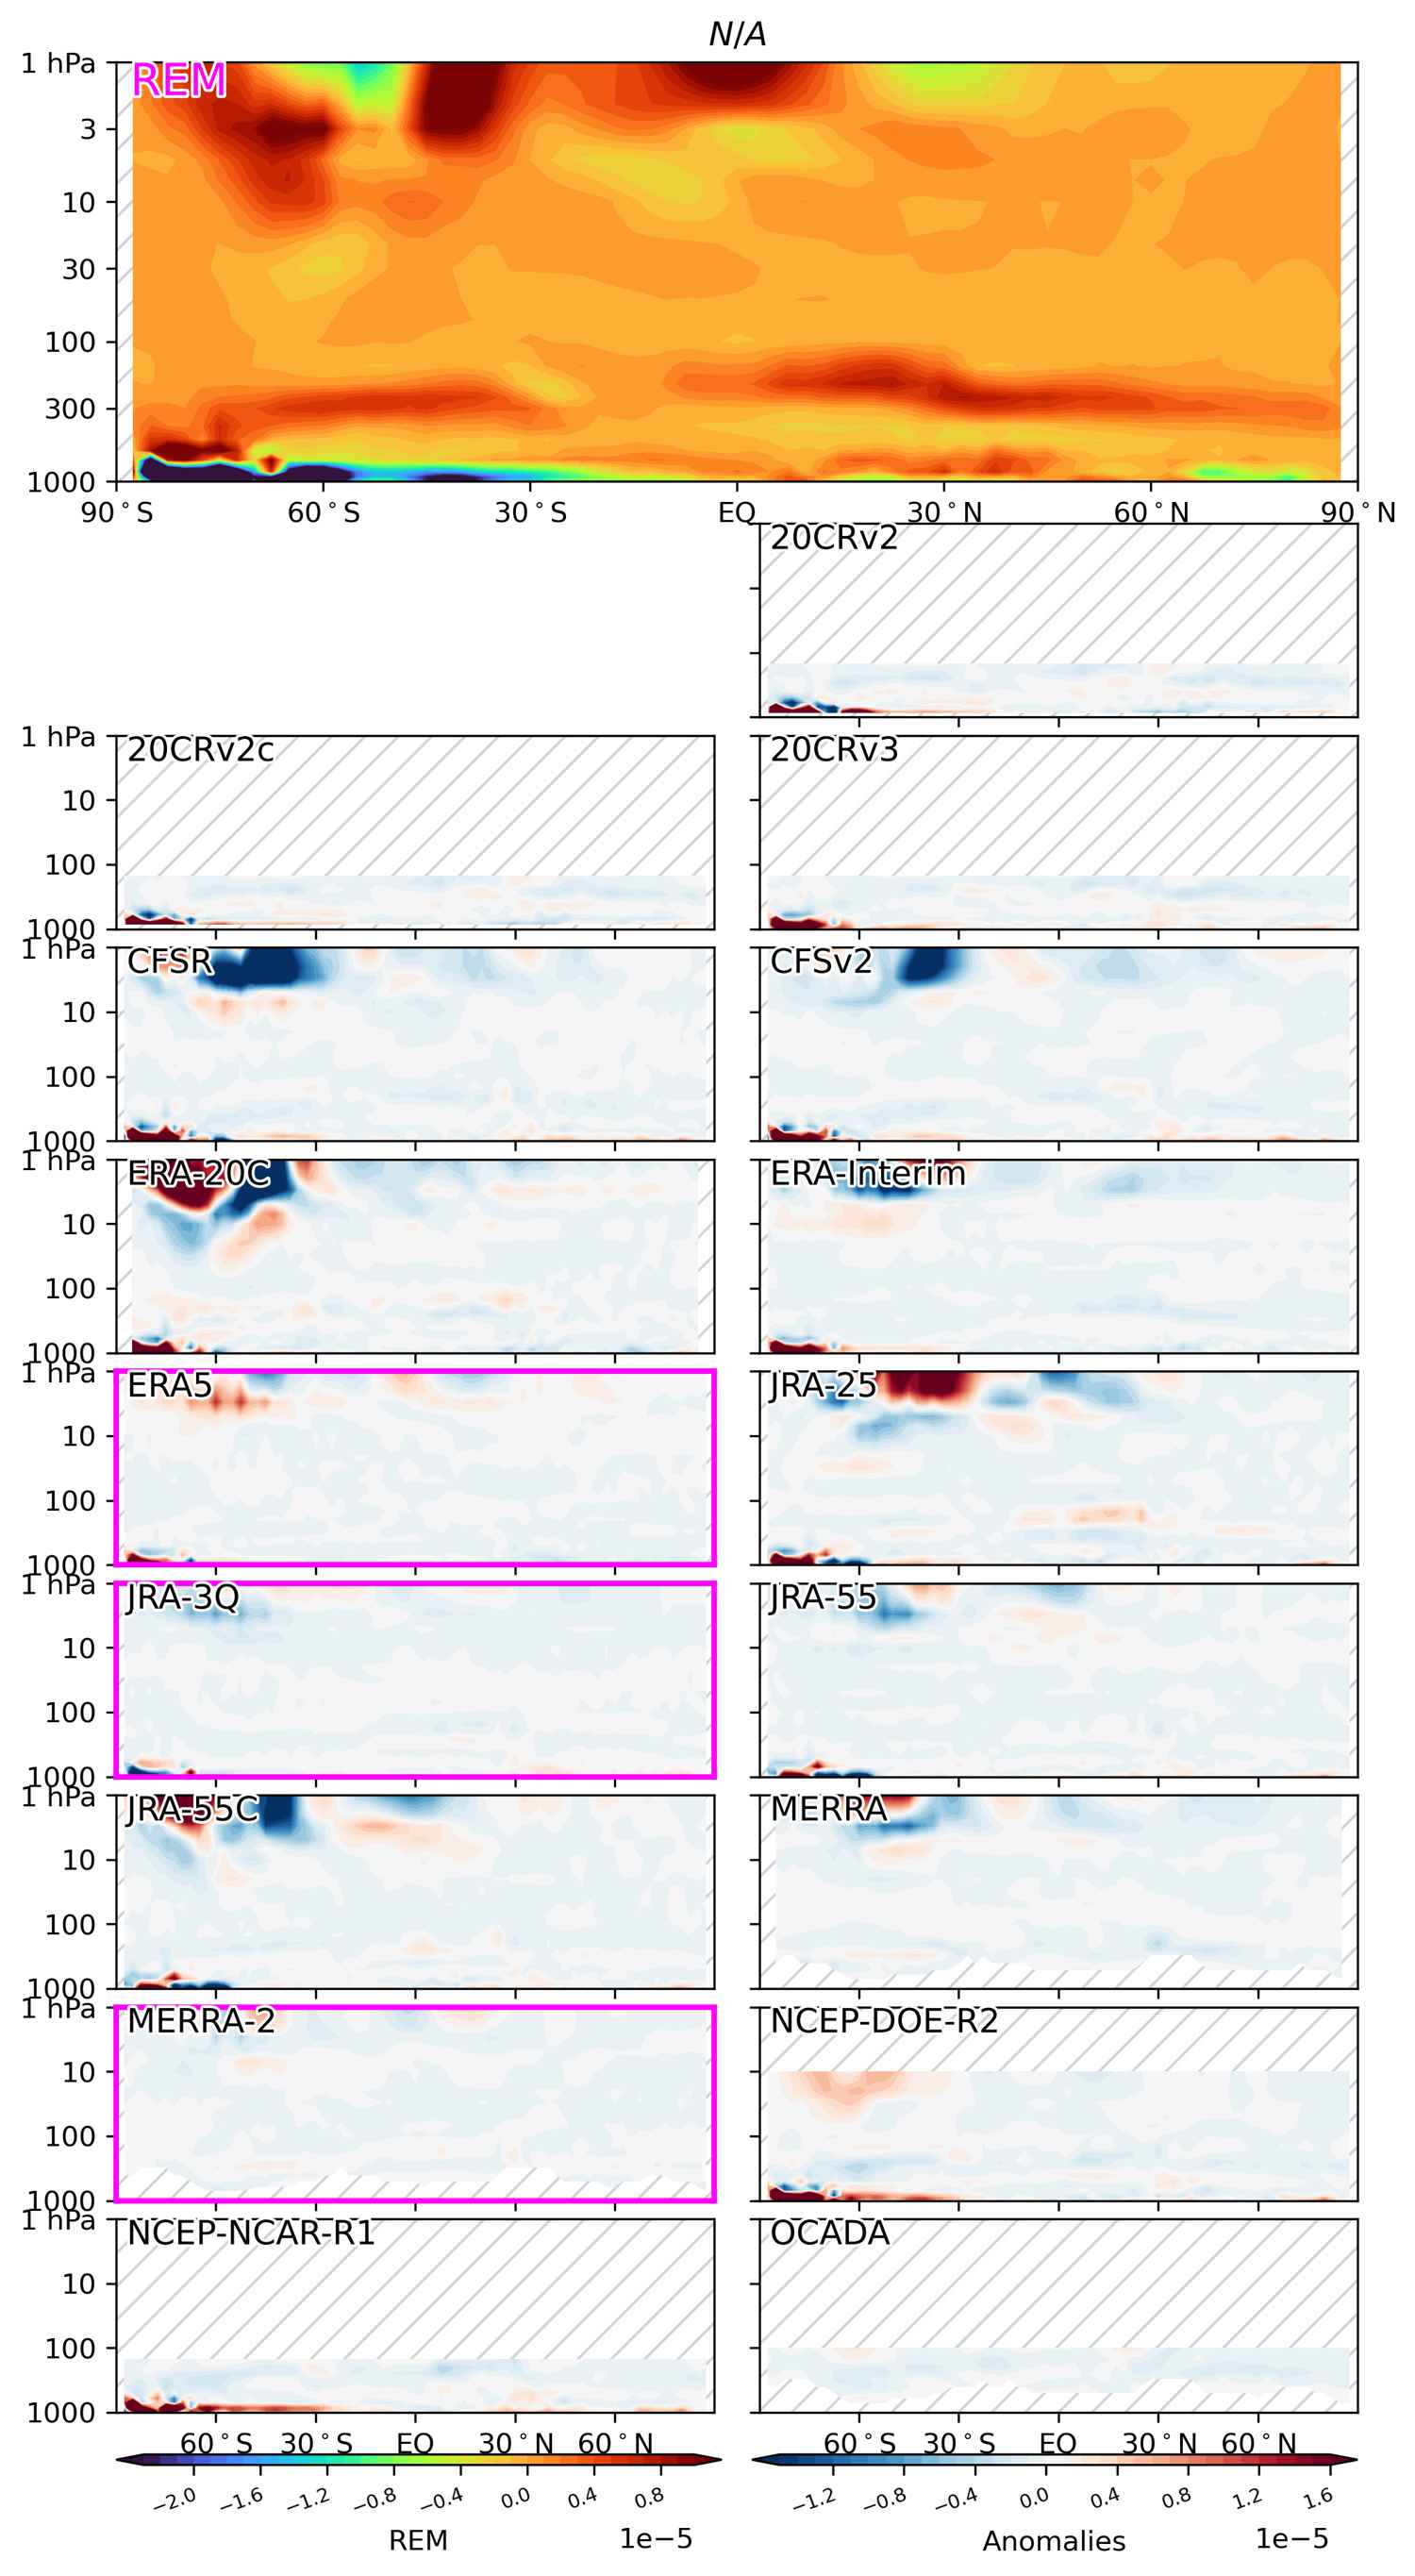 |
| MAM | 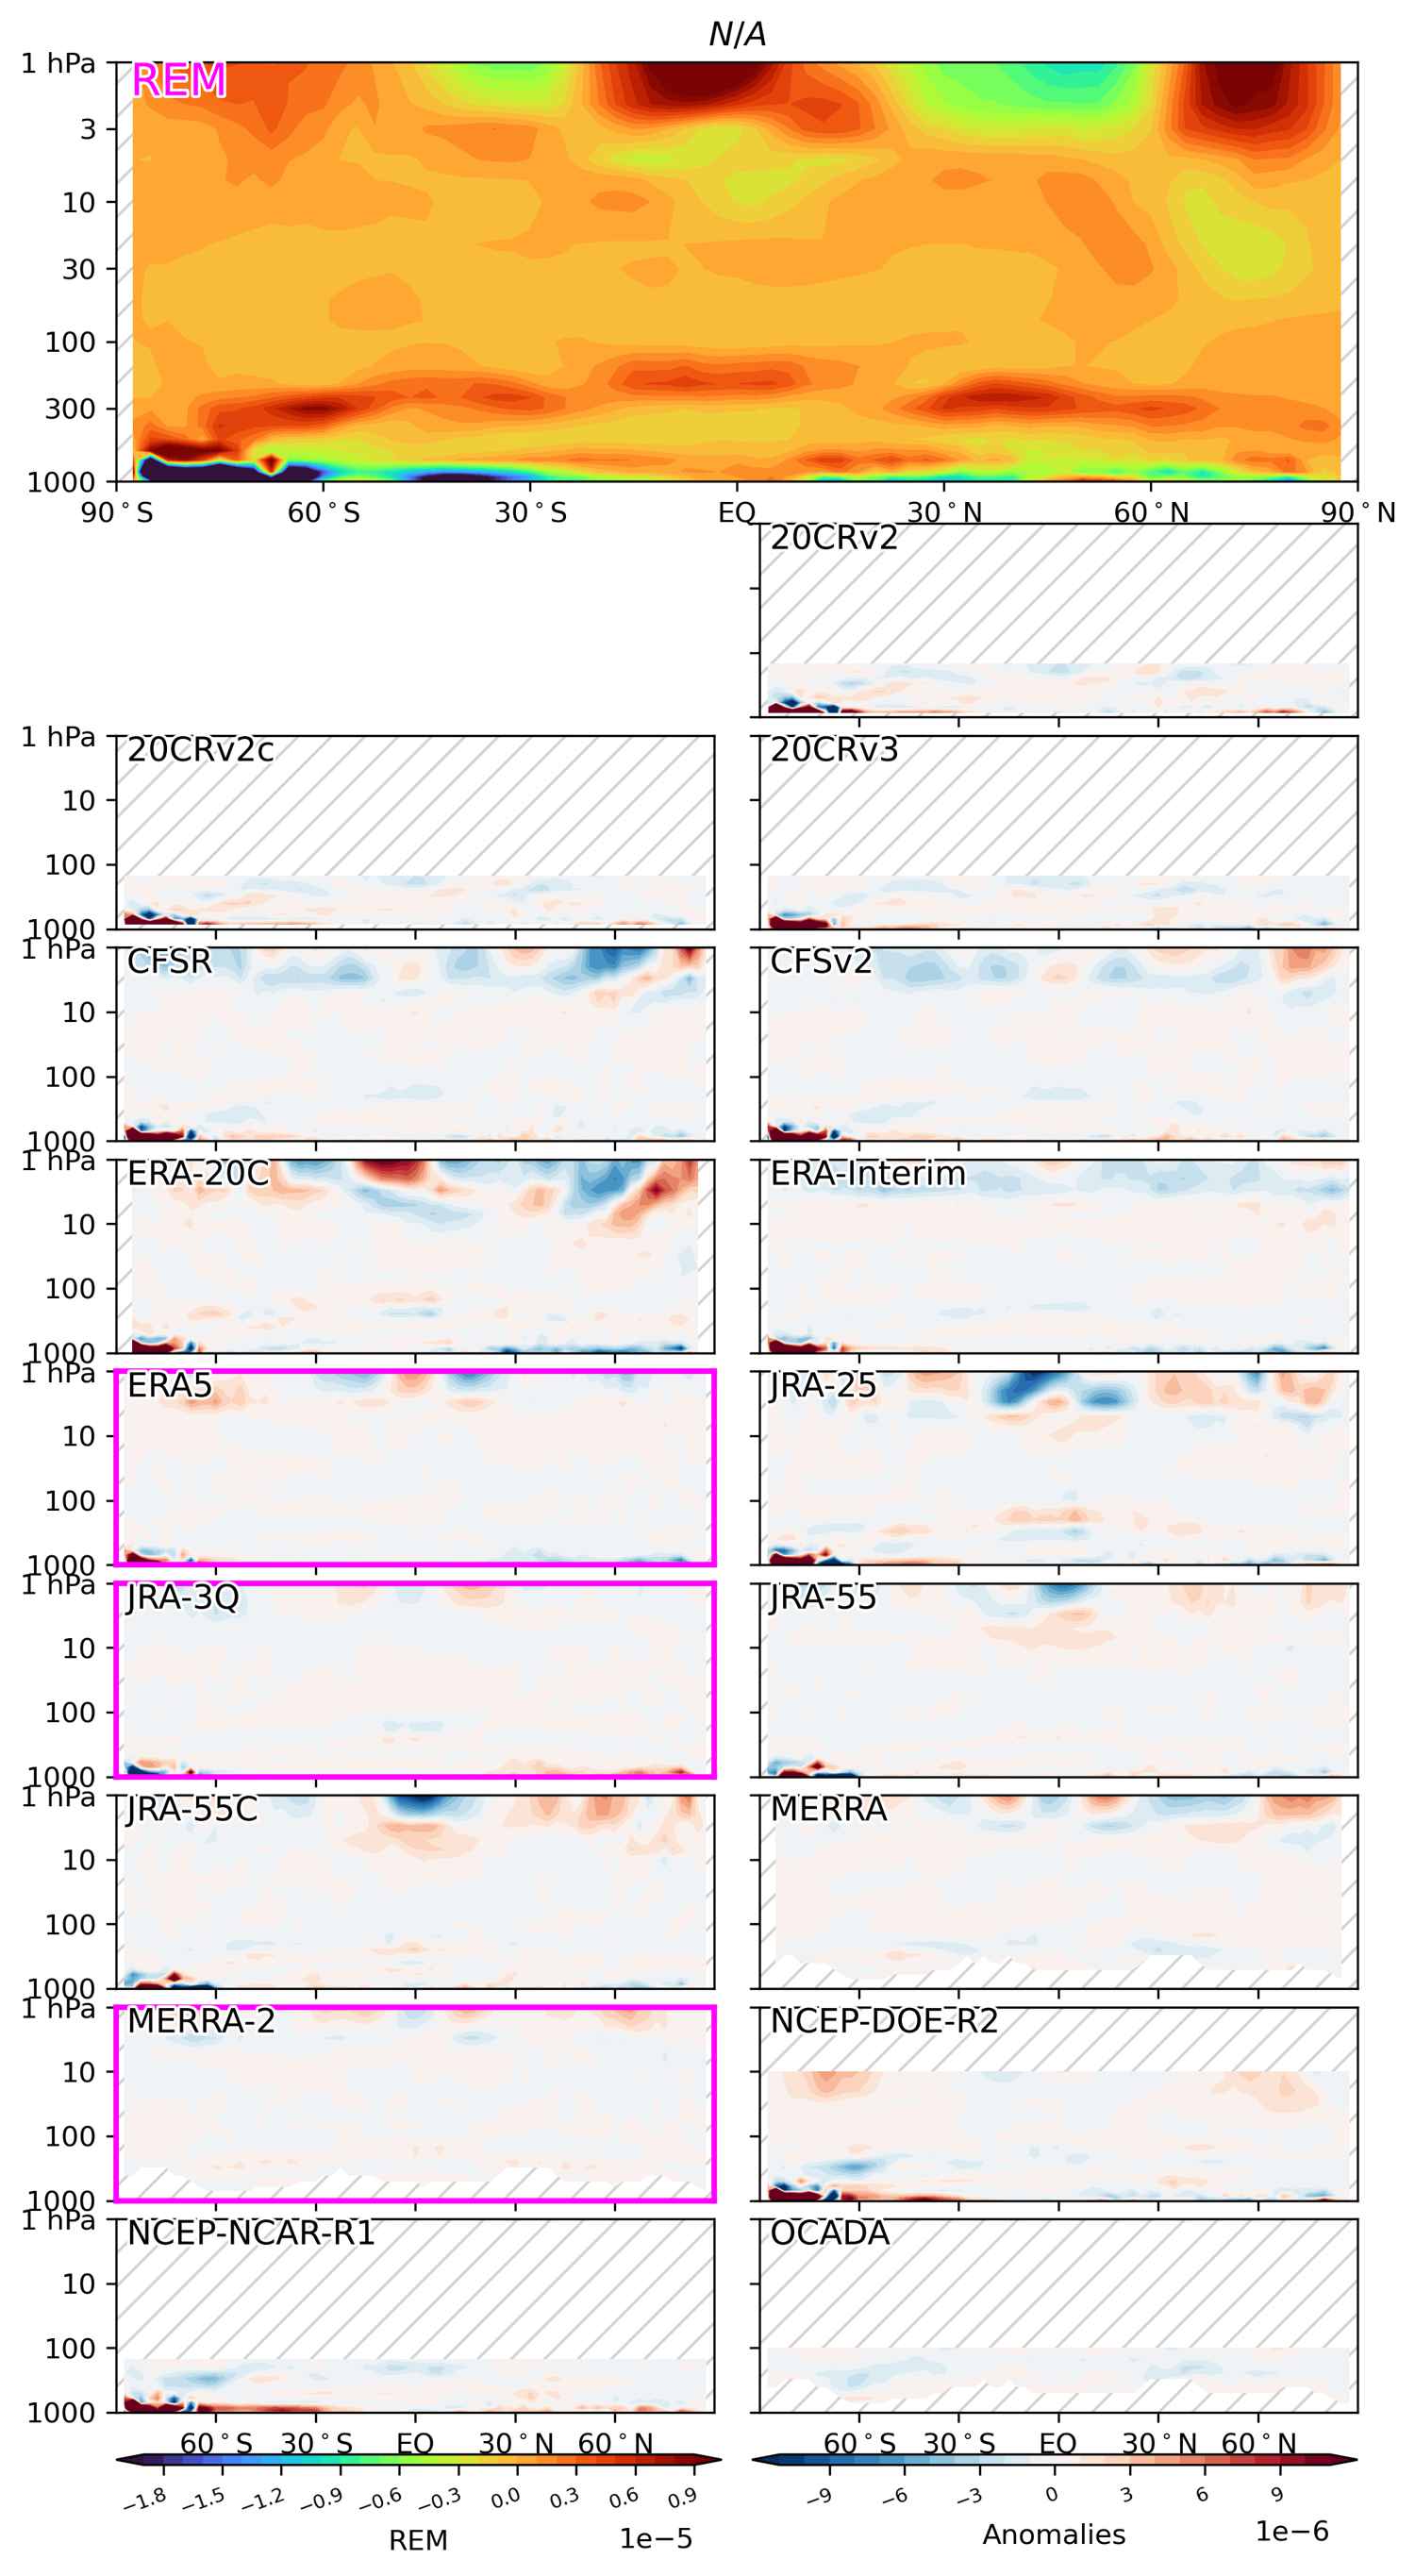 |
| SON | 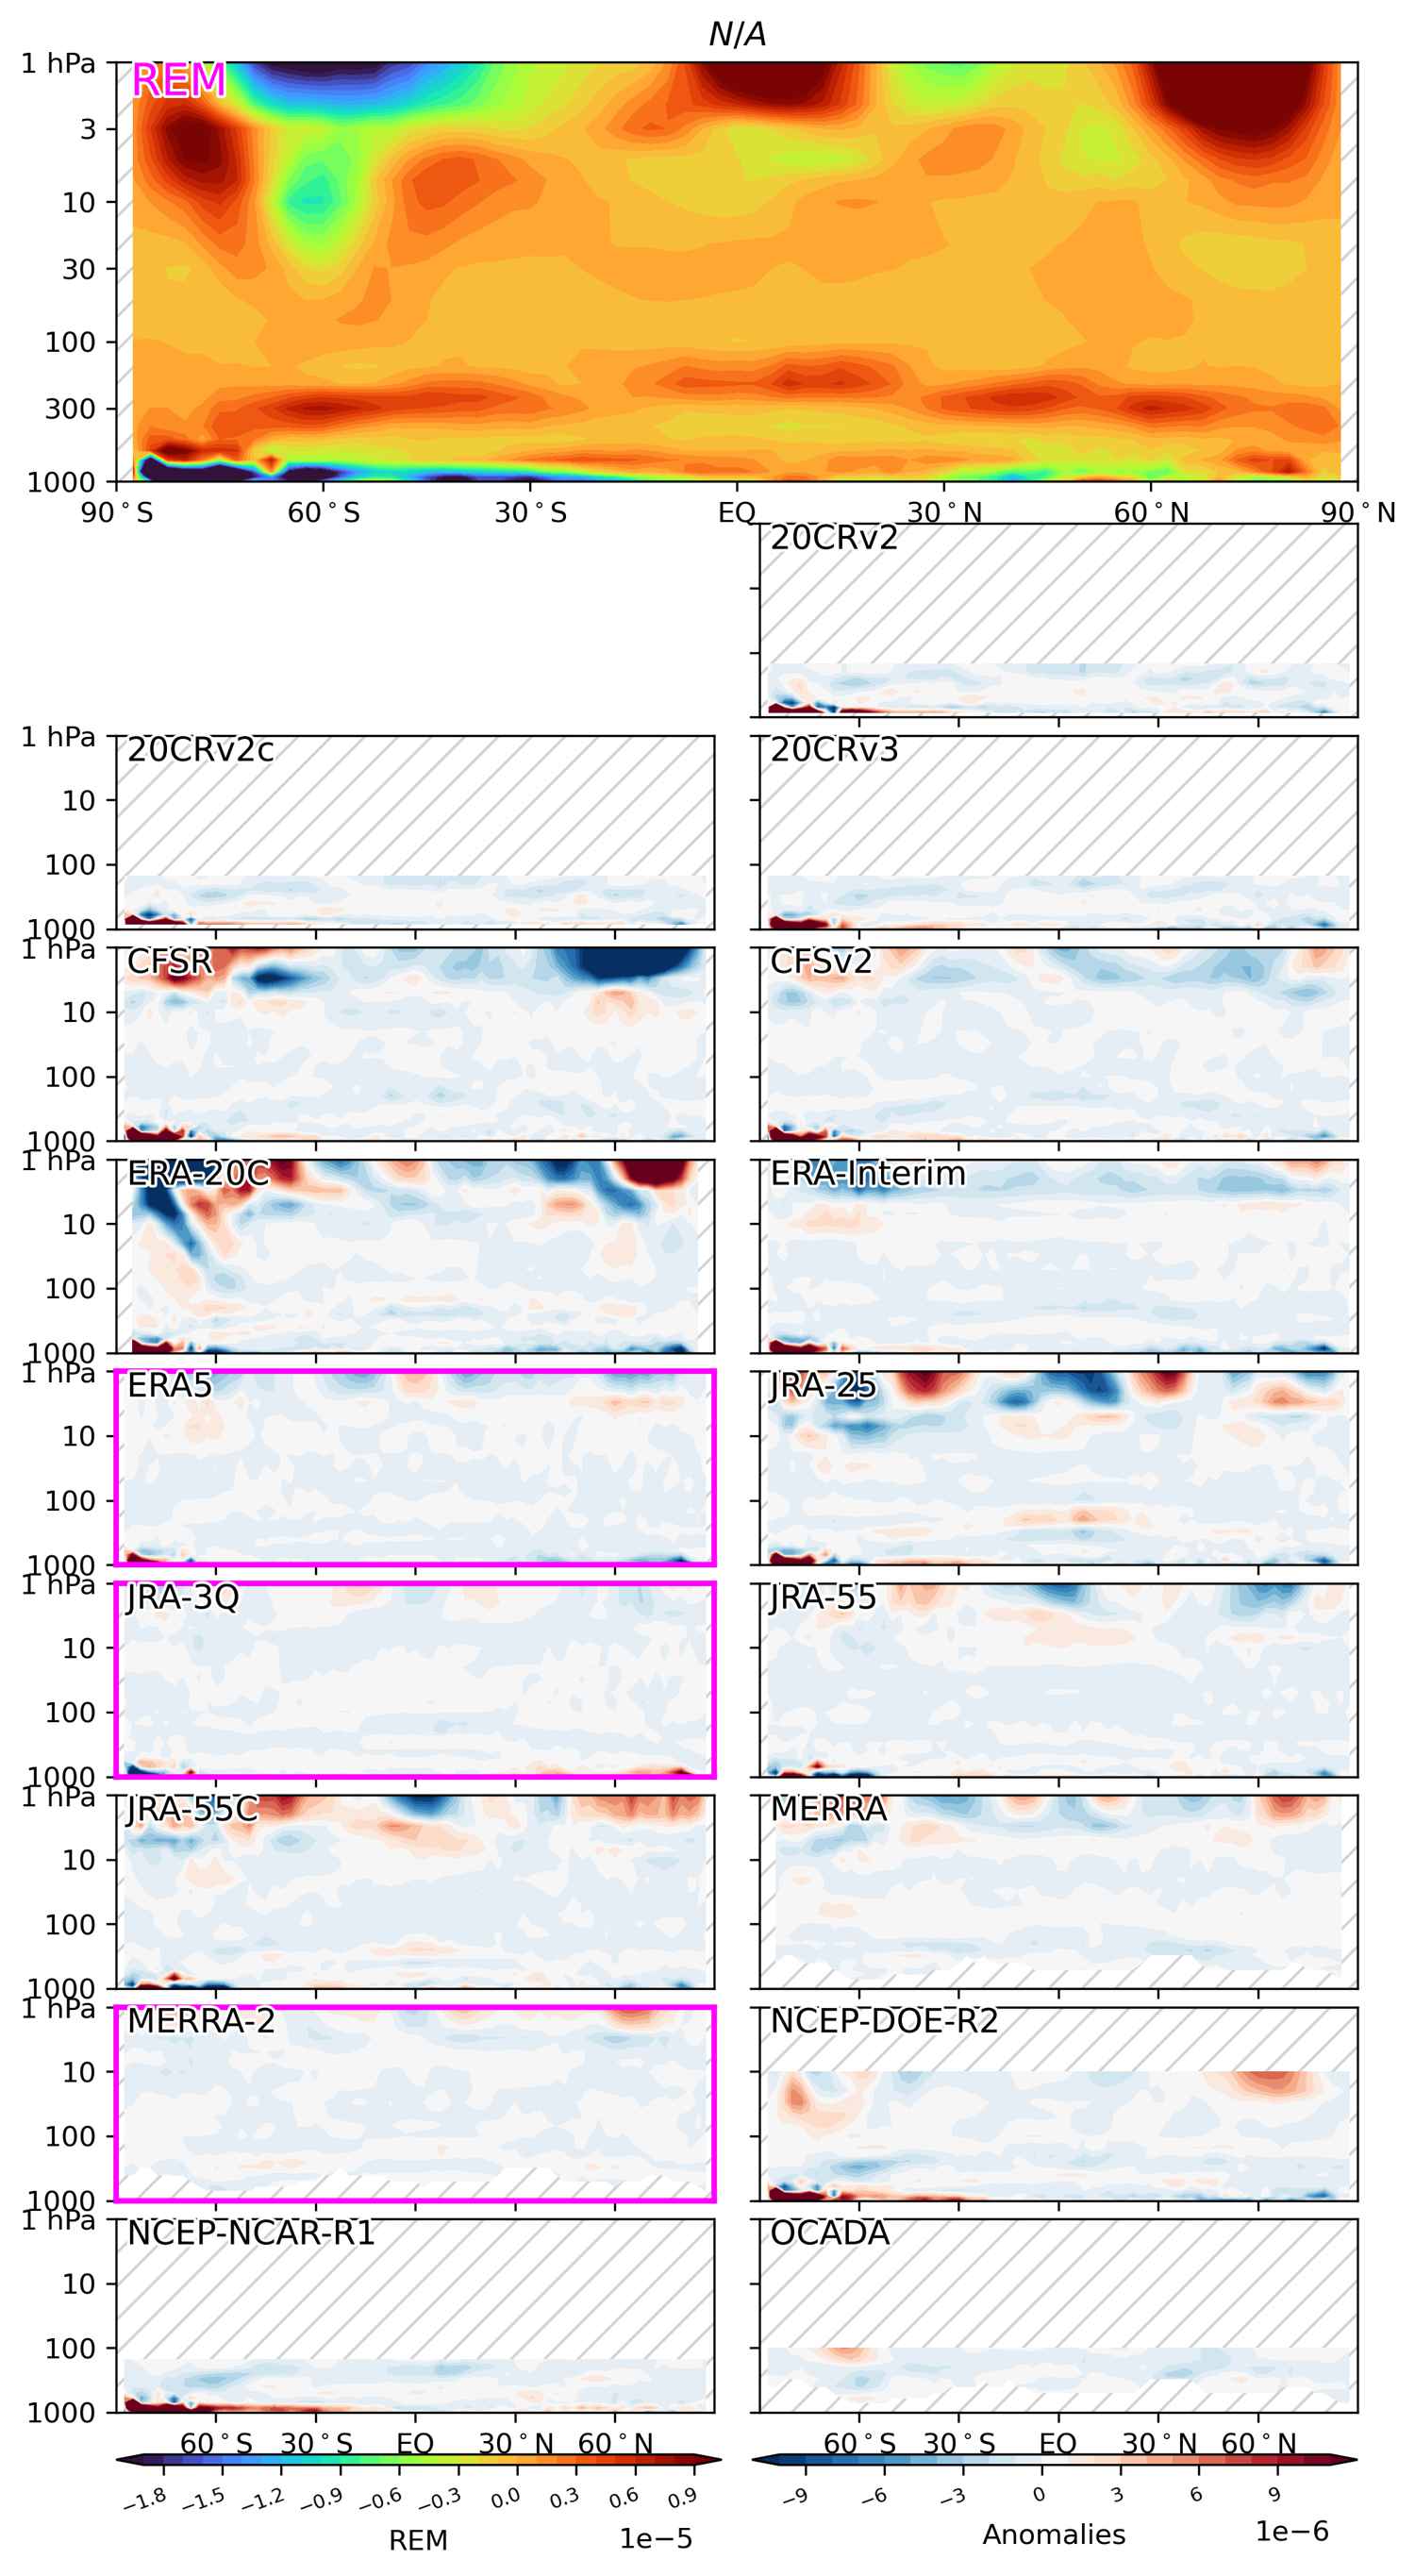 |