Back to extreme weather home page
Event type: Cold spell
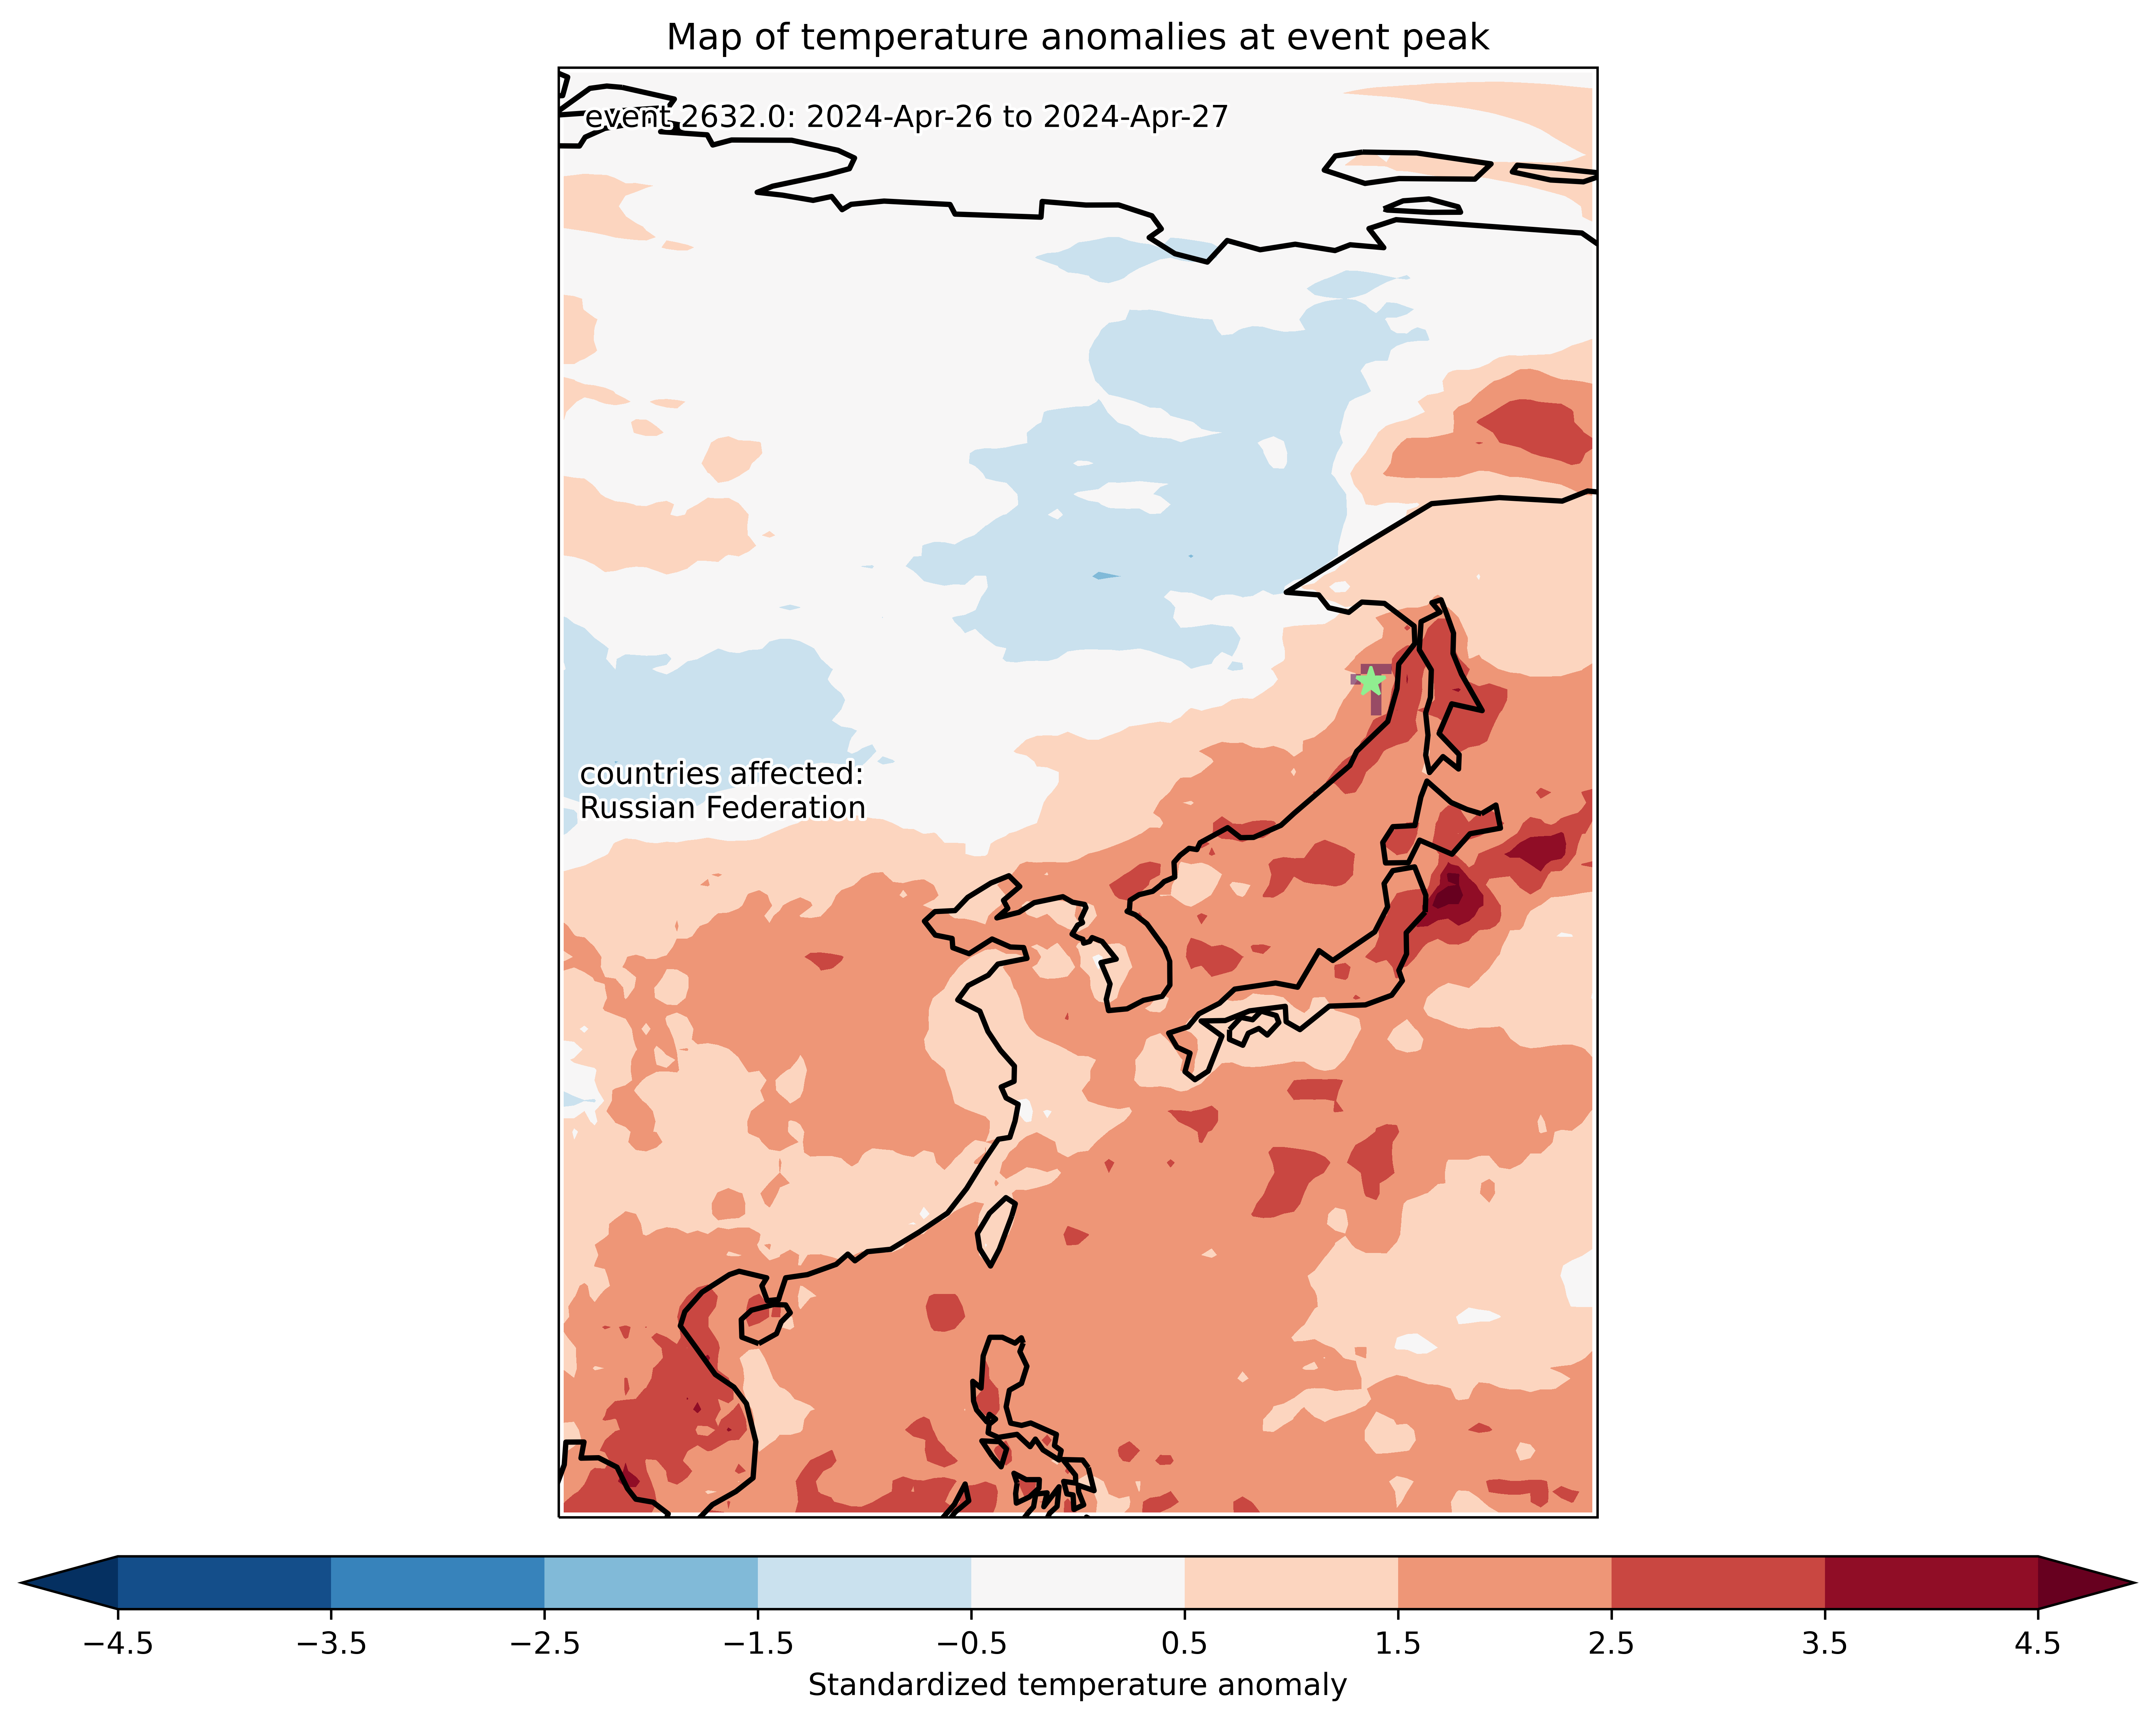
Countries affected: Russian Federation
Lifetime: April 30 2024 to April 30 2024
Mean temperature anomaly: -0.8 C
Mean temperature: -5.0 C
Minimum temperature anomaly: -1.8 C
Minimum temperature: -6.1 C

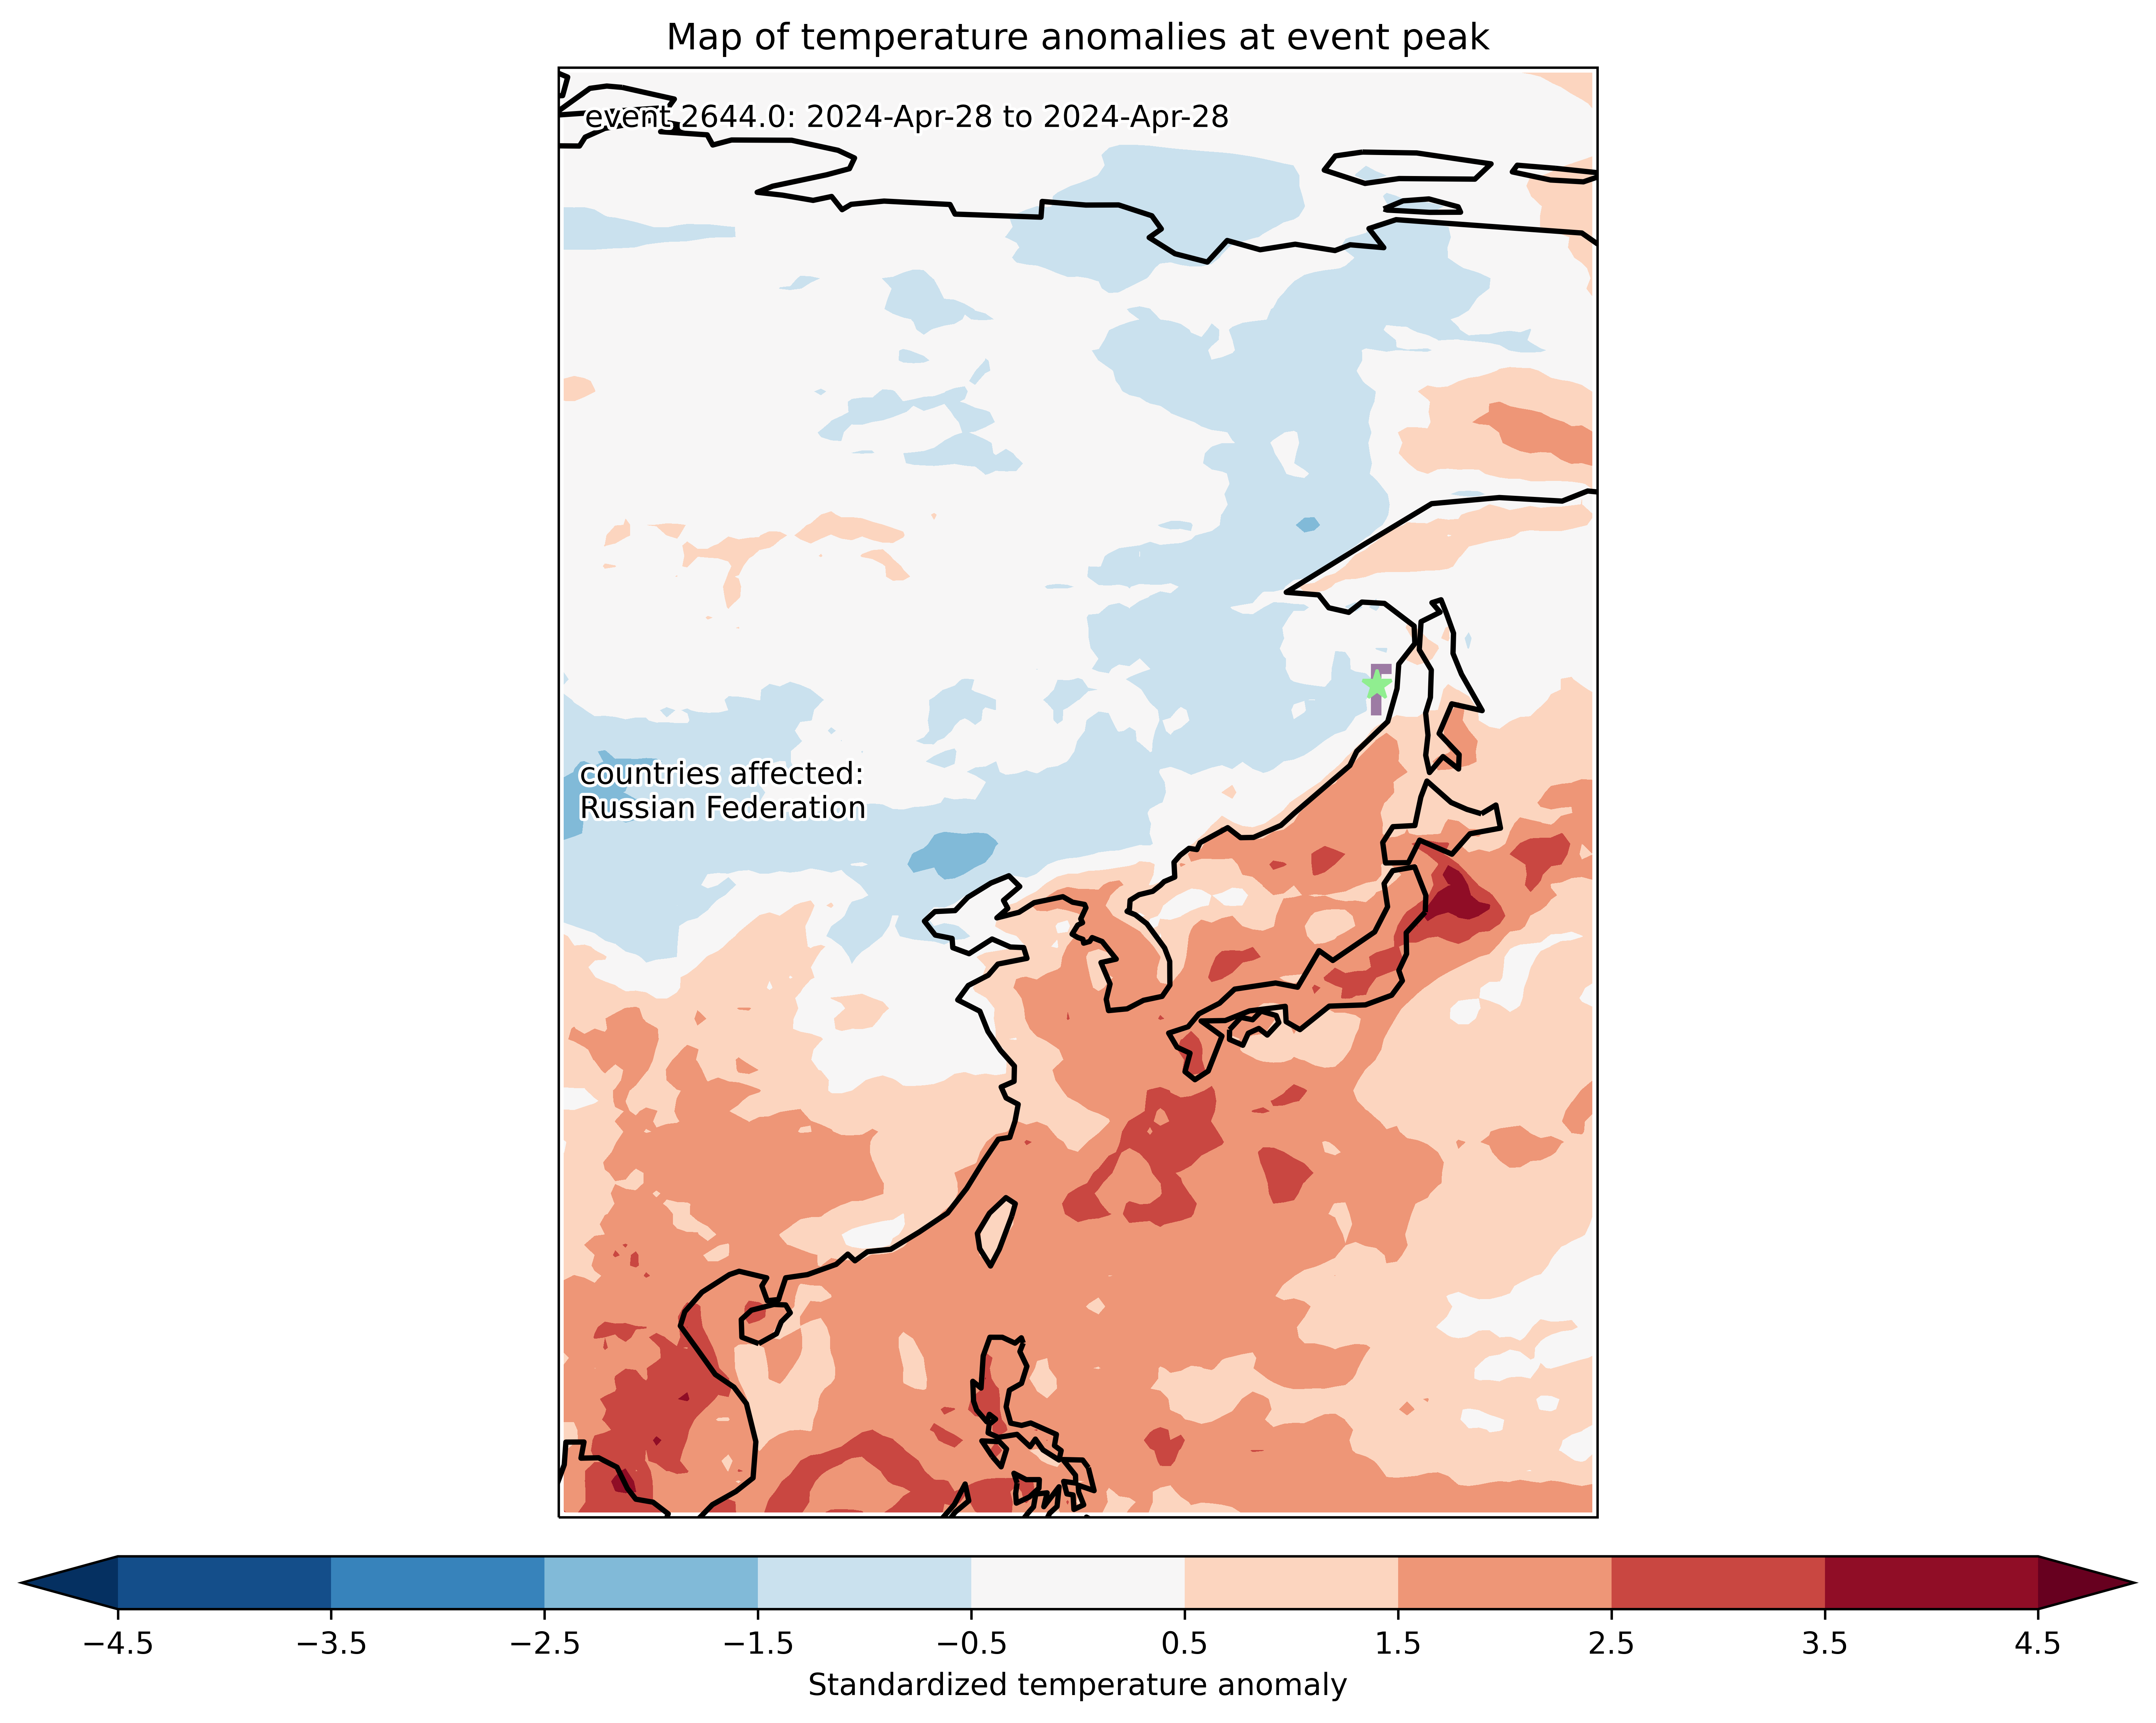
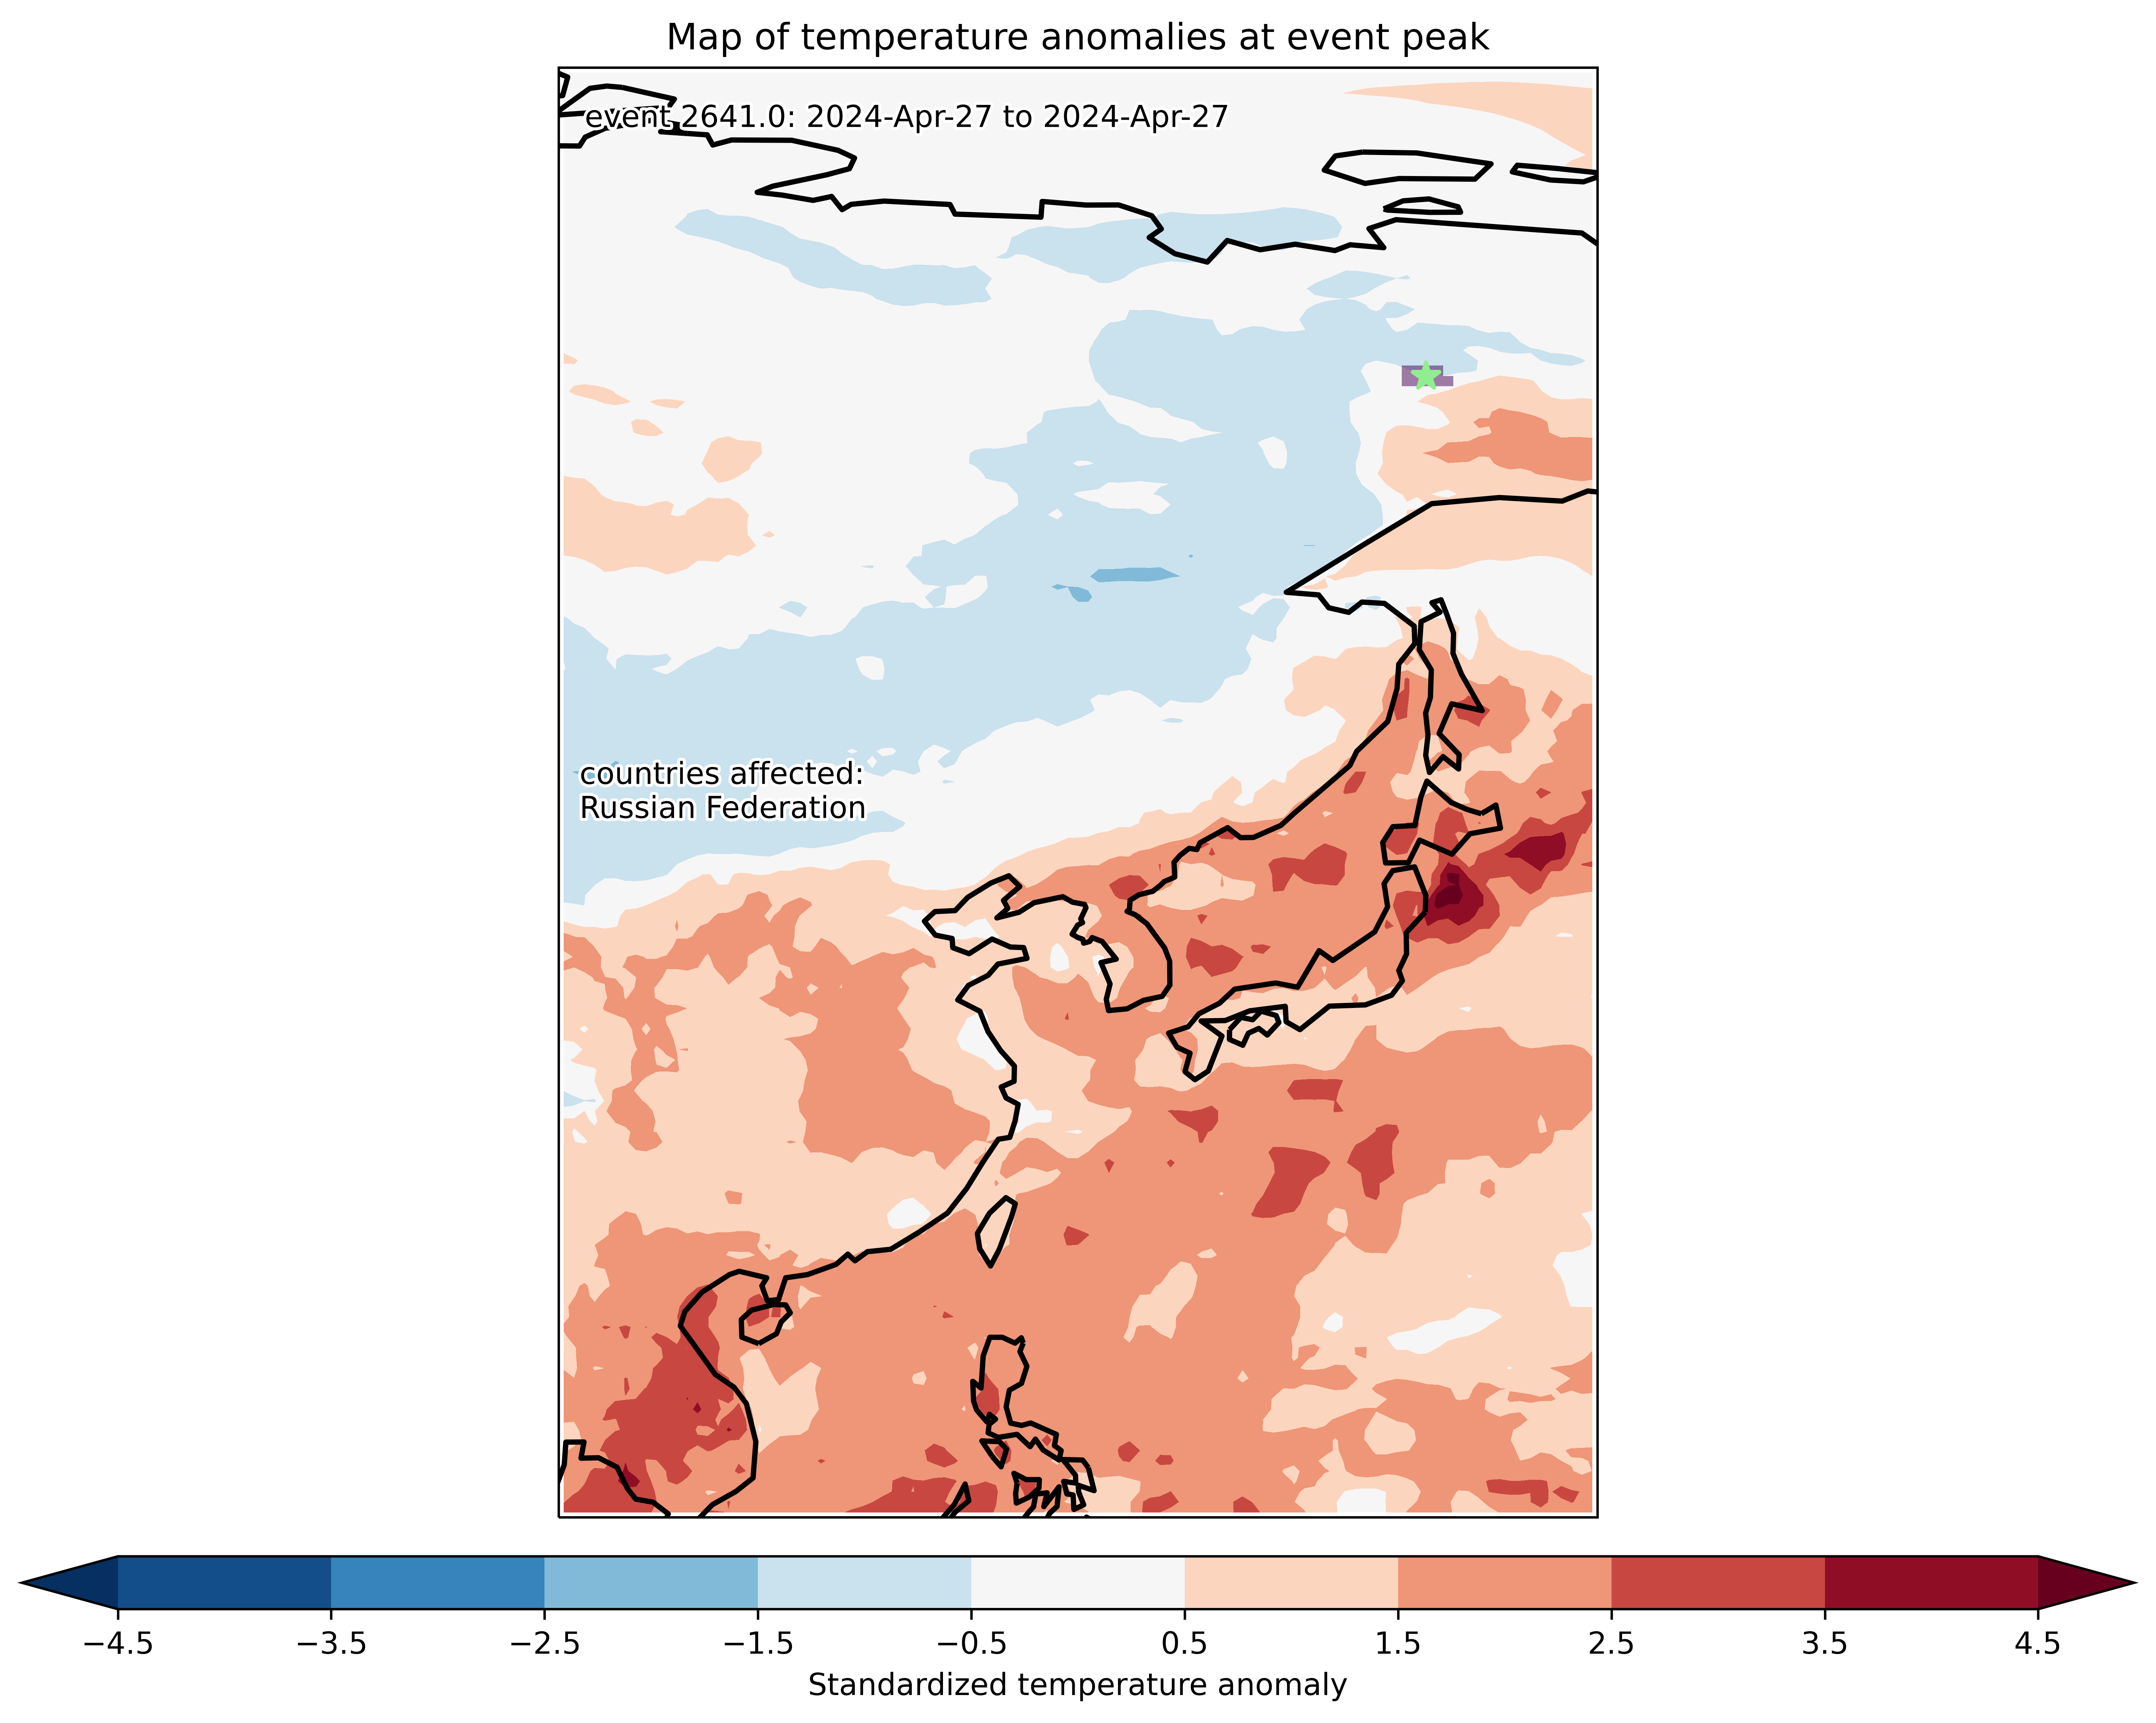
Fig. 1: Map of temperature anomalies (standardized). The green star indicates the center of the extreme event.
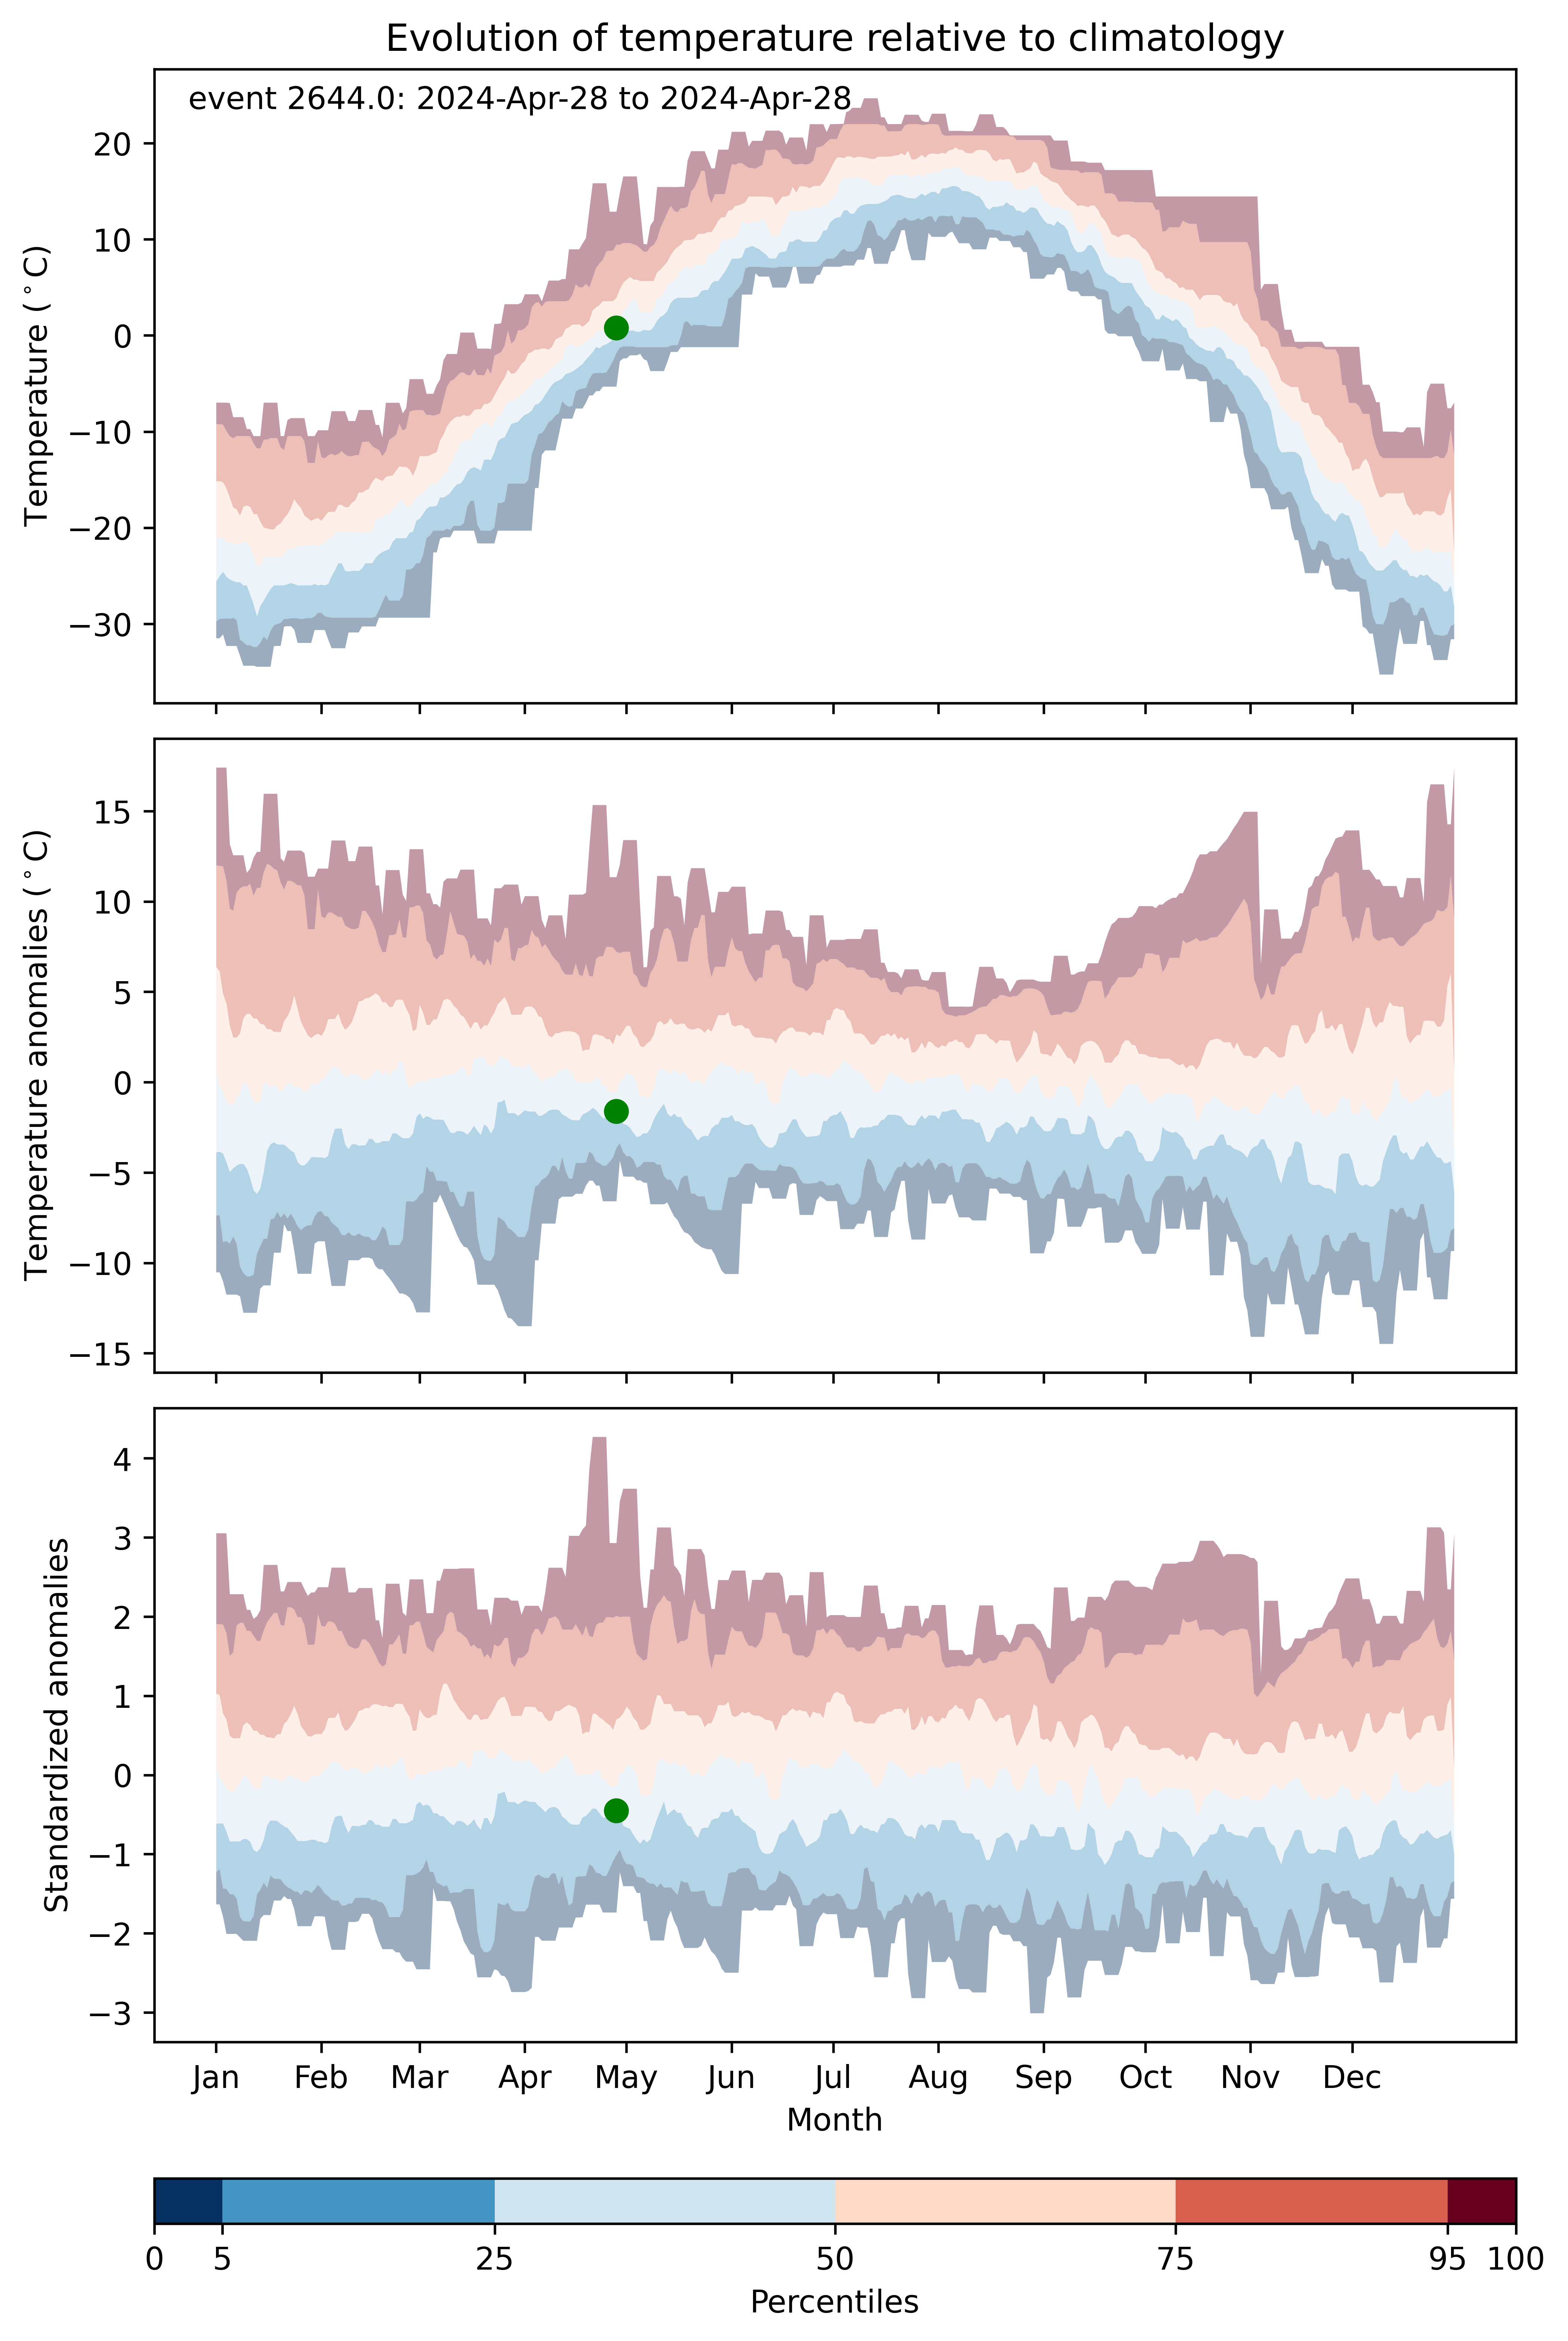
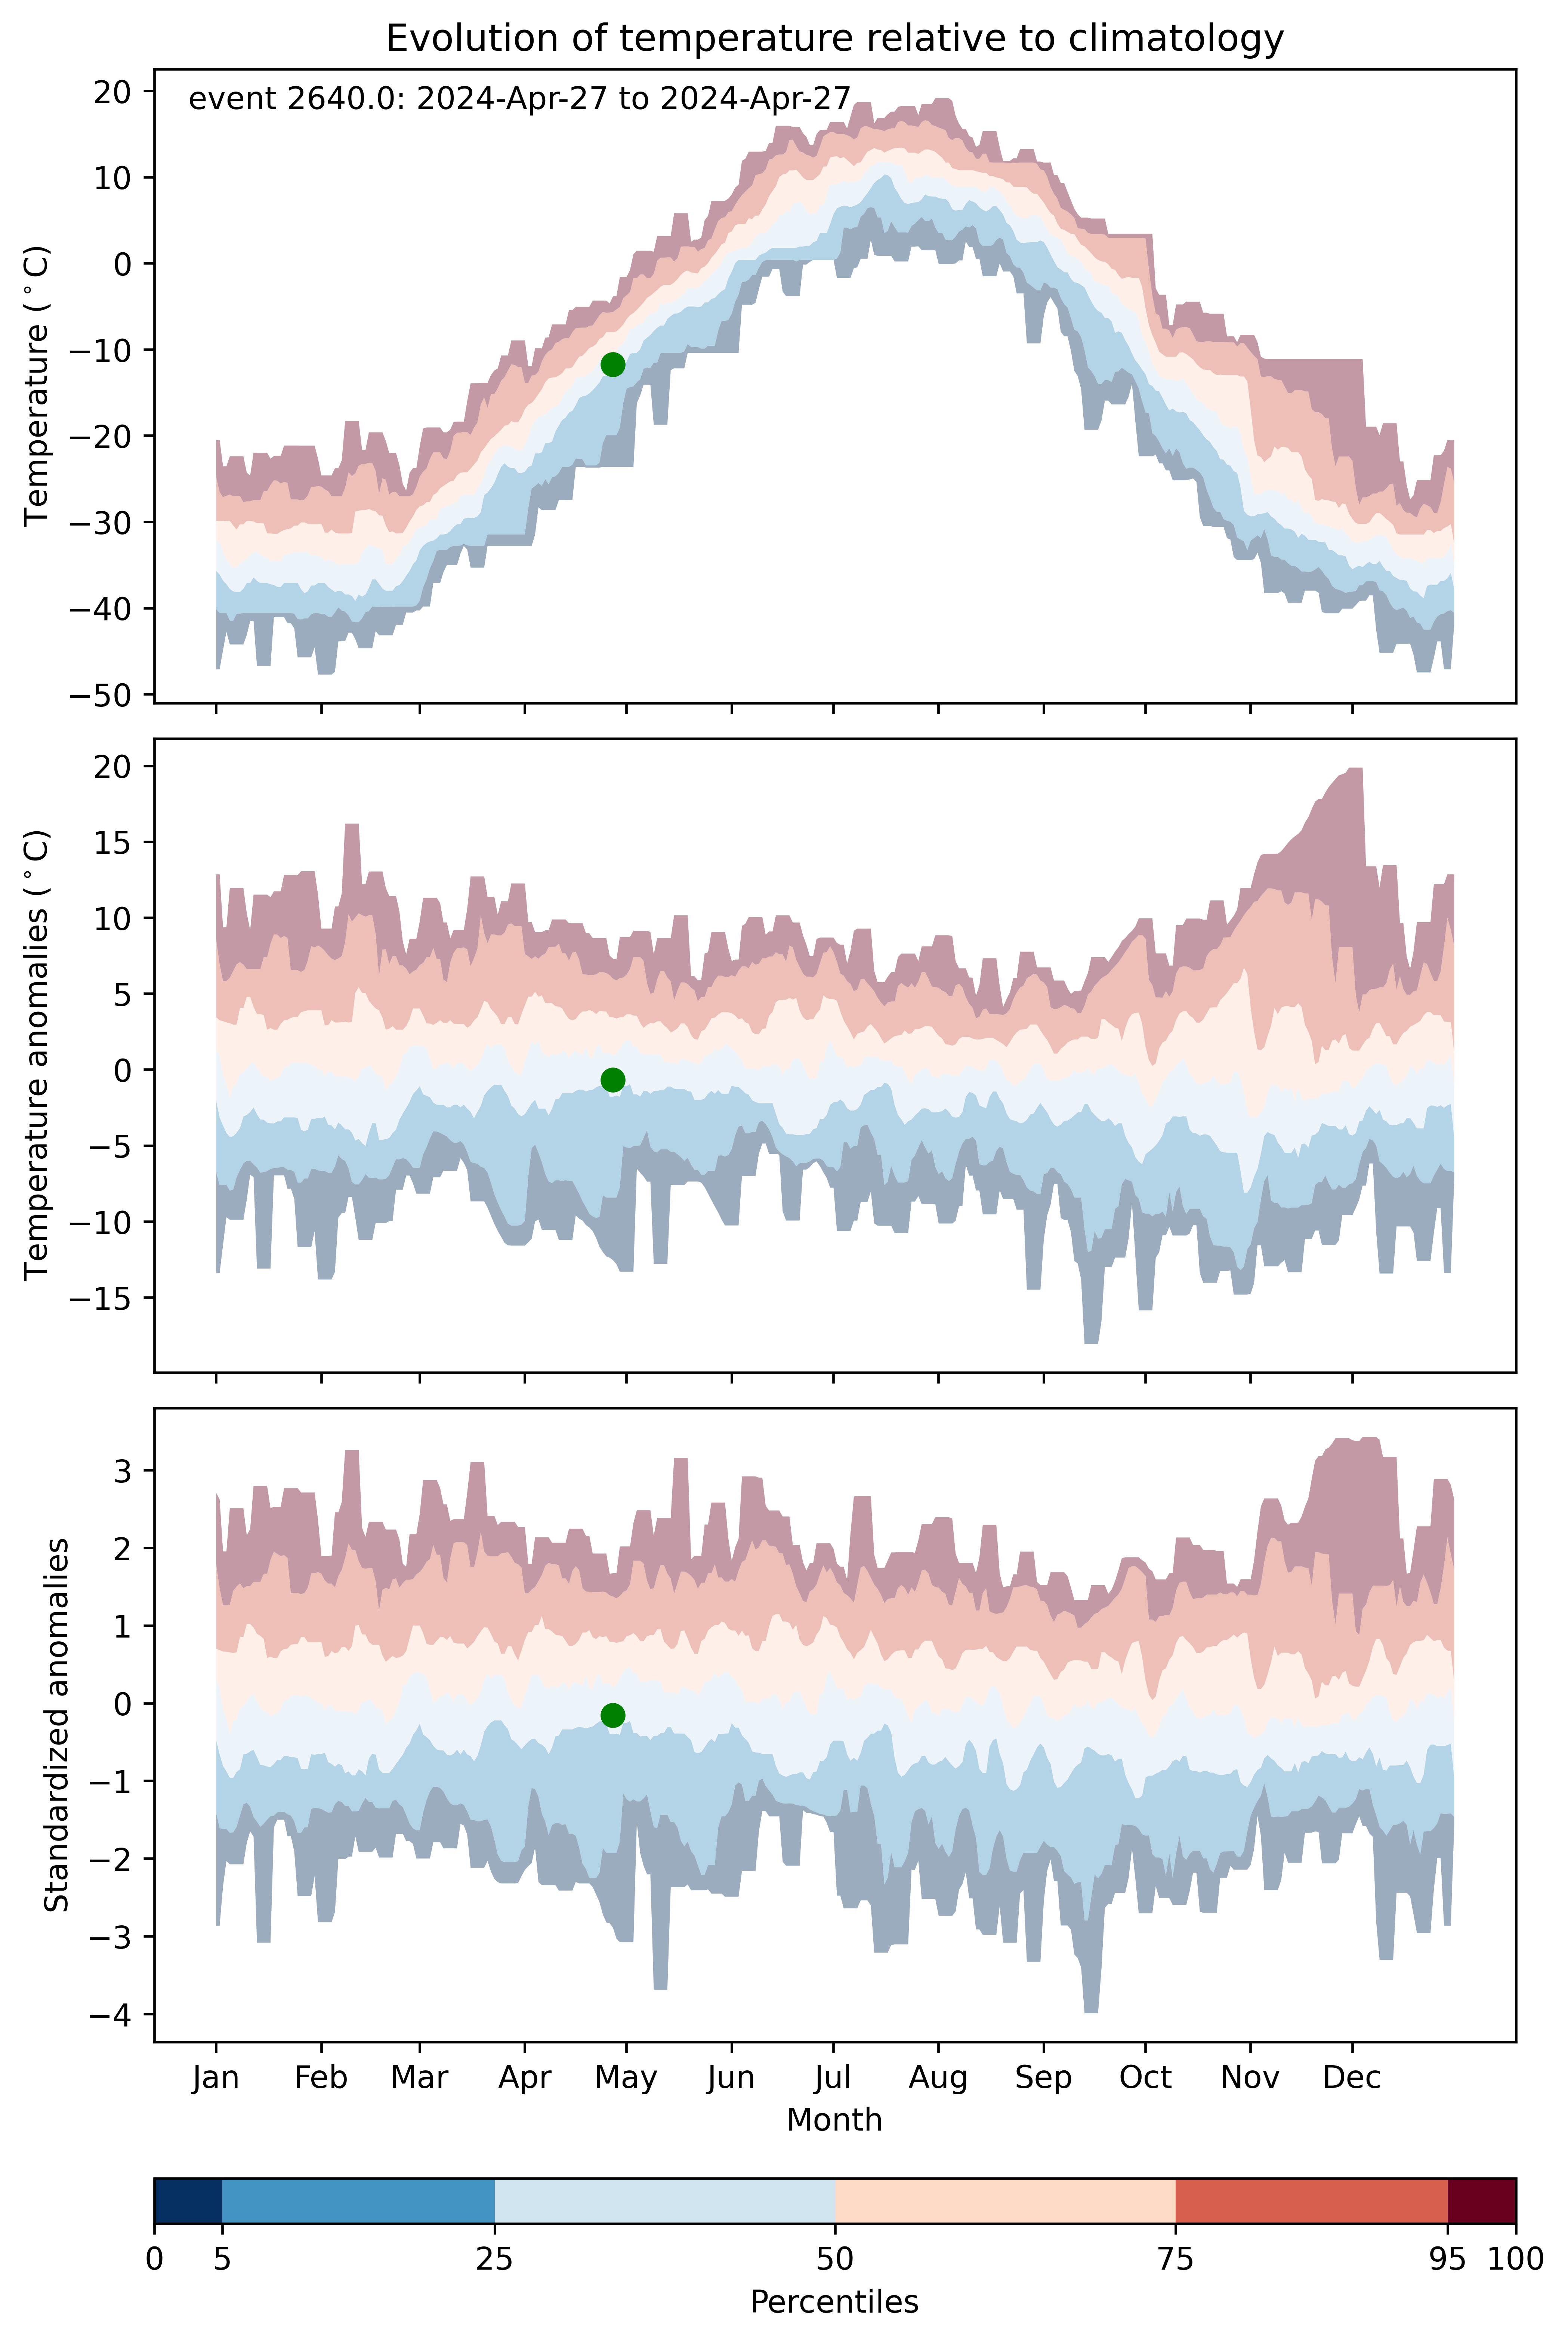
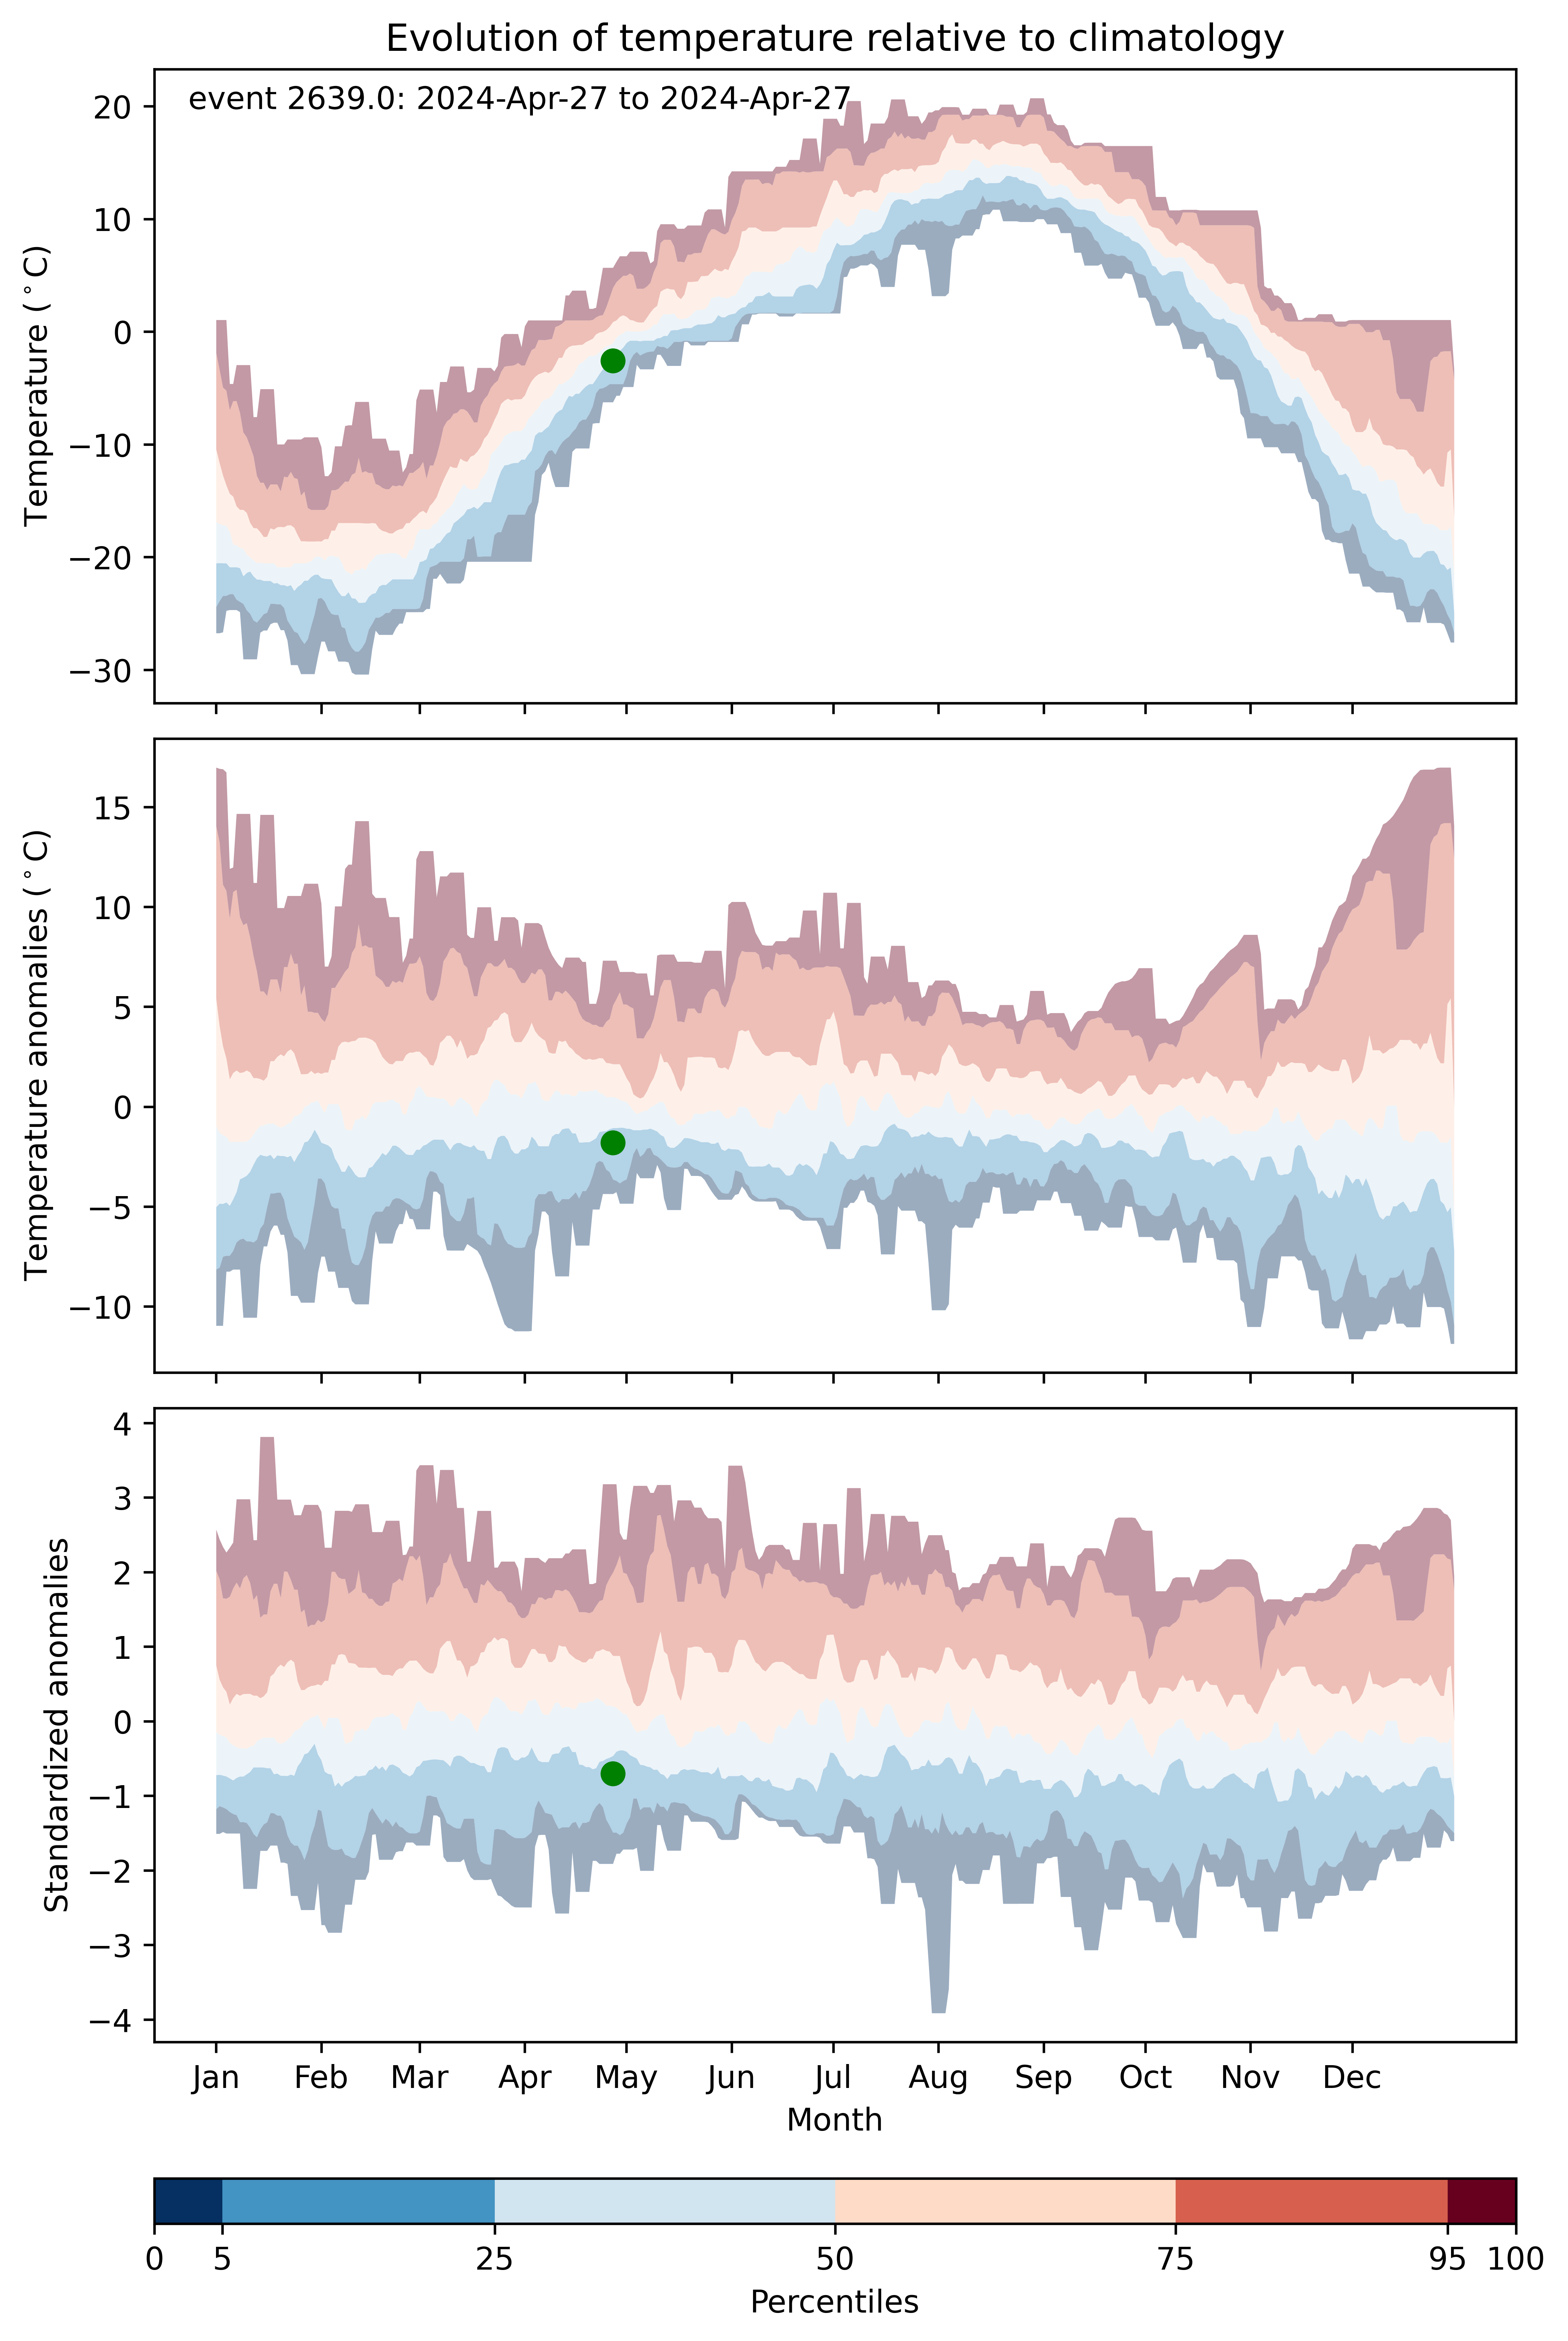
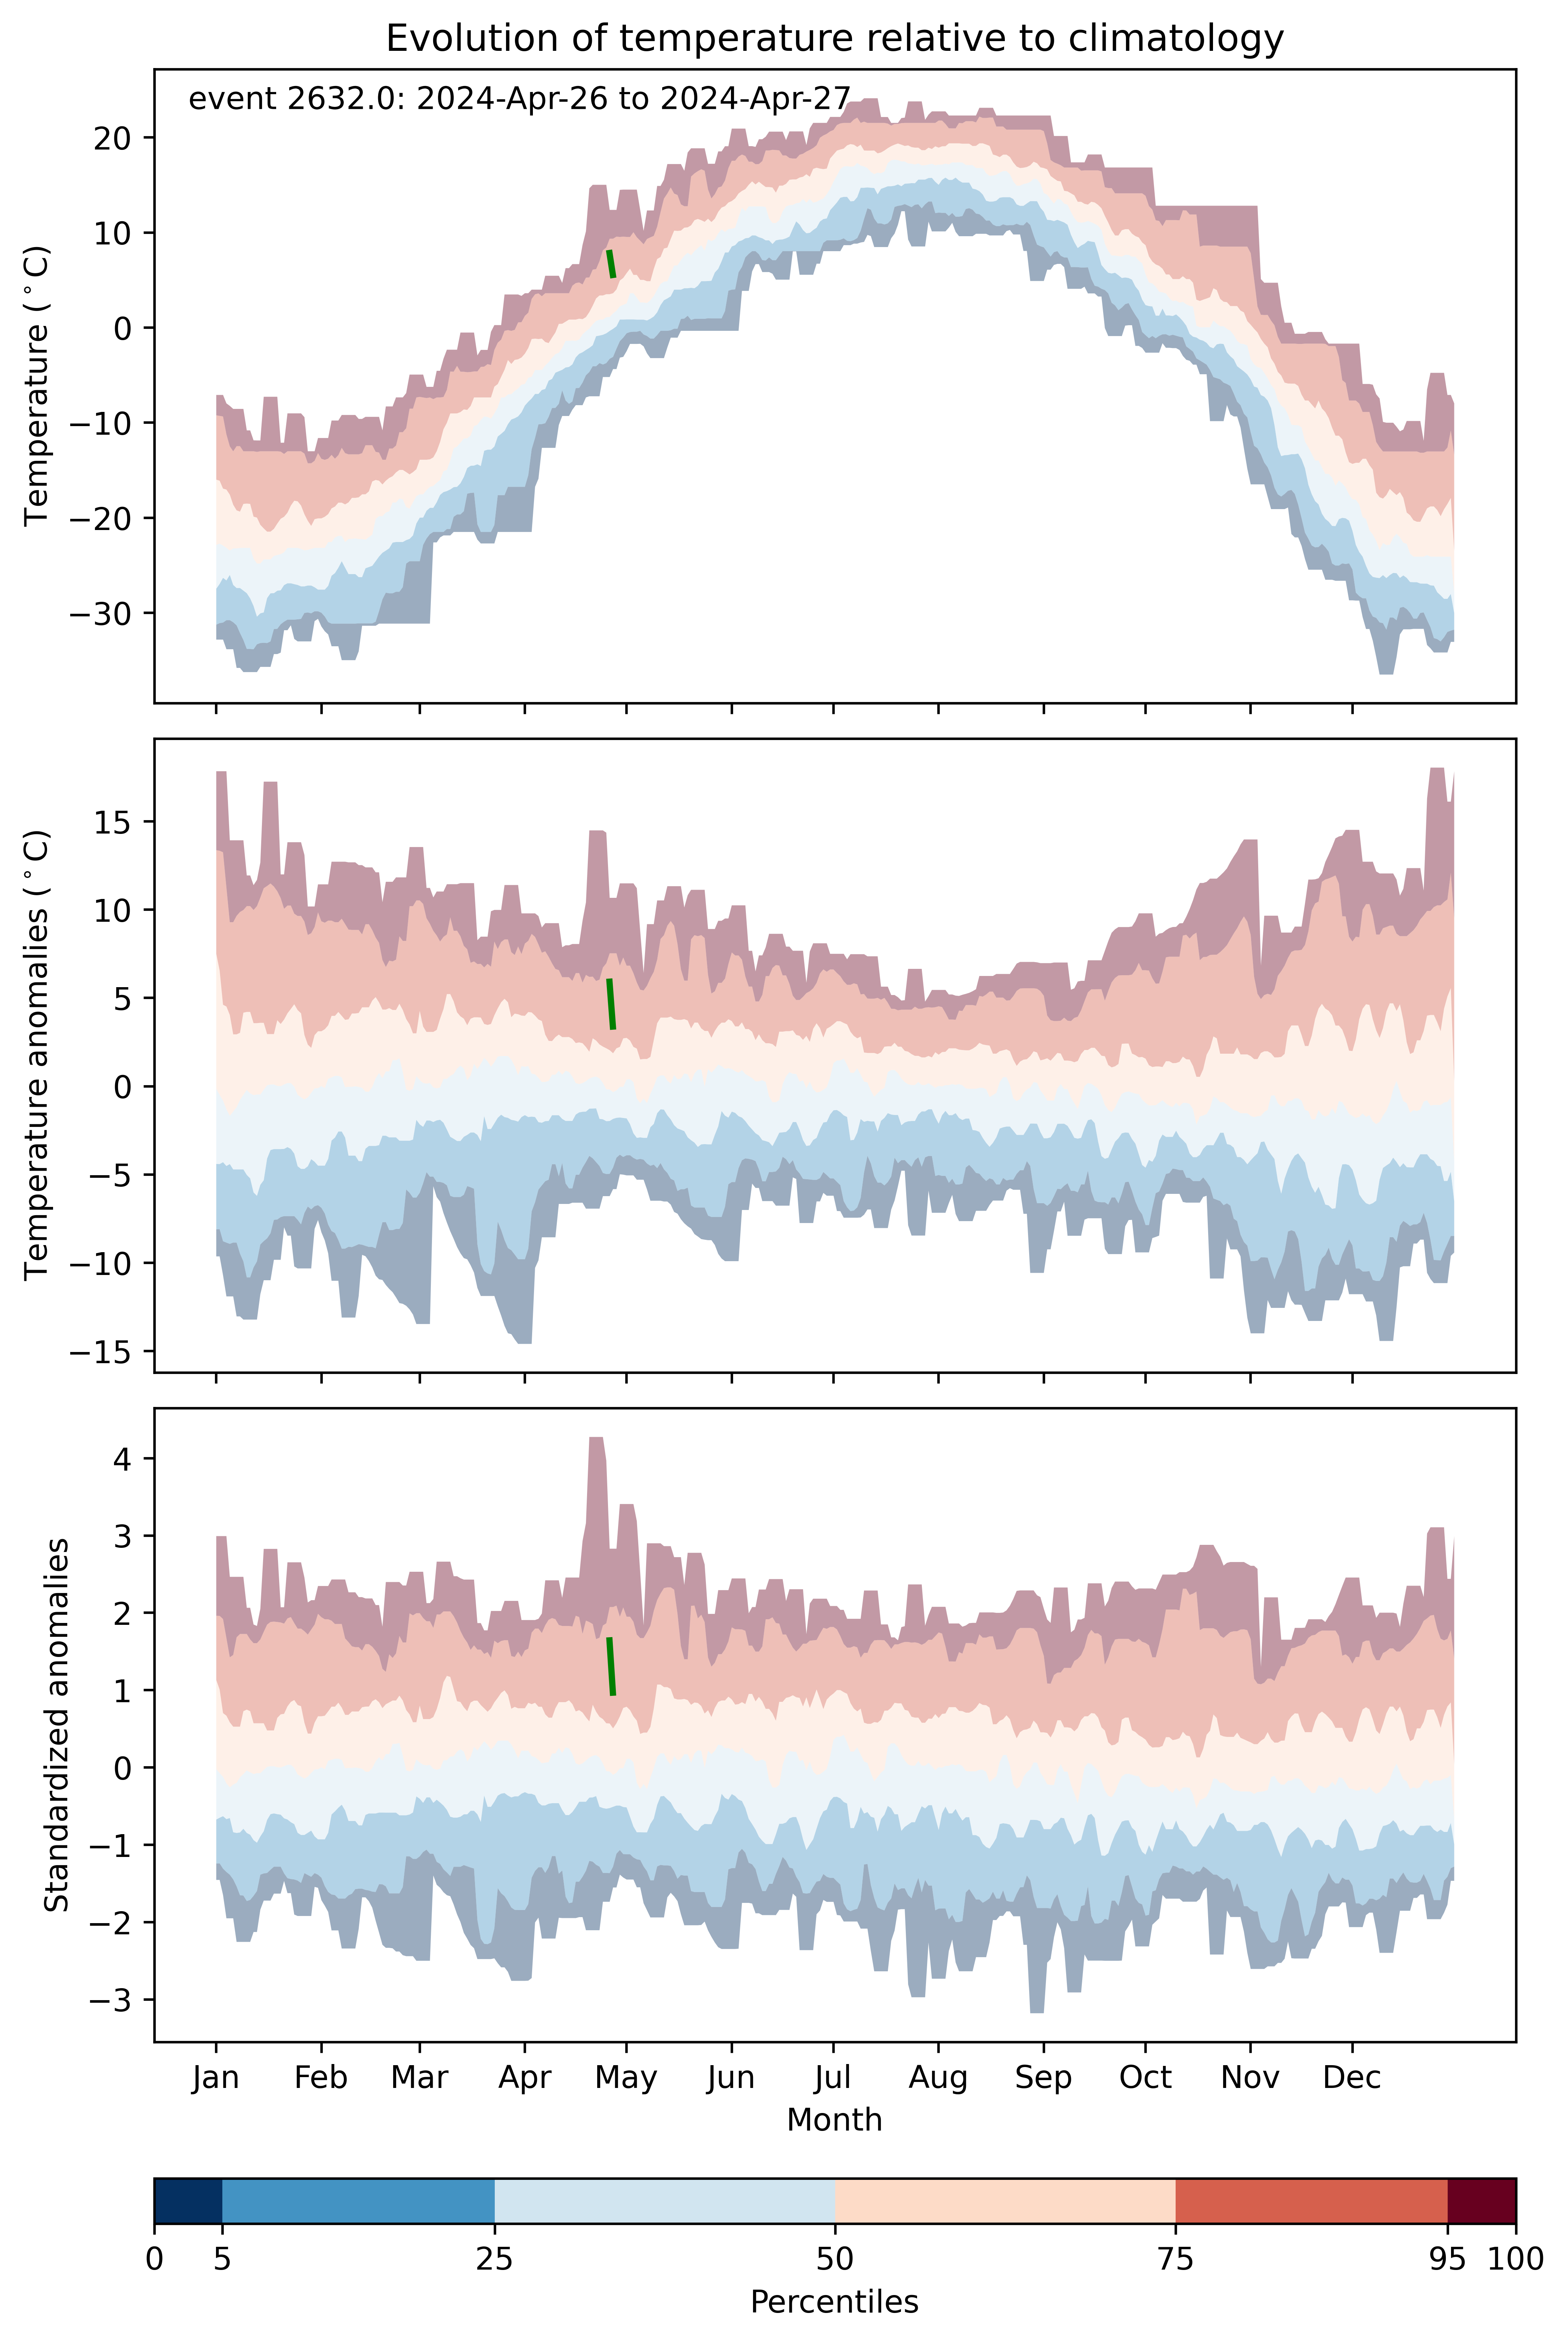
Fig. 2: Evolution of temperature at the center of the event. The climatological percentile distribution is illustrated with color shadings for the folloging limits: 0, 10, 25, 50, 75 and 100 %.