Observational Research in the Arctic Ocean to date - Chapter III: Establishing ourselves (1)
November 24, 2022
Takashi KIKUCHI,
Director, Inst. Arctic Climate and Environment Res., Research Inst.
Global Change/Group Leader,
International Observation Planning Group,
Project Office for Arctic Research Vessel (PARV)
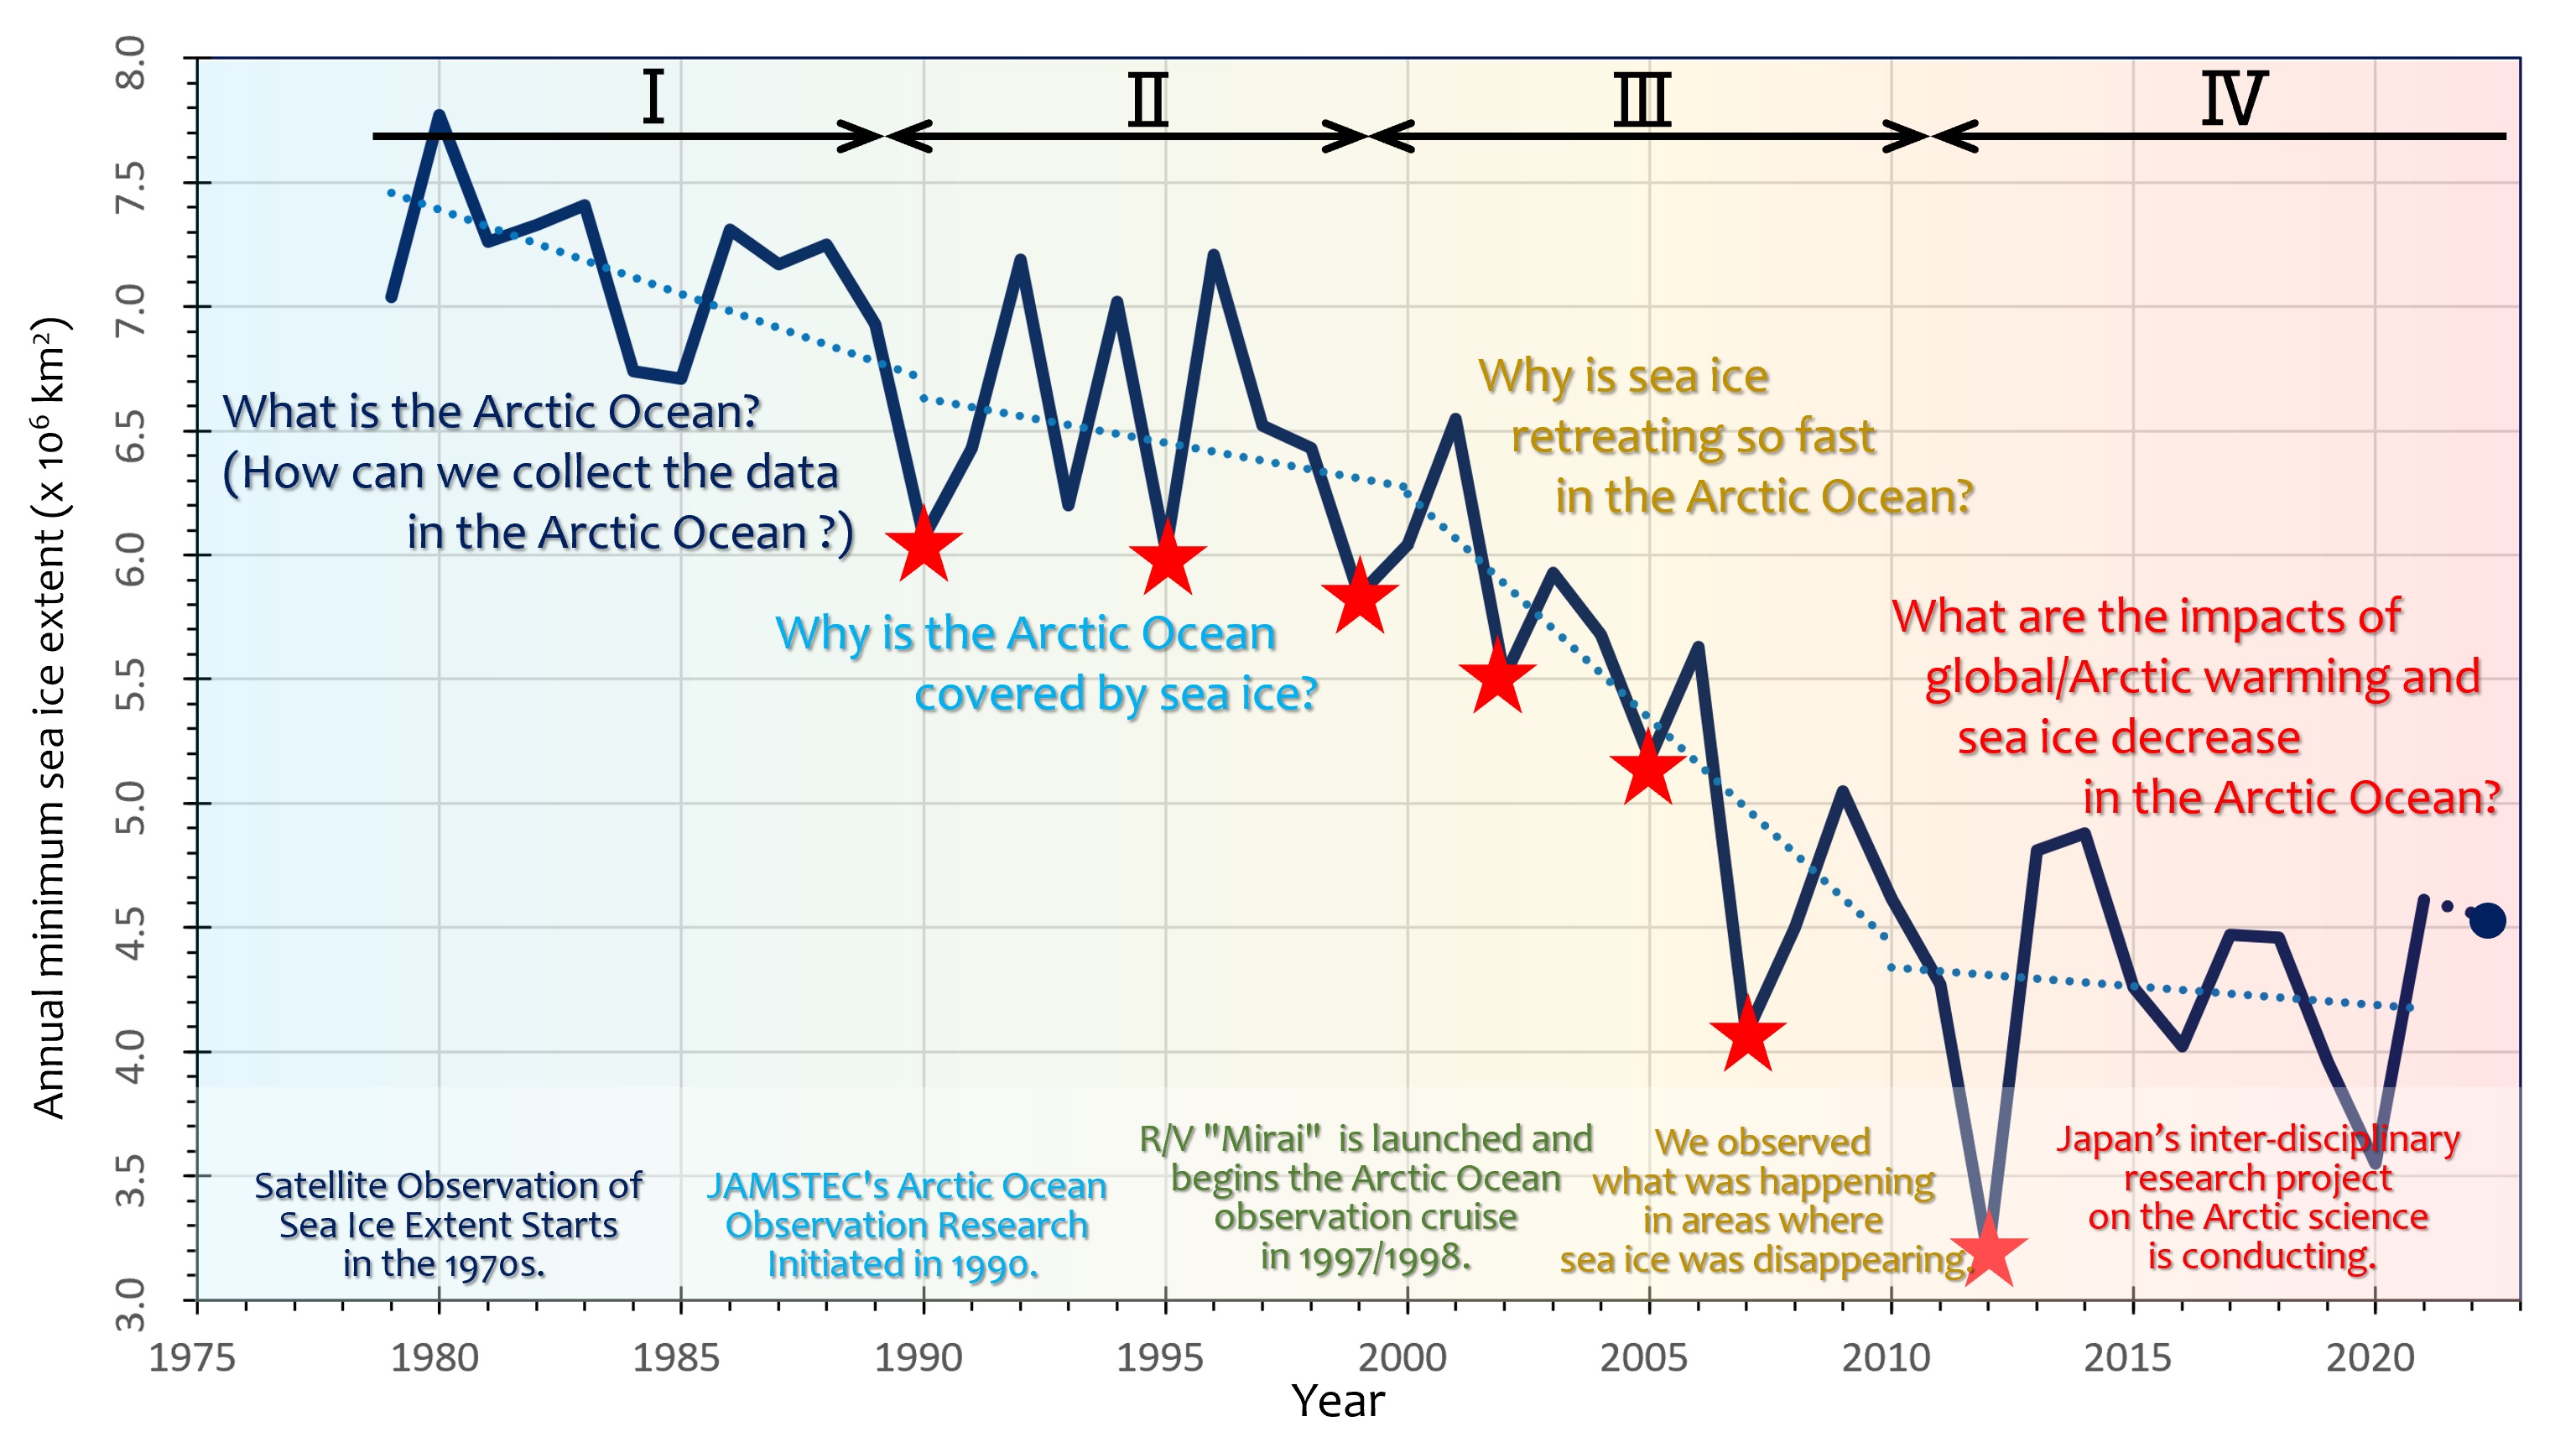
This article describes the history of Arctic Ocean observation and research to date, focusing mainly on the activities of Japan and JAMSTEC. Figure 1 shows the interannual variation of minimum sea ice extent in the Arctic Ocean revealed by satellite observation since 1979 with some comments about the purposes and activities of the Arctic Ocean observation. We divide the period from the start of satellite-based sea ice observations in the 1970s to the present into four periods and summarize the objectives and research activities conducted during each period.
III: Establishing ourselves (1. Development of ice-drifting buoy and observational research in the multiyear ice zone of the Arctic Ocean)
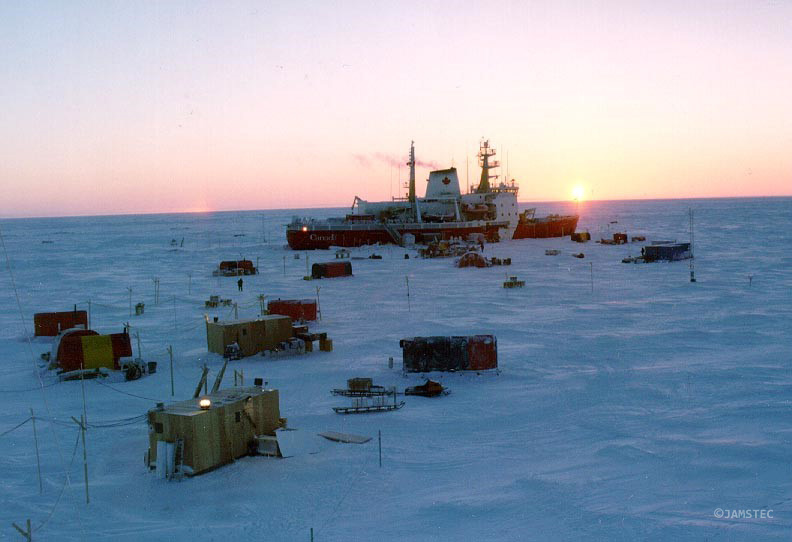
As mentioned earlier chapter, JAMSTEC began observations of the Arctic Ocean in the early 1990s in collaboration with the Woods Hole Oceanographic Institution (WHOI) and the University of Alaska, Fairbanks (UAF), and accumulated observation experience in the Arctic Ocean. Based on these experiences, we initiated scientific observation "research" activities to answer questions such as "Why does sea ice exist in the Arctic Ocean? (i,ii) For instance, the international observation project SHEBA (Surface Heat Budget of the Arctic Ocean) was carried out in 1997-1998.
In this project, the Canadian Coast Guard icebreaker (CCGS Des Groseilliers) served as an ice base by anchoring it in sea ice to conduct overwintering and year-round observations (iii). JAMSTEC participated in this project by conducting drifting observations using the IOEB, year-round oceanographic observations using a mooring system, and hydrographic measurements on the way to and from the ice station and published the results as a scientific paper(iv). In the late 1990s, JAMSTEC began cooperating with overseas research institutions and planning and developing its own observations with its own instruments and vessels. Furthermore, around the end of the 1990s, JAMSTEC began to plan and initiate its own observations and development with its own instruments and vessels, while cooperating with overseas research institutions.
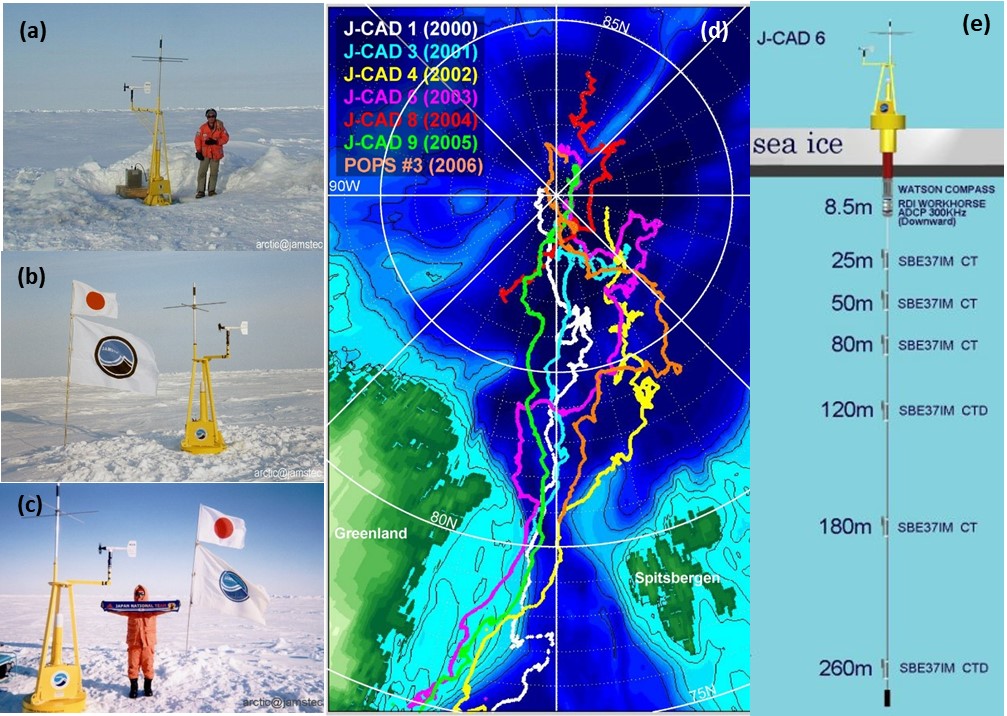
First, based on the knowledge and experience of the IOEB, JAMSTEC started the development of a new ice-drifting buoy in 1997, aiming for a compact and inexpensive buoy with state-of-art technology. This buoy is named “J-CAD” (JAMSTEC Compact Arctic Drifter). The development was conducted in collaboration with MetOcean Data Systems (MetOcean). The following improvements and developments were applied to make the J-CAD observation system easy to install, safe, and trouble-free. 1) To reduce the weight of the buoy, we decided on our observation targets only in meteorology and physical oceanography. 2) Accurate buoy position measurements by GPS were able to conduct for under-ice ocean current measurement. 3) A new satellite communication system that enables two-way communication between J-CAD and our laboratories was adopted. 4) A contactless IM (Inductive Modem) system is adapted for communication between the top buoy on ice and each observation device attached to a cable extended from ice to water. For more details, please refer to Hatakeyama et al. (2001) or Hatakeyama and Monk (2001) (v, vi).
We participated in ice camps and icebreaker cruises deployed J-CAD and other buoys in the multi-year ice area and conducted observational research for the Arctic Ocean. The most continuous observation was the NPEO (North Pole Environmental Observatory) (vii). The NPEO started in 2000 and was an annual expedition in April to go to the North Pole ice camp and conduct ocean, ice, and other observation, which was led by the Polar Science Center, Applied Physics Laboratory, University of Washington, and the U.S. National Oceanic and Atmospheric Administration (NOAA). JAMSTEC participated in the NPEO, deployed J-CAD and other buoys, and had been conducting autonomous ocean observation between 2000 and 2013. The first J-CAD was successfully deployed under the NPEO project at 89.6N, 130.3W on April 24, 2000, had been drifting through the Fram Strait to the Greenland Sea, and sent the real-time observation data to our laboratory. I also participated in the NPEO from 2002 to 2013, going to the North Pole ice camp in early April to deploy ice-drifting buoys. We accumulated the buoy data and were able to investigate the status and changes in oceanographic conditions on the Atlantic side of the Arctic Ocean (e.g., viii, ix).
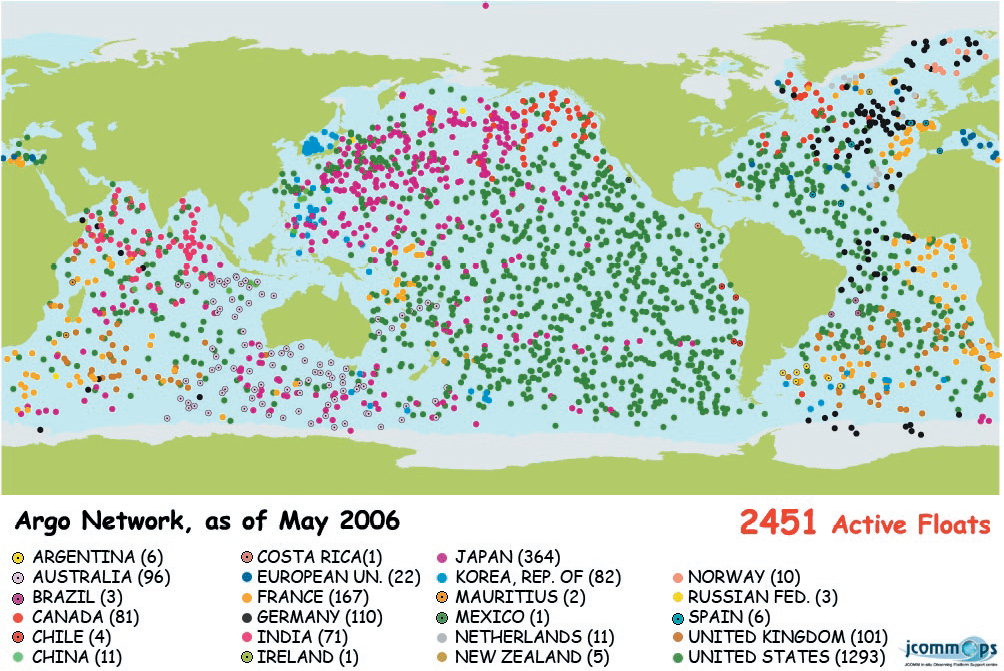
Personally, I believe researchers are inherently selfish. When they accomplish one thing, they tend to think further ahead and wish to achieve more. At the same time that J-CAD made it possible to safely and easily measure water temperature, salinity, and ocean current under sea ice in the Arctic Ocean, there were major developments in global ocean observations. The "Argo Program" was initiated in 2000. “Argo Program” is an international program that collects information from inside the ocean using a fleet of robotic instruments (Argo float) that drift with the ocean currents and move up and down between the surface and a mid-water level.” (Referred from Argo website (v)). Note that the Argo float moves up and down by adjusting buoyancy by itself. Since the start of its worldwide operation in 2000, it has been continuously monitoring the state of the ocean and has become one of the most indispensable observation networks in oceanography(xi).
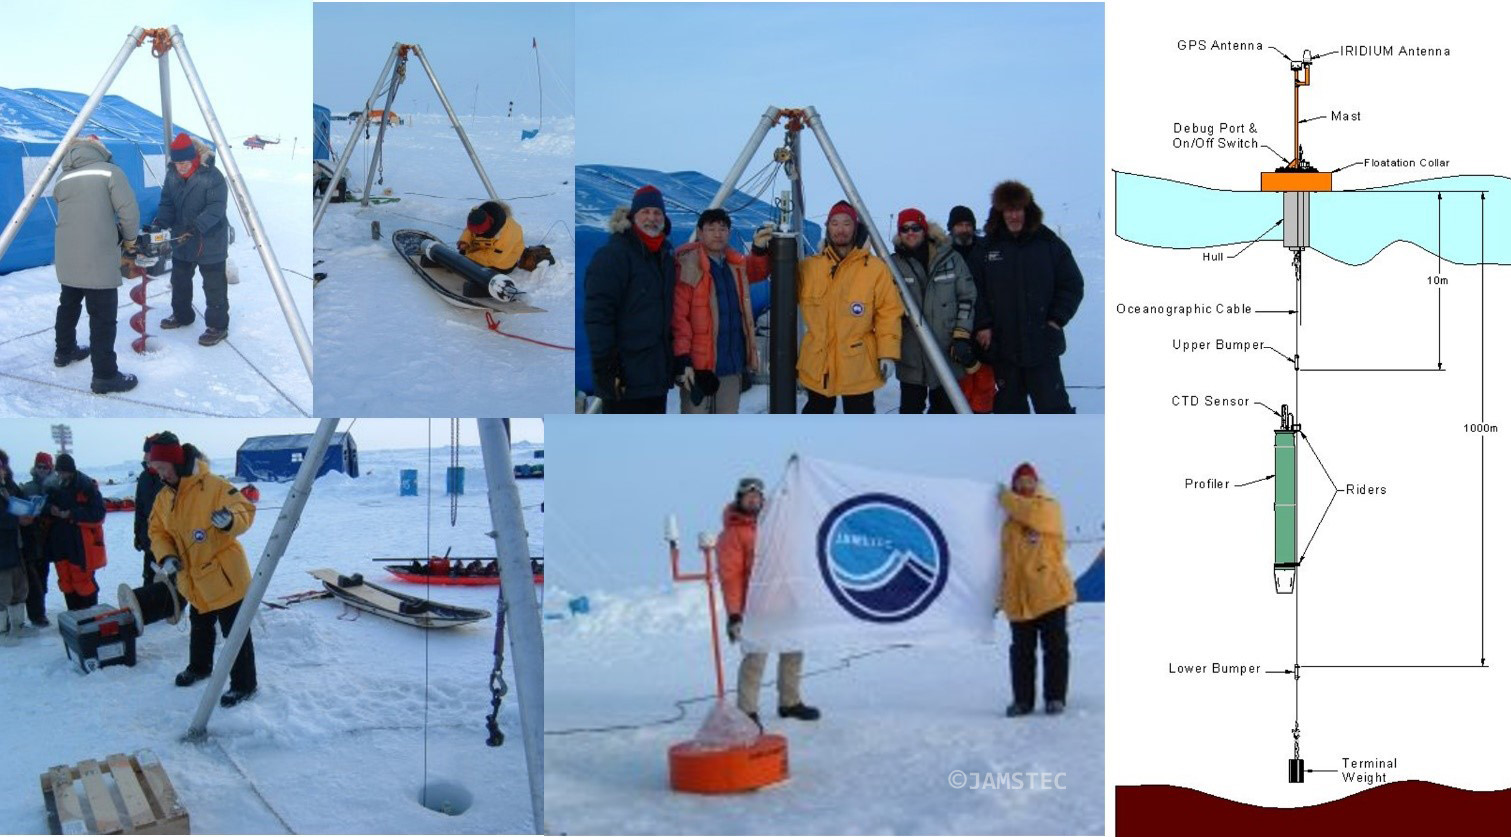
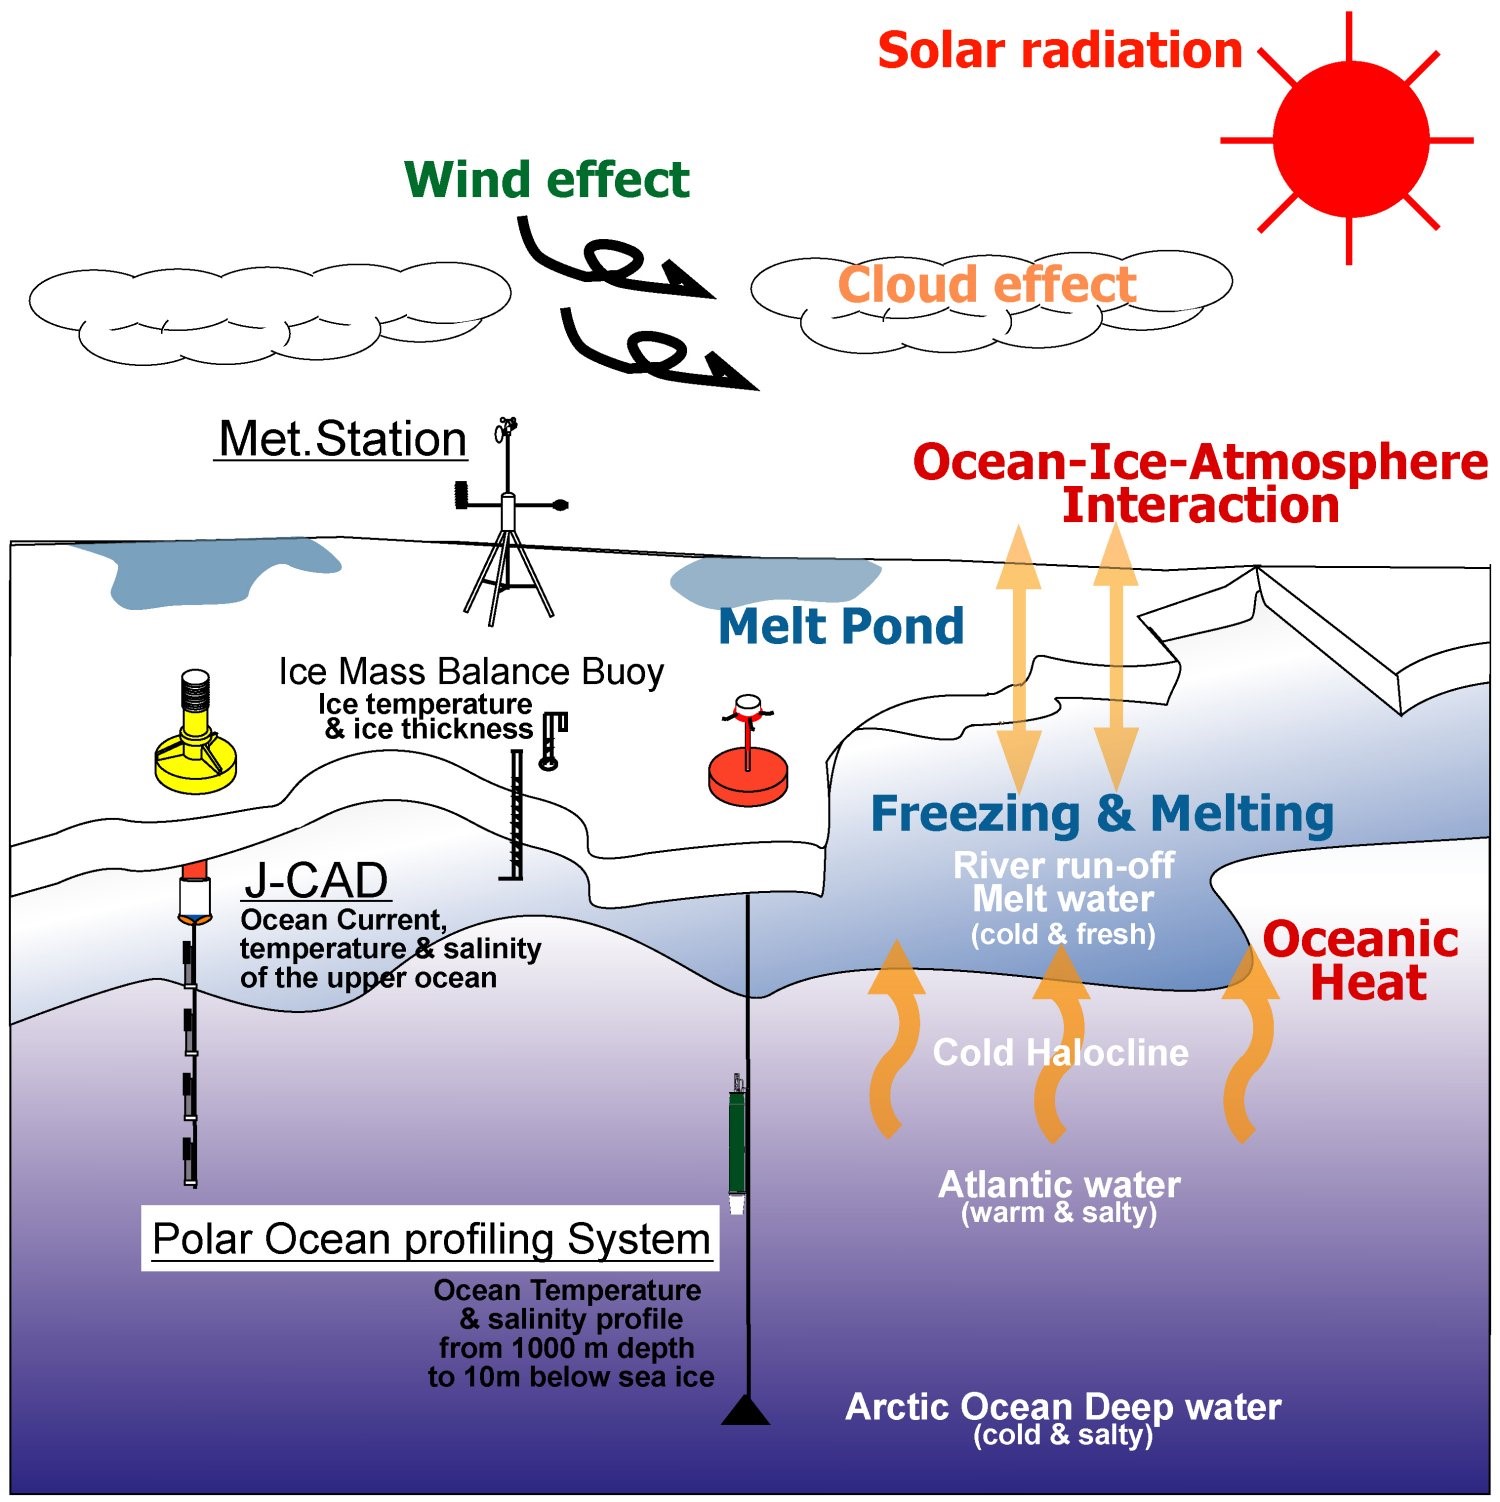
Let’s get back to the story of our Arctic Ocean observations in the early 2000s. With the development of J-CAD, we had a new observation system that is easy to install, safe, and trouble-free in the multi-year ice area of the Arctic Ocean. However, ocean temperature and salinity data obtained under sea ice by J-CAD were discrete data from instruments attached at a defined depth. We were very happy to have data that we had not been able to obtain before, BUT when we learned about the Argo float observations, we wanted to obtain a continuous distribution of ocean temperature and salinity in order to capture the unique structure of the Arctic Ocean stratification. However, because the Arctic Ocean is covered with sea ice, Argo floats cannot move up to the surface and data cannot be transmitted. Therefore, we started again to develop a new buoy by combining J-CAD and Argo float technology, working together with MetOcean. That is the POPS (Polar Ocean Profiling System). The POPS consists mainly of an ice platform and an Argo-type subsurface CTD profiler. An important point is that the Argo-type profiler is mounted on an oceanographic cable interfaced with the platform; the profiler moves along the cable. The inductive modem system provides data transfer between the ice platform and the profiler and then the data can be transmitted from the ice platform via satellite to our laboratory. More details are described in Kikuchi et al. (2007) (xii). The POPS allows us to obtain continuous data on ocean temperature and salinity under sea ice. It also allows the data to be transmitted in real-time, just as with usual Argo floats. The data from the POPS #3, installed at NPEO in April 2006, became the first Argo data to deliver from the Arctic Ocean (Fig. 5) (xiii, xiv).
Under the international Arctic research collaboration, such as NPEO (2006-2013) or collaboration cruise by the German research icebreaker, “Polarstern”, (2007-2008), we had opportunities to deploy POPS, collect ocean data under sea ice, and investigate changes in the Arctic Ocean and sea ice. The schematic of ice-buoy observation research is shown in Figure 6. By the way, the video of sea ice taken during the Polarstern 2007 cruise in the Arctic Ocean was used in the TV program, “NHK Special: Arctic Cataclysm” and it was a very impressible and important scene for Arctic environmental change, but that story may be discussed in another article :-)
(Next, I will write the topic about the observation using R/V Mirai, which we initiated in 1998.)
Side note: My first trip to the North Pole (the installation of J-CAD at the NPEO 2002).
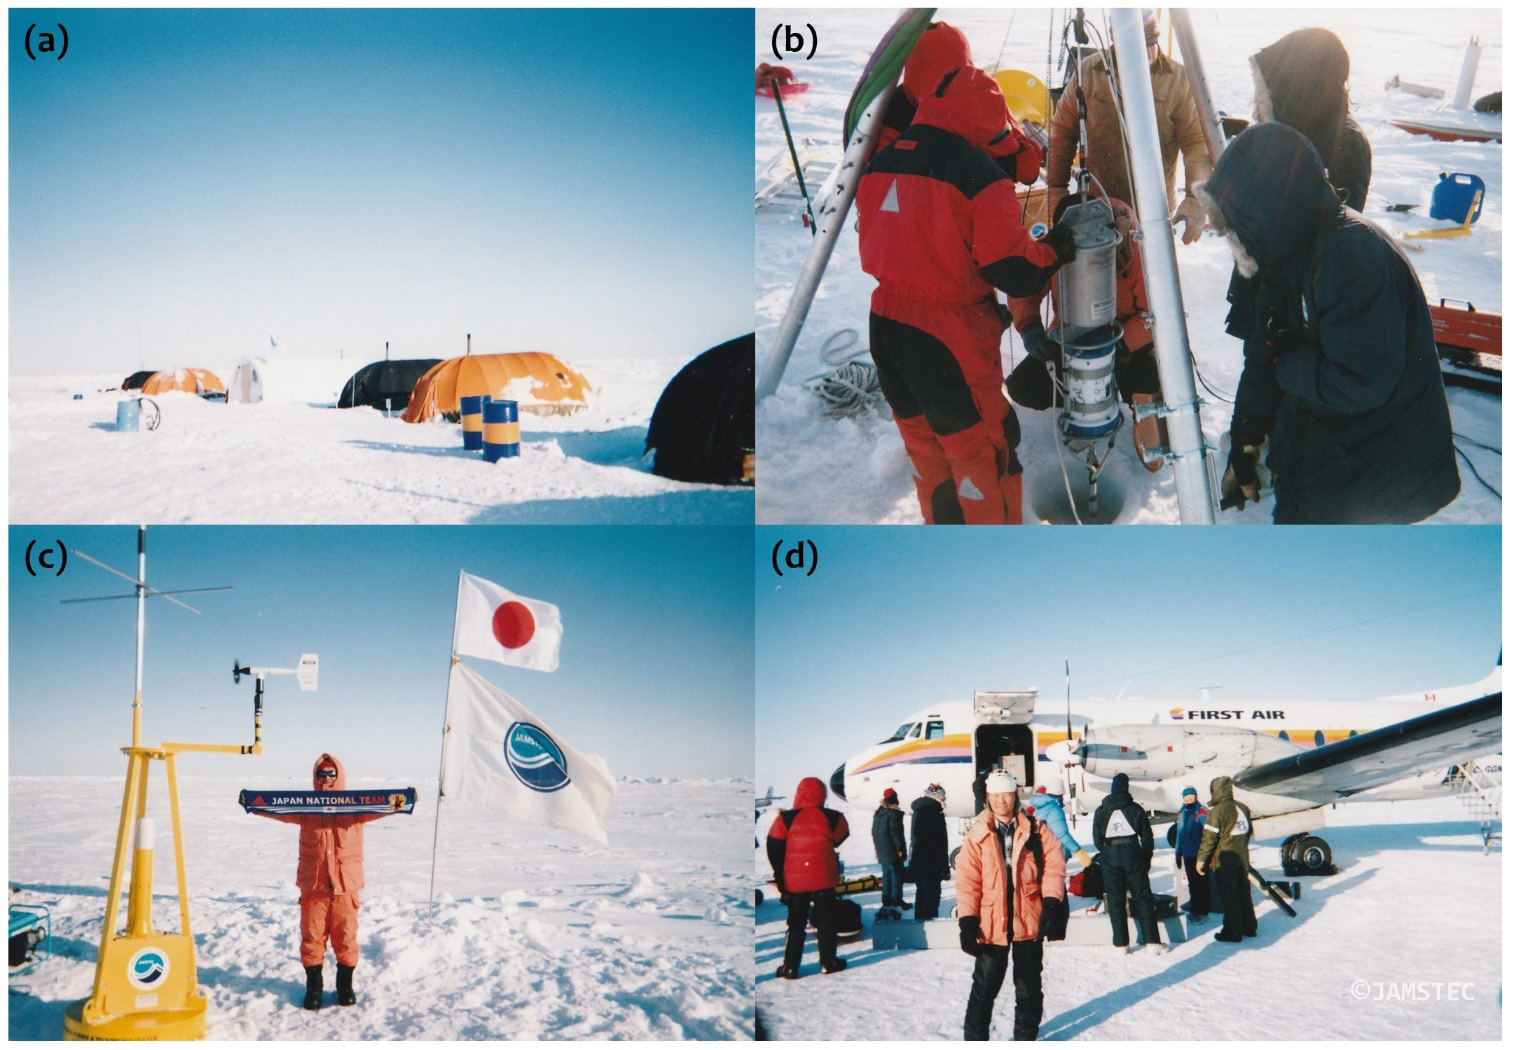
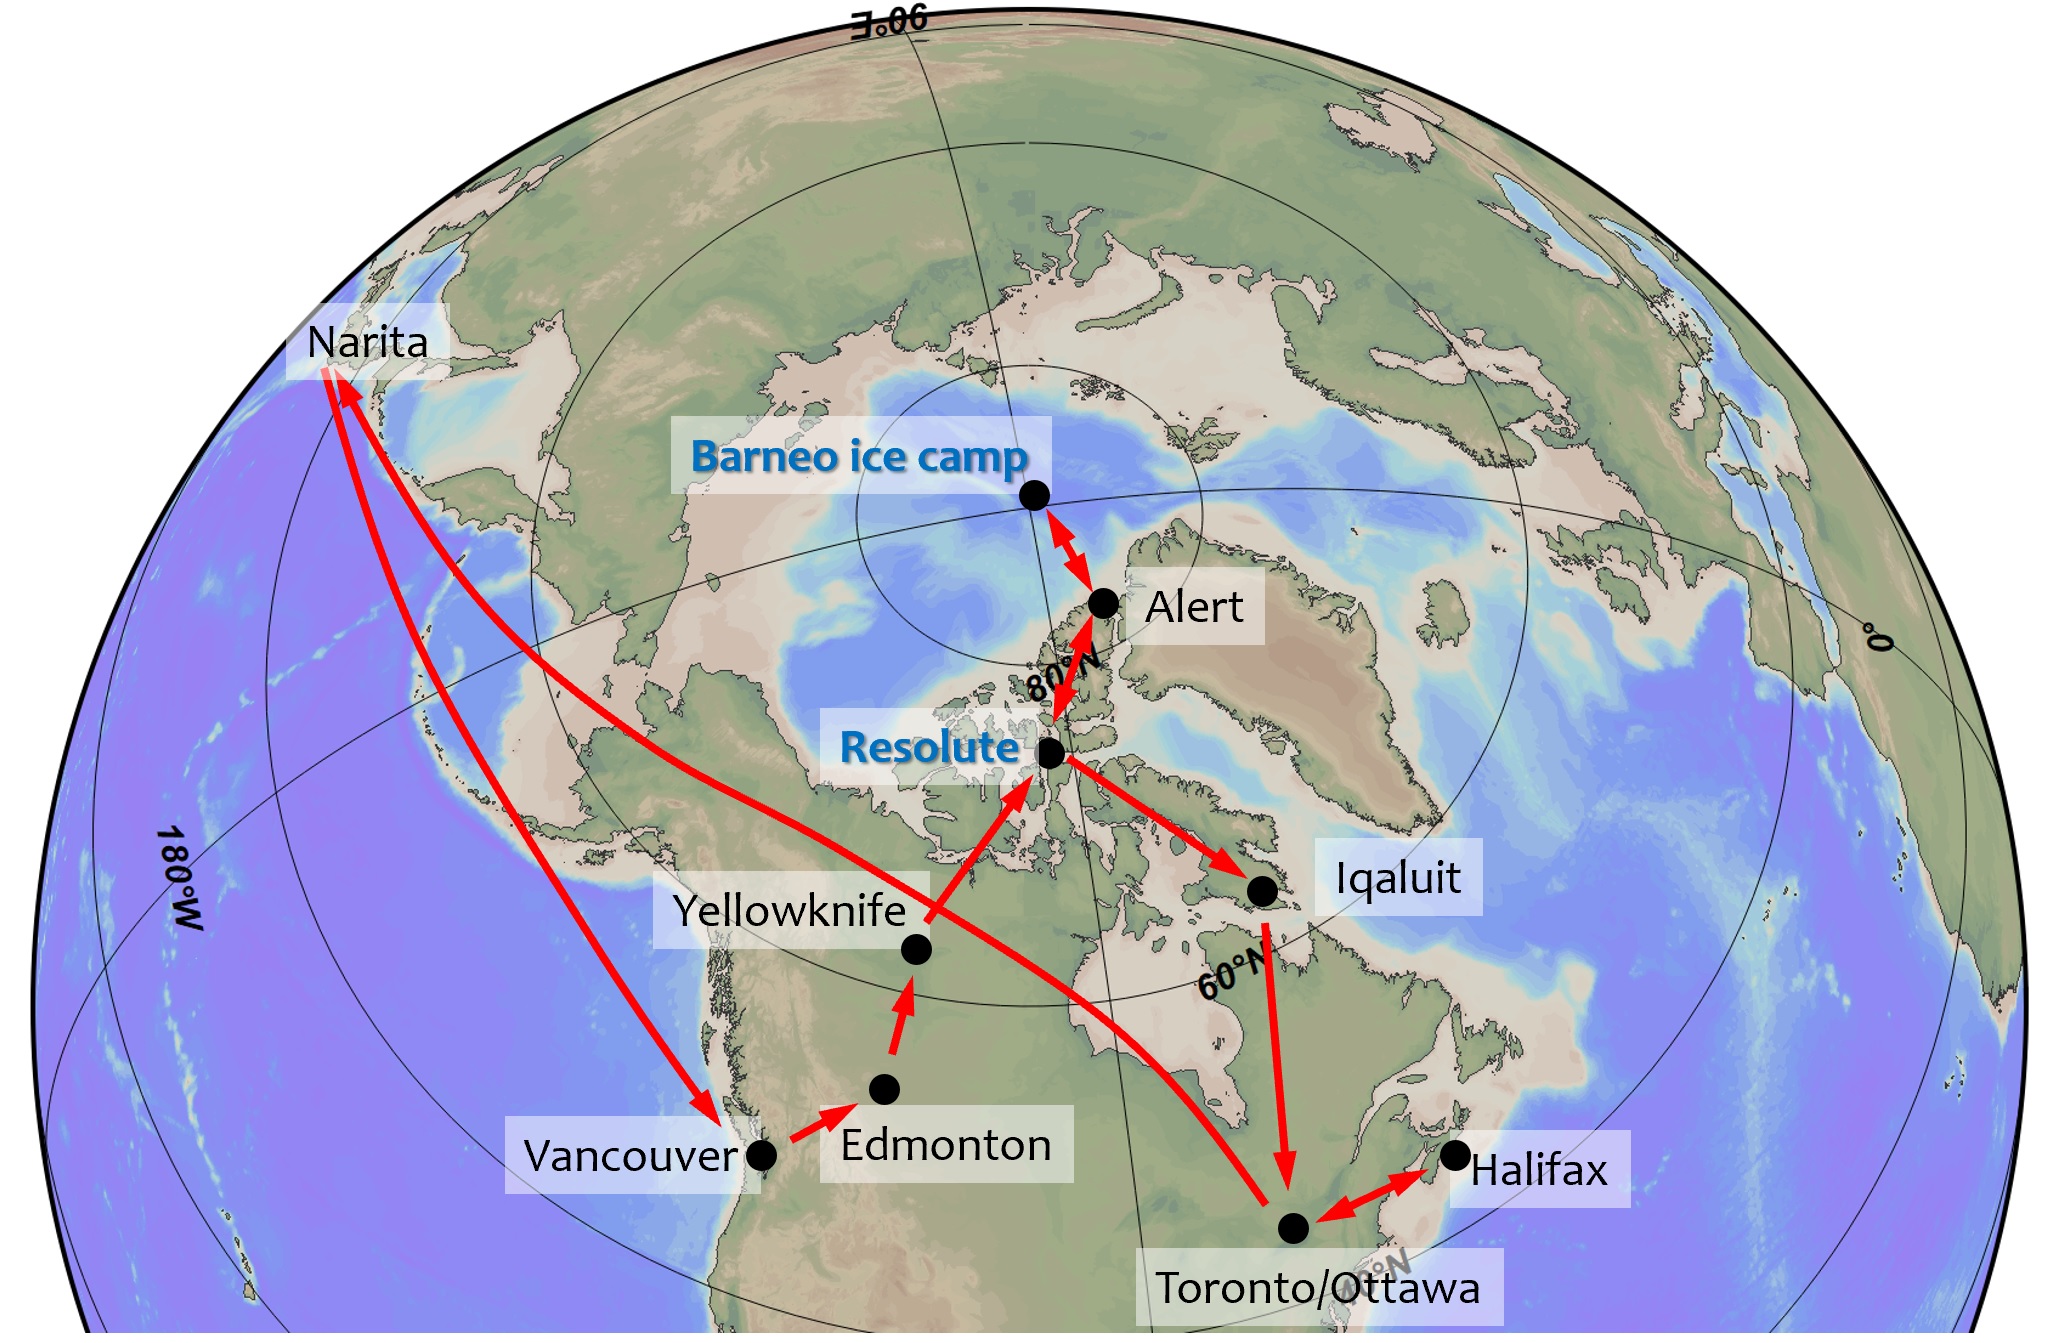
The trip for the NPEO 2002 was my first trip to the North Pole ice camp. Two from JAMSTEC, a marine technician and myself, participated in the NPEO 2002. On April 12 to 13, 2002, we moved from Japan through Vancouver and Edmonton to Resolute which is a town at 74oN on the island of the Canadian Archipelago. First, we checked the J-CAD and its installation equipment, which were transported from our laboratory earlier. There was a little trouble (some items were not delivered yet…), but it finally turned out to be okay. Then, we prepared to start at the ice camp and our mission (J-CAD installation on ice) and wait for the flight to the ice camp. On April 22, we headed out over the sea ice to the North Pole ice camp by a chartered plane.
At the NPEO mission, we used the Russian ice camp, named “Barneo”, which was operated mainly for sightseeing near the North Pole in April, but we were able to use it for scientific purposes. Staying at the Barneo ice camp, we looked for suitable sea ice near the camp and installed the J-CAD there. Also, the scientists of the NPEO conduct ocean and sea ice observations there. April is just the end of winter. The sea ice is the thickest and most stable of the year. The atmosphere during the NPEO 2002 was really wonderful. After the successful J-CAD deployment on April 24, I was standing on a white ice plate with nothing visible around me in the cool air. It was a marvelous experience that was hard to put into words. It was a lot of work on ice, but I wanted to come back here again. As a result, we continued the buoy observation mission going up to the North Pole ice camp almost yearly until 2013.
On the next day of the J-CAD deployment, we went back from the ice camp to the site to check the buoy and data transmission. We felt very relieved when we could confirm that the data was correctly transmitted. It was April 26 when we returned to Resolute, Nunavut, Canada after our work at the Barneo camp. The first shower I took at the hotel in many days felt so good. After cleaning up at Resolute, including the return of our equipment, we left Resolute on the afternoon of April 27 for Ottawa on First Air. It was a long flight through Iqaluit. As we approached Ottawa, the sky darkened and the city came into view at night. Yeah, I remembered that there had been NO night since I arrived at Resolute on April 13. I still remember feeling a bit like crying.
After enjoying TV sports news at the hotel near the Ottawa airport (I remember enjoying Stanley Cup playoffs.), we moved to Halifax and visit MetOcean to discuss plans for buoy production and scientific operation in the Arctic Ocean. Then, we finally came back to Japan on May 5. As a result, this trip spanned Canada from south to north and west to east (Fig. 8). I remembered that I left in early April when it was still chilly even enjoying the cherry blossoms, but when I returned to Japan, it was at the end of Golden Week in Japan and felt very warm. It was my first trip to the North Pole ice camp and I can say that it was a typical one. In such a way, we had been conducting the North Pole observation under the NPEO until 2013, although the buoys changed to POPS in 2006 and the location of the preparation changed to Spitsbergen, Norway, in 2009.
References
- Takizawa, T. (2001). Observational Research in the Arctic Ocean. The 30th Anniversary of the Japan Marine Science and Technology Center, Chapter 2. As a comprehensive marine research institute, p.102-108. (In Japanese)
- Kikuchi, T. (2022). History and Future of Arctic Ocean Research-Toward New Japanese Research icebreaker for the Arctic Ocean-. KANRIN/Bulletin of The Japan Society of Naval Architects and Ocean Engineers, 101, 28-34. (In Japanese)
- Perovich, D. K. et al. (1999). Year on Ice Gives Climate Insights (Project: SHEBA - Surface Heat Budget of the Arctic Ocean), EOS, 80, 41, 481,485-486, doi://10.1029/EO080i041p00481-01.
- Shimada, K., E. C. Carmack, K. Hatakeyama, and T. Takizawa, Varieties of Shallow Temperature Maximum Water in the Western Canadian Basin of the Arctic Ocean, Geophys. Rs. Lett., 28, 18, 3441-3444, https://doi.org/10.1029/2001GL013168.
- Hatakeyama, K., M. Hosono, K. Shimada, T. Kikuchi, and S. Nishino (2001). JAMSTEC Compact Arctic Drifter (J-CAD): A new Generation drifting buoy to observe the Arctic Ocean. J. Japan Soc. Mar. Sur. Tech., 13, 1, 55-68. (In Japanese)
- Hatakeyama, K., and Monk, T. (2001). Development and deployment of a compact Arctic drifting platform. Sea Technology 42 (7), 37–47.
- The North Pole Environmental Observatory Homepage, http://psc.apl.washington.edu/northpole/ (Referred on 2022-10-11)
- Kikuchi, T., H. Uno, M. Hosono, and K. Hatakeyama. (2004a). Accurate Ocean Current observation near the magnetic dip pole: compass error estimation. Japan Soc. Mar. Sur. Tech.,16, 1, 19-27. (In Japanese)
- Kikuchi, T., K. Hatakeyama, and J. H. Morison (2004b). Distribution of convective Lower Halocline Water in the eastern Arctic Ocean. J. Geophys. Res., 109, C12030, https://agupubs.onlinelibrary.wiley.com/doi/full/10.1029/2003JC002223 .
- Argo website, https://argo.ucsd.edu/ (Referred on 2022-11-11).
- Global Oceanic Environment Research Group, Research Institute for Global Change, JAMASTEC (2021), Researcher’s column: [Argo 2020] 20 years of measuring the world's oceans with Argo floats, https://www.jamstec.go.jp/j/pr/topics/column-20210205/ (written in Japanese, referred. on 2022-10-11)
- Kikuchi, T., J. Inoue, and D. Langevin (2007). Argo-type profiling float observations under the Arctic multiyear ice. Deep-Sea Res., 54, 9, 1675-1686, https://doi.org/10.1016/j.dsr.2007.05.011
- Press release from JAMSTEC (2006), World first real-time observation in the Arctic Ocean using Argo Float - Contributing to the improvement of accuracy of future climate prediction by providing data to the International Argo Project” (written in Japanese), June 13, 2006, https://www.jamstec.go.jp/j/about/press_release/2006/20060613/
- Kikuchi, T., J. Inoue, and N. Shikama (2006). Arctic Ocean observation by Argo-type CTD profiler. Argonautics, 7 (Jun. 2006), p.7.
- “NHK Special: Arctic Cataclysm”, NHK Archive Homepage (in Japanese), https://www2.nhk.or.jp/archives/tv60bin/detail/index.cgi?das_id=D0009010746_00000 (Referred on 2022-10-11)