
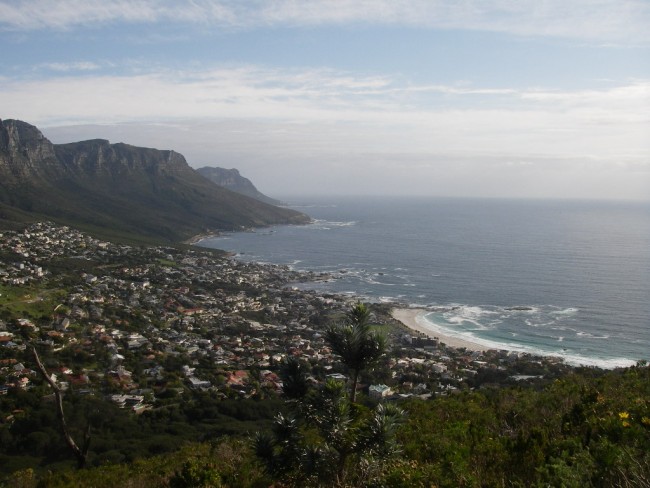

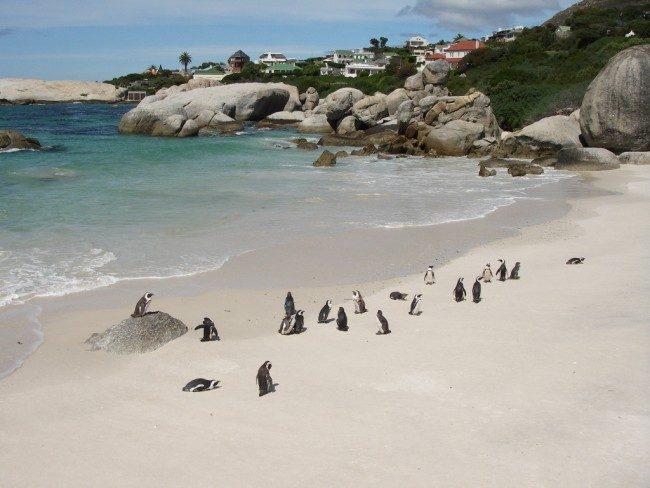
After a long break (I’d rather not call it a hiatus) I’m finally back to blogging on the tropical Atlantic. In my first post I promised to explain more about individual climate phenomena of the tropical Atlantic as they come along. Today, I think it’s time to talk about what’s been going on off the coast of southwest Africa since late 2015. So when it says “West Coast” in the title, we are actually not talking about California. After all, you probably wouldn’t expect to find these guys in California:
As mentioned in post #1, the waters off Southwest Africa undergo strong temperature changes on monthly to interannual (i.e. multi-year) time scales. When the water is warmer than normal this is called a Benguela Niño, and, if you are familiar with the Niño/Niña terminology, you might have already suspected that the opposite is called Benguela Niña.
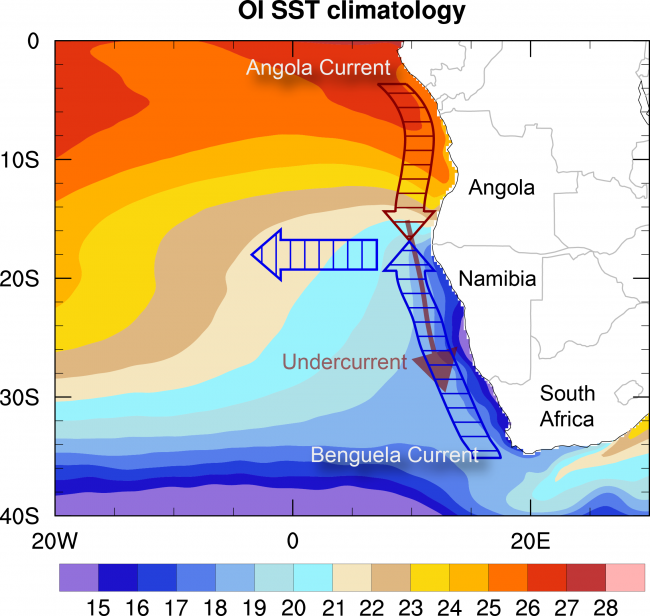
Before we discuss the recent developments, let’s take a look at the mean climate (climatology) of the region (Fig. 3). What you might notice first is the strong north-south gradient of sea-surface temperatures (SST): 26ºC at the equator compared to 15ºC at 40ºS. This is expected because the sun is much stronger at the equator than at 40ºS. It gets more interesting though because there is also a pronounced east-west gradient: SSTs are coolest along the coast and increase in the off-shore direction. This is most noticeable off the coasts of Namibia and South Africa where temperatures dip below 15ºC. So if you want to go surfing there a wet suit is recommended (as well as watching out for sharks). The reason for the cool temperatures along the coast is “upwelling”, which is the upward motion of cold, nutrient-rich water to the surface.
Another interesting aspect in Fig. 3 is the sharp north-south SST gradient off the coast at 15ºS. This region is called the Angola-Benguela Front (ABF) because it is approximately where the equatorward Benguela Current meets the poleward Angola Current. When push comes to shove something has to give and so the Angola Current goes below the surface and continues to flow poleward along the coast, while the Benguela Current veers offshore.
So much for the climatology. During Benguela Niños two things happen: 1) the Angola Current penetrates further south, pushing the ABF further south as well, and 2) the coastal upwelling weakens. The result is wide-spread warming along the coast of southwest Africa and a reduction of nutrients in the upper ocean because the nutrient supply from the deep weakens. In extreme cases, like that of the 1995 Benguela Niño, it can lead to the collapse of fisheries. Why these events occur is relatively well known, although there is still some debate regarding the relative importance of individual factors (Florenchie et al. 2004; Rouault et al. 2007; Lübbecke et al. 2010; Richter et al. 2010; Bachelery et al. 2016).
So what happened in 2016? Let’s take a look at the daily mean SST anomalies that NOAA kindly provide on their website (you can check the latest data here). On January 24, 2016, it looked like this:
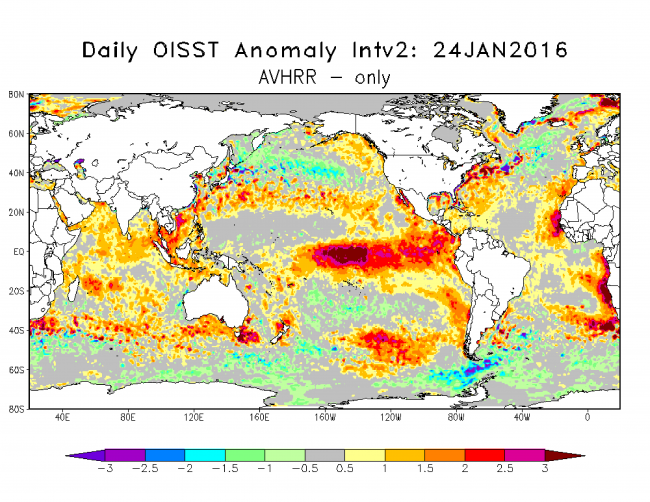
The first thing you’ll probably notice is the dark red spot in the center: that is the 2015/16 Super El Niño. But if you look a little to the right you will notice that there are also extraordinarily warm temperatures along the coast of southwest Africa. In fact, temperatures were so high that they seem to have forced NOAA’s (presumably) automated plotting routine to readjust the color scale because this is what the SST plot looked like on January 25:
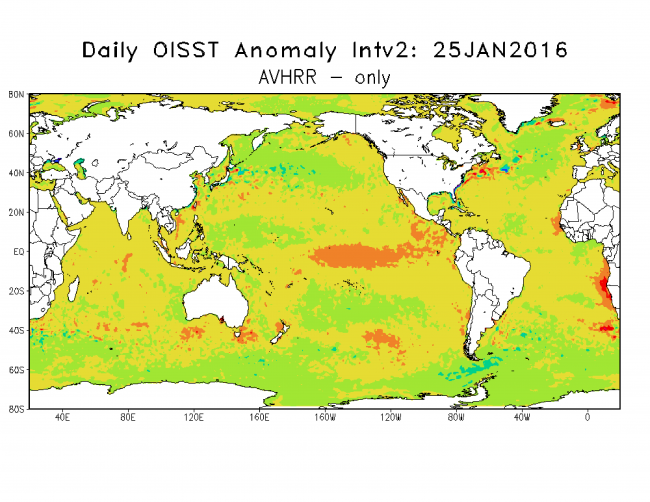
The color bar has gone missing but the bright red in the ABF presumably shows SST anomalies above +4ºC. Daily mean SST, however, can change quite a bit over short periods. So was this just a one-day-wonder or was it a prolonged event that deserves to be called Benguela Niño? And how unusual were those high SST in the region? To examine this, we average the SST anomalies over an area that extends from 8ºE to the coast, and from 25-15ºS, as shown in Fig. 6. We also calculate the 5-day mean to reduce fast (high-frequency) fluctuations. These values are then plotted from January 1 to May 31 (when Benguela Niños typically occur) for each year in the OISST dataset (1982-2016). The result can be seen in Fig. 6.
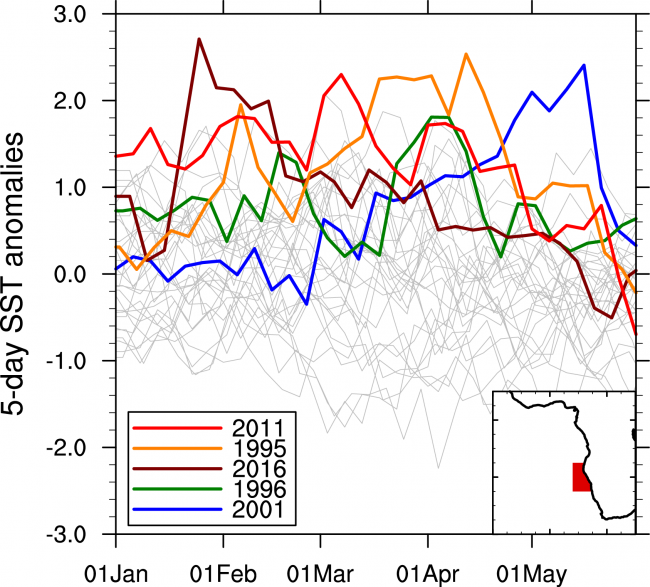
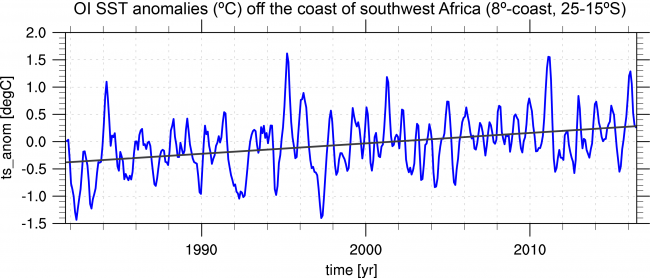
The impressive warming in late January of 2016 is obvious and it is actually the warmest anomaly in the 1982-2016 record (we only show January through May, but examining the entire record confirms that Jan 2016 did indeed break the record). We also see that temperatures decline relatively quick after the peak in late January. This sets 2016 apart from more typical Benguela Niño years like 1995 or 2011, which build up more gradually and tend to peak around April. When we consider the average over the period January through May, the year 2016 ranks as the 3rd warmest event in the region behind 2011 and 1995. This ranking may be misleading, however, because the region is also subject to a significant warming trend since the 1980s, as can be seen from Fig. 7 (the best-fit line suggests a trend of 0.2ºC per decade). This means that the warm event got a boost from the slowly increasing background temperatures. If you correct for this warming (by removing the linear trend, aka “linear detrending”), the event only ranks as the 6th warmest; still sizable but not extraordinary.
In summary, the warming off the coast of southwest Africa in late January was remarkable in an absolute sense (because it smashed the previous 5-day mean record) but when one considers that the mean state has warmed, the event was only of medium strength. It was also relatively short lived. The potential impact of the event on local fisheries is something I might want to discuss in a future post. Another important question is to what extent the warming trend adds to the environmental impacts of Benguela Niños.
References
Bachèlery, M.-L., S. Illig, and I. Dadou, 2016: Forcings of nutrient, oxygen, and primary production interannual variability in the southeast Atlantic Ocean. Geophys. Res. Lett., 43, 8617–8625, doi:10.1002/2016GL070288.
Florenchie, P., C. J. C. Reason, J. R. E. Lutjeharms, M. Rouault, C. Roy, and S. Masson, 2004: Evolution of interannual warm and cold events in the southeast Atlantic Ocean, J. Clim., 17, 2318–2334.
Lübbecke, J. F., C. W. Boning, N. S. Keenlyside and S.-P. Xie, 2010: On the connection between Benguela and equatorial Atlantic Ninos and the role of the South Atlantic anticyclone. J. Geophys. Res.-Oceans, 115, C09015, doi:10.1029/2009JC005964.
Richter, I., S. K. Behera, Y. Masumoto, B. Taguchi, N. Komori, and T. Yamagata, 2010: On the triggering of Benguela Niños: Remote equatorial versus local influences. Geophys. Res. Lett., 37(L20604). doi:10.1029/2010GL044461
Rouault, M., S. Illig, C. Bartholomae, C. J. C. Reason, and A. Bentamy, 2007: Propagation and origin of warm anomalies in the Angola Benguela upwelling system in 2001, J. Mar. Syst., 68, 473–488, doi:10.1016/ j.jmarsys.2006.11.010.